Summary
Large cancer cell line collections broadly capture the genomic diversity of human cancers and provide valuable insight into anti-cancer drug response. Here, we show substantial agreement and biological consilience between drug sensitivity measurements and their associated genomic predictors from two publicly available large-scale pharmacogenomics resources: The Cancer Cell Line Encyclopedia and the Genomics of Drug Sensitivity in Cancer.
In vitro pharmacologic sensitivity studies performed across panels of molecularly characterized cancer cell lines have proved useful in assessing the cellular activity of many compounds, assigning mechanisms of drug action, and determining genetic contexts for distinct cancer vulnerabilities1–6. A recent comparison study7 of the Cancer Cell Line Encyclopedia (CCLE)8 and the Genomics of Drug Sensitivity in Cancer (GDSC)9 reported poor correlations between their pharmacologic data, and questioned the validity of their conclusions. These observations raised important questions for the field about how best to perform comparisons of large-scale datasets, evaluate the robustness of such studies, and interpret their analytical outputs.
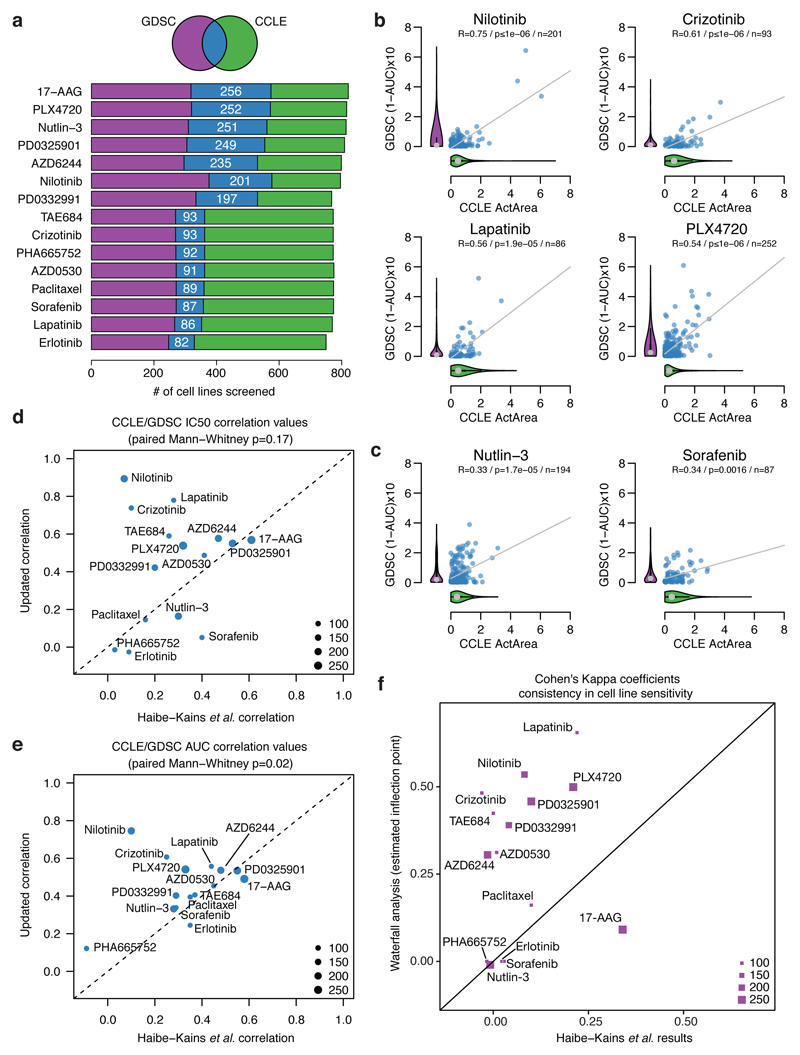
To address these questions, we first performed a comparative analysis of CCLE and GDSC drug screening metrics. For this analysis, we used both the 50% inhibitory concentration (IC50) and the Area Under the Curve (AUC – also referred to as Activity Area in CCLE when considering 1-AUC). Importantly, the IC50 values in both datasets were capped at the maximum tested drug concentrations, and the same fixed scale was applied across all compounds (Supplementary data 1). Of note, while 471 cell lines are present in both CCLE and GDSC collections and have associated genomic data, only a subset of those have overlapping drug screening data: a range of 82-256 cell lines per compound (median = 94 cell lines; mean = 157, figure 1a and Supplementary Data 1).
Figure 1. Comparison of pharmacologic data from the CCLE and GDSC studies.
a, Overlap of datasets. b-c, Comparison of drug sensitivity (AUC) measured in (n) overlapping cell lines between the studies for drugs with good (b) or poor (c) correlation. R: Pearson correlation coefficient p: p-value. Violin plots: distribution of sensitivity values for all lines in each study. Grey dot: median, black line: interquartile range, shape: kernel density of the distribution. d-e, Correlation coefficients between GDSC and CCLE datasets, x-axis: Spearman, Haibe-Kains et al, y-axis: Pearson, present analysis. Dot sizes are proportional to the number of overlapping cell lines. Dots above the dashed y=x line denote an improved correlation compared to Haibe-Kains et al. f. Comparisons of Cohen’s Kappa coefficient testing studies’ agreement in Haibe-Kains et al. (x axis) and the present study (y axis) for sensitivity/resistance calling using a waterfall plot analysis.
Our analytical approach was designed to account for the fact that many pharmacologic profiles exhibit highly discontinuous distributions across cancer cell line collections. Whereas a subset of individual lines may show marked pharmacologic sensitivity, the remaining lines—often the vast majority of cell lines in the collection—may be relatively insensitive to a given drug. Such ‘outlier’ distributions are expected as they are frequently observed for drugs that target specific oncogenic dependencies. Given the relative paucity of sensitive outliers, appropriate pharmacologic assessments require multiple drug-sensitive cell lines for each compound and the ability to discern this relevant signal against a background dominated by the insensitive majority. Additionally, small datasets containing exclusively insensitive lines are not expected to display significant correlations given the inherent noise in their drug response data.
In cases where direct GDSC-CCLE comparisons were possible, nearly all compounds (13/15) exhibited AUC and IC50 distributions dominated by drug-insensitive lines, with a much smaller number of drug-sensitive outliers. The complete CCLE and GDSC AUC distributions are illustrated in aggregate for each compound by “violin plots” (representative examples are shown in figure 1, and all plots in Extended Data figure 1); results for IC50 values are similar (Extended Data figure 1). Ten compounds (saracatinib/AZD0530, erlotinib, lapatinib, nilotinib, crizotinib, nutlin-3, PD-0332991, PHA-665752, PLX4720, sorafenib) exhibited AUC values skewed heavily toward the drug-insensitive end of the spectrum. Notably, several targeted anticancer drugs had very few (if any) drug-sensitive lines in the overlapping set (e.g., 2 for crizotinib, 3 for nilotinib, 2 for NVP-TAE684, and zero for erlotinib or sorafenib, Figs. 1b,c and Extended Data figure 1). This relative paucity of drug-sensitive cell lines constrained the level of correlation achievable. Nevertheless, a correlation analysis that accounted for the imbalance between the number of sensitive and insensitive cell lines and corrected for differences in the original analytical methodologies yielded good consistency in most cases (Extended Data figure 2 comparing Spearman’s and Pearson’s correlations properties in this context, and supplementary text). New correlation values using the Pearson correlation coefficient instead of Spearman’s, as well as properly capped drug sensitivity metrics were clearly improved for most drugs compared to the earlier comparison study7 (figure 1d and 1e, Methods and Supplementary text). We noted that some correlation values remained poor, either due to differences in actual pharmacological measurements (e.g. nutlin-3, paclitaxel, PHA665752) or because sensitive lines were only present in one of the cell line collections (e.g. erlotinib, sorafenib), preventing any meaningful comparison (figure 1c).
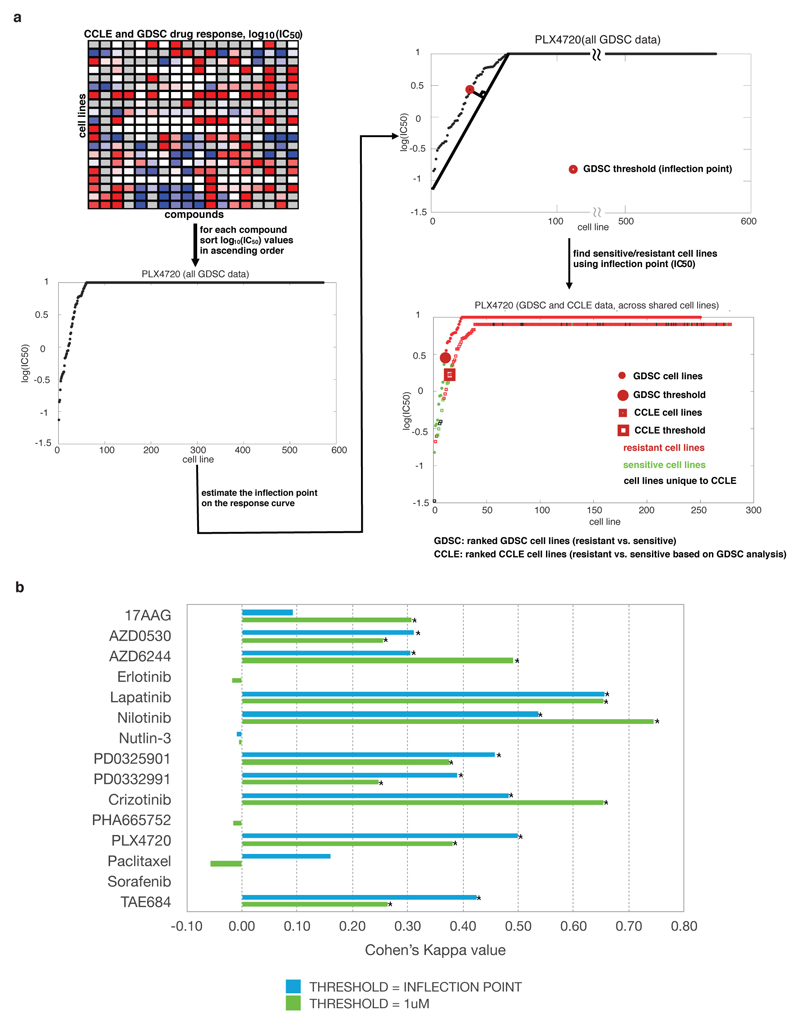
To complement this correlation analysis, we used a waterfall plot-based assessment (Extended Data figure 3 shows a schematic of the workflow and further details are provided in the supplementary text). This analysis confirmed that on average, 94% of cell lines for the 13 relevant compounds (CCLE mean = 94%, range = 77-100%; GDSC mean=96%, range= 86-100%, supplementary data 2) clustered within a drug-insensitive range (e.g., IC50 values of > 1 µM for most compounds). These waterfall analyses also showed a high consistency of cell line categorization as “sensitive” or “resistant” between CCLE and GDSC data (figure 1d, Extended Data figure 3). This consistency was evident even when using a simple drug sensitivity cut-off (1 µM) across all the drugs tested (Extended Data figure 3). Thus, both categorization approaches showed higher consistency than reported in the earlier study7 (see supplementary text).
These results indicated that the CCLE and GDSC cell line pharmacologic screening data are best suited for modeling studies that distinguish rare, drug-sensitive lines from “all others” (e.g., from drug-insensitive lines that are not expected to contribute meaningful molecular or genetic information). Given this, we next considered the extent to which the CCLE and GDSC cell line collections illuminated common genetic or molecular underpinnings of anticancer drug efficacy. Such insights provide one of the most relevant measures for concordance and utility of pharmacologic screening data, given that these efforts are designed to identify such predictors of drug response.
We first conducted an analysis of variance (ANOVA) using only the overlapping lines across the CCLE and GDSC. We considered two models where the predicted variables were IC50 values or activity area (i.e. 1-AUC) scores, respectively. In both models we considered the tissue-of-origin as a covariate and the mutational status of 71 oncogenes as independent variables.
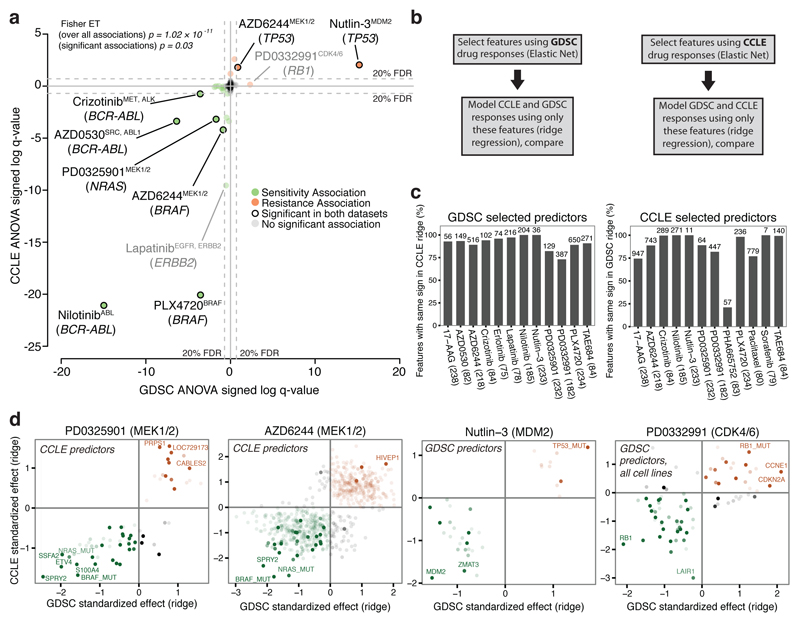
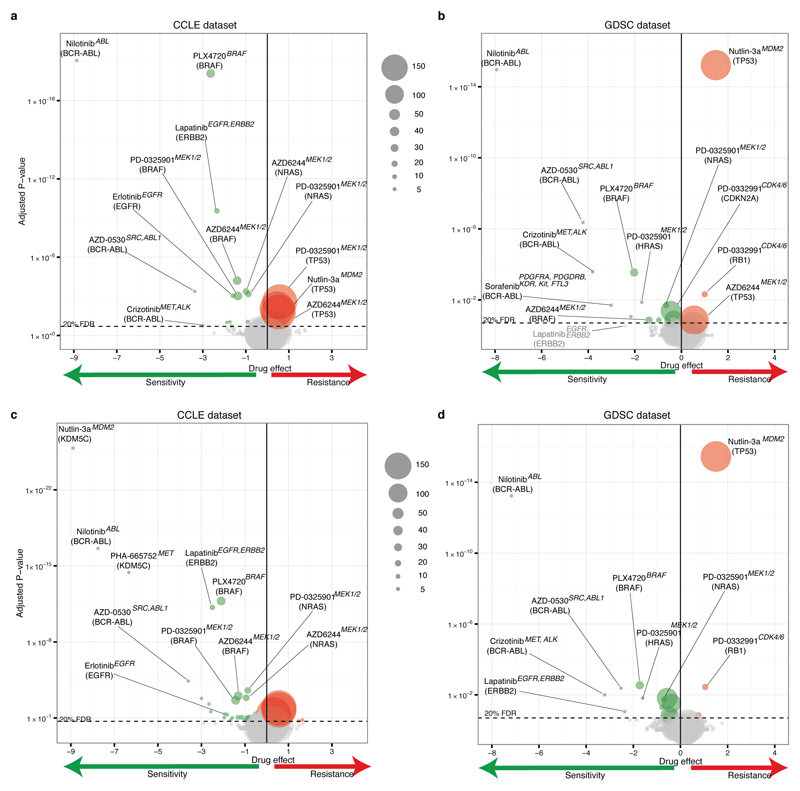
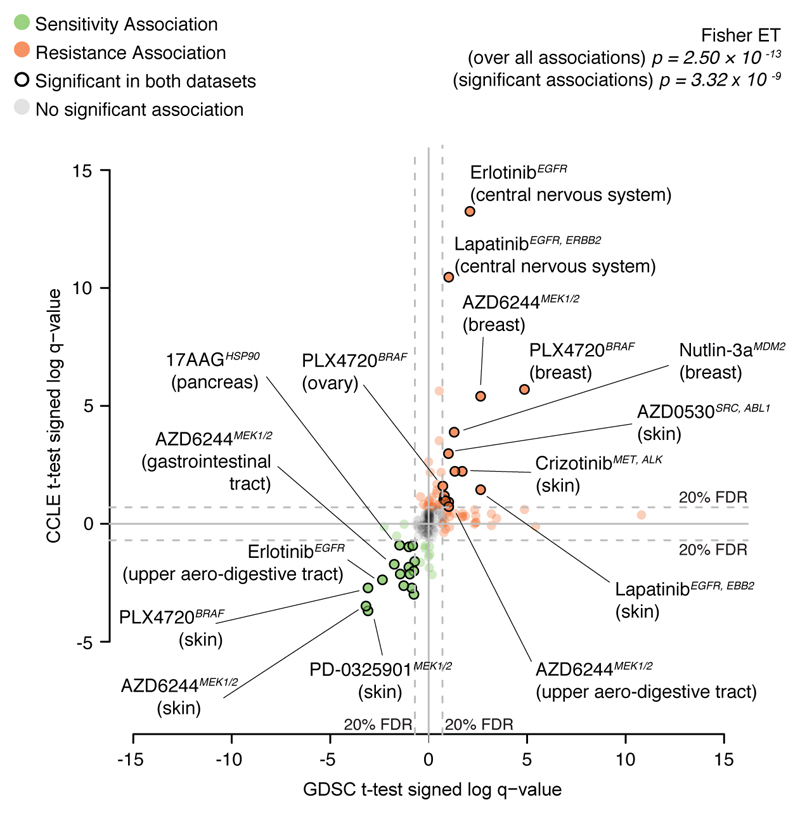
ANOVA identified known genetic biomarkers of sensitivity or resistance as top molecular correlates in at least one dataset for 13/15 compounds, and in both datasets for 8/15 compounds (figure 2a, Extended Data figure 4, Supplementary Data 3). Molecular correlates in both datasets included NRAS mutation and sensitivity to MEK inhibitor PD0325901, BRAF mutations and sensitivity to BRAF inhibitor PLX4720, the BCR-ABL fusion gene and sensitivity to multiple ABL inhibitors (nilotinib, AZD0530) and sensitivity of ERBB2-amplified cells to ERBB2 inhibitor lapatinib (identified when using IC50 values, Extended Data figure 4). Additionally drug resistance associations such as TP53 mutations and resistance to nutlin-3 were recovered consistently using activity area scores. When ANOVA was fitted to activity area, 14 drugs for the GDSC and 15 for the CCLE also showed lineage-specific response associations that were consistent across datasets (systematic t-test; Extended Data figure 5 and Supplementary Data 4,7).
Figure 2. Consistency of drug sensitivity prediction markers between the CCLE and GDSC datasets.
a, ANOVA on overlapping dataset (1-AUC). Coordinates: 'signed log q-values'. Negative sign: gene associated with increased sensitivity, positive: increased resistance. Distance from 0: q-value. Fisher ET: Fisher exact test of consistency of marker behavior on all or only significant associations. Markers in grey are not significant; markers highlighted are significant in both the studies. b-d, Elastic net and ridge regression analysis. b, Analytical strategy. c, Proportion of genomic features with consistent effect on drug response in both studies (total number of features tested displayed above the bar and number cell lines indicated in parentheses). d, Ridge regression using predictors selected by elastic net. Contrast: frequency of selection in 100 independent elastic net runs. Green and red: association with sensitivity or resistance respectively.
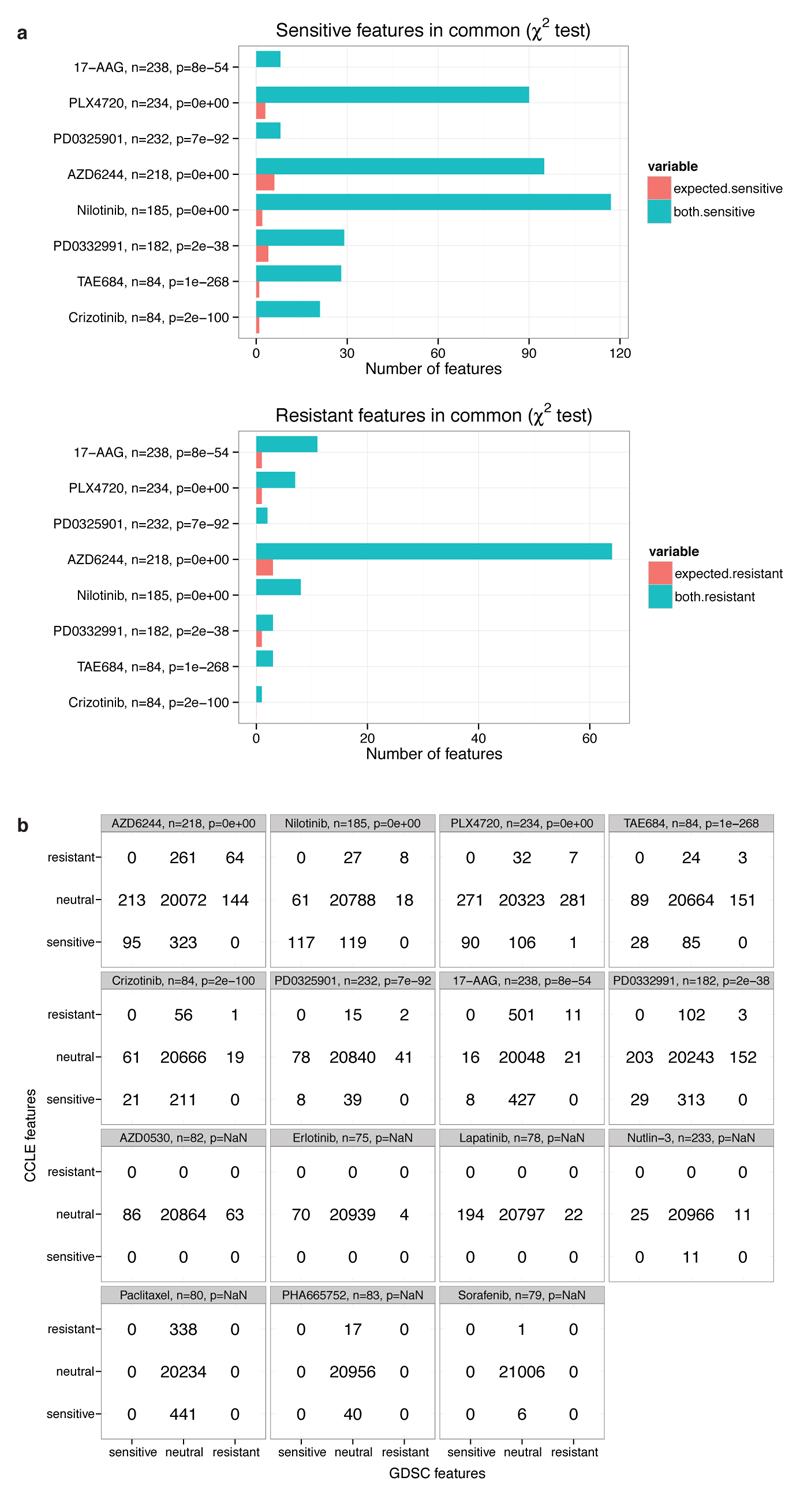
In a more comprehensive assessment of the consistency of genomic predictors, we applied a multivariate analysis across 21,013 genomic features encompassing expression, copy number changes and mutations8,9. Elastic net regression was performed using either the full dataset available for each study or only the overlapping datasets. This analysis yielded robust response predictors, and the overlap of predictors was highly significant (Chi square p < 10-8, Extended Data figure 6, Supplementary Data 5). Here again, known genomic predictors of drug response emerged as top molecular correlates in at least one dataset for 13/15 compounds; 10/15 compounds showed such correlates in both datasets (Supplementary Data 5), as reported previously by CCLE and GDSC using their individual datasets8,9. For some drugs, extending elastic net regression analyses of IC50 values beyond just the overlapping cell lines identified additional genetic predictors of clinical activity. MDM2 expression and TP53 mutation in the case of nutlin sensitivity provide one example. Moreover, among 4957 drug gene associations found using elastic net modeling on each dataset, we only observed one divergent result (0.02%) between the two studies.
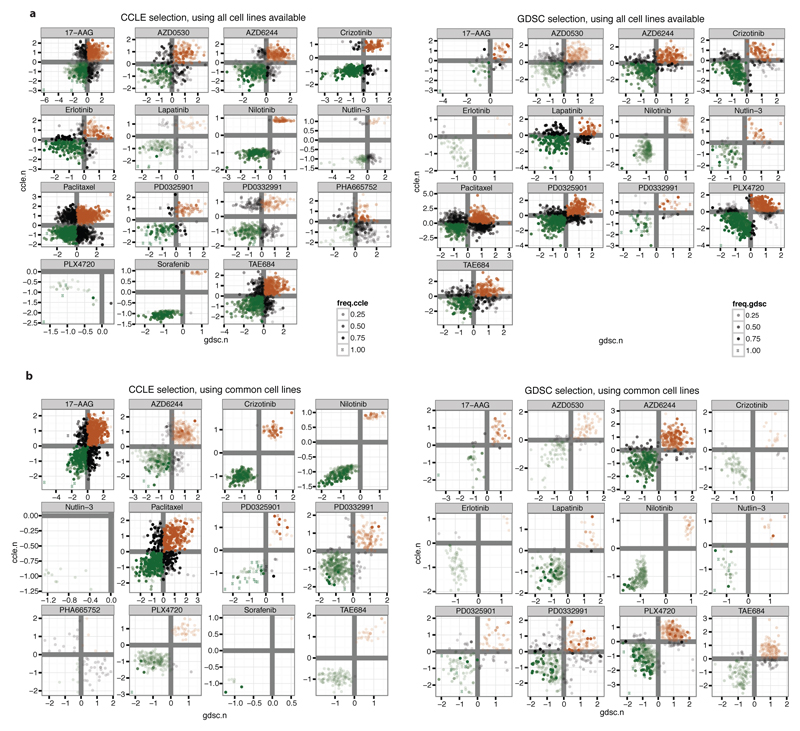
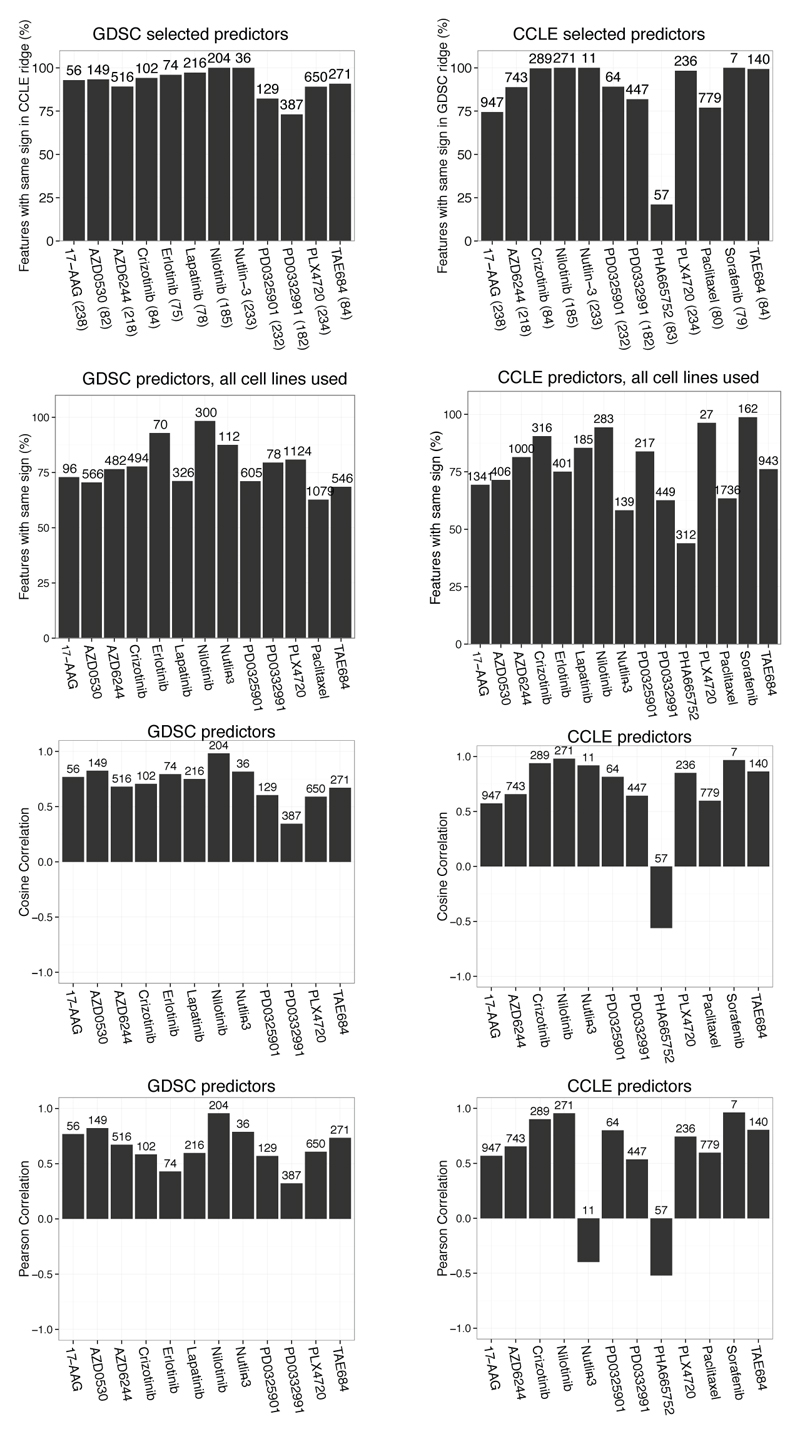
To further explore how the two datasets might be leveraged to identify genomic predictors of drug sensitivity, we performed a two-step analysis where predictors were identified using one dataset and their effects were analyzed in the other dataset. Here, we used elastic net regression to identify the genomic features and ridge regression to compare their effect across the datasets (figure 2b and Supplementary text). Additionally, we performed this discovery step either on the overlapping cell lines or on all lines available in the respective studies.
We again observed a high consistency of predictive genomic features identified across the CCLE and GDSC studies, even for drugs where few overlapping cell lines were available. Indeed, >80% of these features identified with concordant directionality in both studies (figure 2c,d, Extended Data Fig 7, 8 and Supplementary Data 6, features with same sign). In some instances, no predictors could be identified by the initial elastic net regression. This was often attributable at least in part to small numbers of drug-sensitive cell lines, as noted above. On the other hand, some drugs that exhibited low correlations based on the AUC or IC50 analyses nonetheless enabled identification of consistent predictors (e.g., nutlin-3; figure 2d).
Together, these results indicate that the CCLE and GDSC pharmacologic datasets exhibit reasonable predictive power both separately and when taken as a whole. Many of the resulting drug response predictions are well validated by prior knowledge and clinical evidence. In this regard, not only do the two sets of drug screening data exhibit broad convergence, they also provide examples of consilience: a phenomenon in which independent lines of experimental evidence, each with their own inherent limitations, arrive at fundamental scientific agreement.
In summary, when analytical and biological considerations are incorporated that reflect the nature of oncogenic dependency, pharmacologic data from the CCLE and GDSC studies exhibit reasonable consistency. Based on positive Pearson correlations (R > 0.5), we observed agreement across the CCLE and GDSC datasets for the majority (67%) of evaluable compounds (two drugs with clear positive regression slopes showed R values just under 0.5 for the IC50 values; Extended Data figure 1). We acknowledge that the consistency is not perfect: numerous methodological components (e.g., numbers of cell lines seeded per well, drug concentration range examined, number of cell doublings achieved, cell viability assays, analytical tools to calculate sensitivity values, etc.) undoubtedly reduced the statistical correlation of the overlapping pharmacological data. Further standardization of such methodologies will certainly improve correlation metrics, and we welcome efforts in this direction. Nonetheless, both the CCLE and GDSC groups used standard methods for testing drug responses in cell lines, and this analysis confirmed that the consistency of their results seems reasonable in light of the aforementioned methodological differences.
The identification of molecular predictors of drug response remains a major challenge for cancer precision medicine. Accordingly, large-scale screening of clinically-relevant compounds across molecularly annotated cancer cell line collections will likely remain a crucial preclinical source for hypothesis generation. The CCLE8 and GDSC9 datasets, the two biggest public collections of genomic and pharmacologic cell line data, have produced largely concordant results thus far, although rigorous comparisons should continue to be performed as these datasets evolve. Although neither dataset is perfect on its own, they have both shown clear utility for predictive modeling studies and, in several cases, convergence onto known biological principles. Principled analytical frameworks (together with improved standardization) may conceivably illuminate additional areas of consilience through comparative studies of other functional screens (e.g., RNAi, CRISPR, phospho-proteomics, etc.) in the future. In all such instances, knowledge of the underlying biology should guide the implementation of those analytical and statistical methods best suited for comparative studies and, more generally, the extraction of meaning from large-scale screening data in cancer and other disease models.
Extended Data
Extended data Figure 1. Comparison of pharmacologic data from the CCLE and GDSC studies.
Scatter plots (blue dots) represent the drug sensitivity measured as the Area Under the dose-response Curve (a) and IC50 (b) in overlapping cell lines between CCLE and GDSC studies. For this analysis, IC50 values for insensitive compounds were set to the highest concentration tested in both datasets. The number of overlapping cell lines n for each drug is indicated, as well as the Pearson correlation coefficient R and p-value. In this representation, lower values denote insensitive cell lines. The full distribution of sensitivity values for each drug and study is depicted as ‘violin plots’ (green: CCLE; purple: GDSC) and accounts for all tested cell lines, as opposed to the overlapping set; the grey dot represents the median, thick black line represents the first to third quartile range, and shape of the plot represents the kernel density of the distribution.
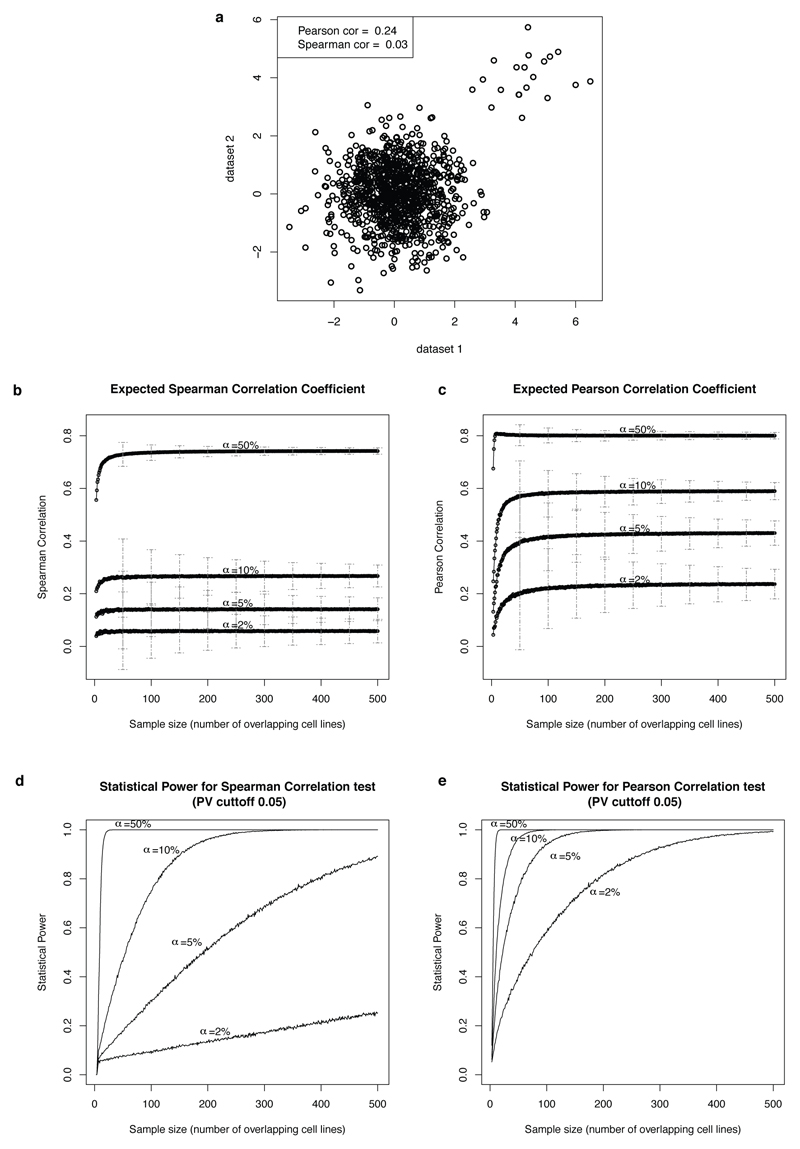
Extended Data Figure 2. Power Analysis of Spearman and Pearson correlation tests.
a, Example of a clear signal that appears in only 2% (20 out of 1000) data points using synthetic data. The Spearman statistic completely fails to detect such a signal which is typical for selective cancer therapeutics. b-c, Expected Spearman and Pearson correlation coefficients between the two datasets assuming different percentages of drug sensitive cell lines (alpha=2%,5%,10%, and 50%) and different number of overlapping cell lines. The error bars depict +/- one standard deviation. d-e, Estimated statistical power for Spearman and Pearson correlation tests using a P-Value cutoff of 0.05 for rejecting the null hypothesis. This analysis was done using synthetic data as described in the Methods section.
Extended Data Figure 3. Waterfall analysis for categorization of cell lines.
a, Schematic of the waterfall analysis methodology and example of outcome for PLX4720. b, Consistency in cell line sensitivity categorization for all drugs. The waterfall method using all data available was used to determine thresholds between “sensitive” and “resistant” cell lines (Blue). Alternatively a 1 uM threshold was used (Green).
Extended Data Figure 4. Overlap in ANOVA genomic correlates of drug sensitivity.
Volcano plots showing analysis of variance (ANOVA) outcomes using drug responses from CCLE (left panels: a, c) or GDSC (right panels, b, d) dataset from overlapping set of cell lines, and mutational status of 71 cancer genes from the GDSC. a-b, Analyses using AUC values. c-d, Analyses using IC50 values. Points represent drug–gene interactions (with sizes proportional to the number of screened mutant cell lines). Positions on x-axis indicate effect size magnitudes: negative values (green circle) indicate mutations associated with increase in sensitivity, positive values (red circle) mutations associated with increased resistance. Positions on y-axis indicate association significances (corrected p-values) and the horizontal dashed line indicates a significance threshold (FDR 20%). Corresponding drug name, target(s) and cancer gene are reported for a subset of therapeutically relevant interactions.
Extended Data Figure 5. Consistency of drug sensitivity/tissue-of-origin associations between the CCLE and GDSC datasets.
Each point is a tested association between drug response and a given cell lines’ tissue of origin. Positions of the points on the two axes correspond to 'signed log q-values' of the corresponding tests, for the two datasets respectively. Point labels indicate drug names and targets (in italic) and tested tissue (among round brackets). The sign indicates the effect of the marker (neg = increased sensitivity and pos = increased resistance) and the magnitude indicates the log p-value of the corresponding t-test, after correcting for multiple hypothesis testing. Fisher exact test p-values for independence of columns and rows of the contingency table determined by sign and significance of the associations are also reported (over all the tests and for significant associations only, respectively).
Extended Data Figure 6. Comparison of genomic features selected by Elastic Net between the CCLE and GDSC datasets.
a, consistency in predictors of response identified by elastic net regression across 21,013 genome features (copy number variations, mRNA expression and sequence variants). Statistical significance of the number of genomic features identified in common (χ2 test) using the GDSC and CCLE drug sensitivity datasets. Only drugs where features were found in both studies are represented. b, corresponding contingency tables. Out of the 4,957 drug/gene associations with nonzero elastic net weight coefficients, only one divergent result was found (weight coefficient with opposite signs) corresponding to a feature with the lowest possible frequency (nonzero coefficient in 1 out of 100 bootstrap trials in the elastic net analysis).
Extended Data Figure 7. Comparison of genomic feature-drug associations in the CCLE and GDSC datasets.
Ridge regression coefficients for all the drugs with successful elastic net regression in the indicated dataset are plotted using either, a, overlapping or b, all available cell lines. To select cell line features, elastic net was performed using the indicated dataset. Then, ridge regression was performed on each dataset using the selected features. For plotting, the weights associated with the features were multiplied by the standard deviation of the features as in Garnett et al.9, and then standardized per drug. Color scale indicates the number of times a feature is selected in 100 independent runs of the elastic net. Green and red coloring indicate features associated respectively with sensitivity or resistance.
Extended Data Figure 8. Agreement in genomic predictors of drug response identified by elastic net regression in the GDSC and CCLE studies.
EN selection of genomic features was performed on the indicated dataset and their effects were computed using a non-selective regression (ridge). Total number of features selected by EN is reported above the bars. Number of cell lines used in the regression is in parentheses on the x axis. Consistency is reported as the proportion of features with the overall same direction of effect (association with sensitivity or resistance): proportion of features with same sign, using either the cosine correlation that takes into account the sign associated with the features or the Pearson’s correlation that does not.
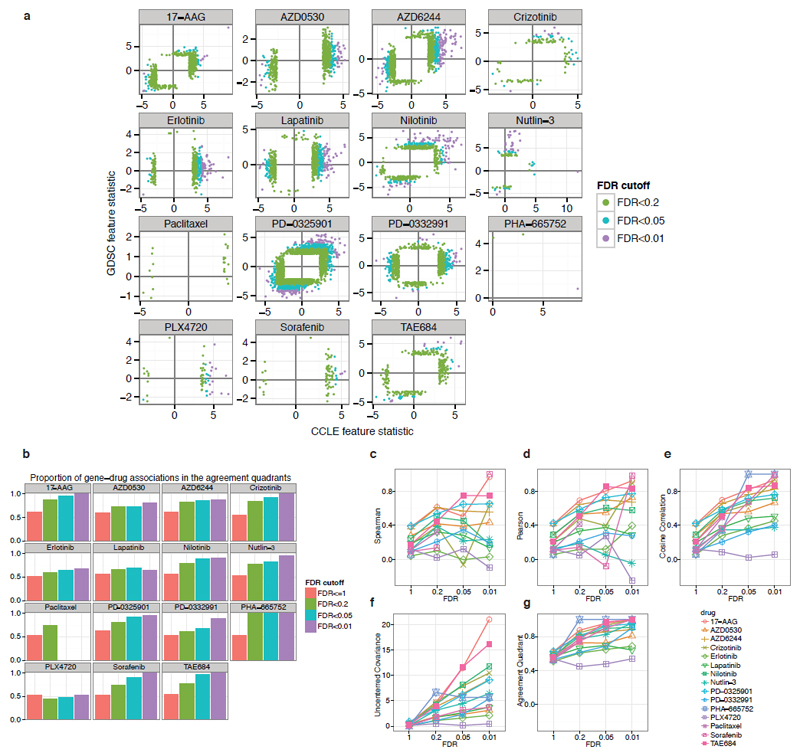
Extended Data Figure 9. Gene expression correlates of drug response identified in Haibe-Kains et al.7 have better agreement when using more stringent FDR Cutoffs.
a, Scatter plots of the IC50 based gene-drug association statistic (column “stat” in Haibe-Kains et al.7 suppl. Data sets 2 and 3 and Figure S6) with FDR between 0 and 0.01 (purple), 0.01 and 0.05 (cyan), 0.05 and 0.2 (green). In each panel the two black lines intersect at the origin and define the agreement quadrants (top right and bottom left quadrants). b, Proportion of genes in the agreement quadrants (same sign between the two studies). c, Additional measures of agreement between the two studies: Agreement measures increase with more stringent FDR cutoff, suggesting that false discovery drives agreement down. Uncentered measures (cosine correlation, uncentered covariance, agreement quadrant proportion) yield better agreement between the studies (see Supplementary Text for details).
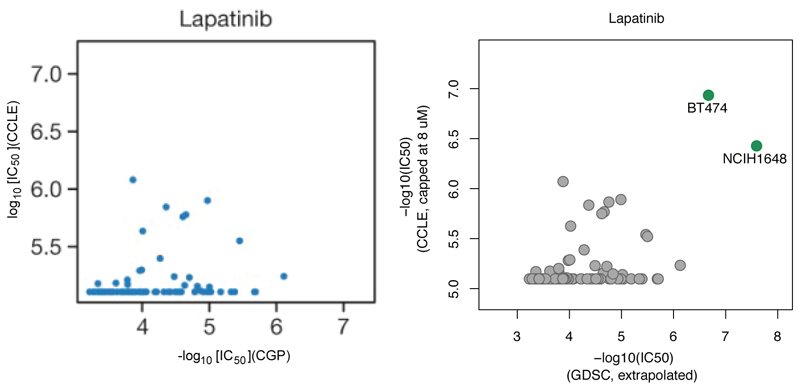
Extended Data Figure 10. Example of significant change in observed correlation by addition of few sensitive cell lines:
For Lapatinib sensitivity data, there are 86 overlapping cell lines between CCLE and GDSC datasets. Left panel is an excerpt from Haibe-Kains et al.7 Figure 2 comparing the sensitivity data to Lapatinib for the two datasets. Right panel shows the two sensitive cell lines (BT-474 and NCI-H1648) that were missed in Haibe-Kains et al.7 analysis. The inclusion of these two cell lines drastically changes the observed Pearson correlation (from 0.25 to 0.53). This is consistent with the simulation results (Extended Data Figure 4B) that show high variability in the observed Pearson correlation for low sample numbers.
Supplementary Material
Acknowledgements
We thank Todd Golub, Eric Lander, Stuart Schreiber, Paul Clemons and Jeff Engelman for helpful discussions. This work was supported by research grants from the Novartis Institutes for BioMedical Research (CCLE) and by grants from the Wellcome Trust (086357) and the National Institutes of Health (1U54HG006097-01) (GDSC).
Footnotes
Author Contributions NS, LAG, AA, DAH, CHB, SR, JL, JB, GC, RS, WRS, FS, MPM, FI, MM, JS, MRS, UM and MJG conceived the studies, NS, MG, GVK, AA, IP, JL, ML, DS, AK, KV, EJE, MPM, FI, and MM performed analyses, NS, MG, AA, ML, MR, FI, and MM wrote/tested the R code, and NS, MG, AA, LAG, CHB, JL, MPM, and JS wrote the paper.
References
- 1.Sharma SV, Haber DA, Settleman J. Cell line-based platforms to evaluate the therapeutic efficacy of candidate anticancer agents. Nat Rev Cancer. 2010;10:241–253. doi: 10.1038/nrc2820. nrc2820 [pii] [DOI] [PubMed] [Google Scholar]
- 2.Neve RM, et al. A collection of breast cancer cell lines for the study of functionally distinct cancer subtypes. Cancer Cell. 2006;10:515–527. doi: 10.1016/j.ccr.2006.10.008. S1535-6108(06)00314-X [pii] [DOI] [PMC free article] [PubMed] [Google Scholar]
- 3.Caponigro G, Sellers WR. Advances in the preclinical testing of cancer therapeutic hypotheses. Nat Rev Drug Discov. 2011;10:179–187. doi: 10.1038/nrd3385. nrd3385 [pii] [DOI] [PubMed] [Google Scholar]
- 4.Garraway LA, et al. Integrative genomic analyses identify MITF as a lineage survival oncogene amplified in malignant melanoma. Nature. 2005;436:117–122. doi: 10.1038/nature03664. [DOI] [PubMed] [Google Scholar]
- 5.Solit DB, et al. BRAF mutation predicts sensitivity to MEK inhibition. Nature. 2006;439:358–362. doi: 10.1038/nature04304. [DOI] [PMC free article] [PubMed] [Google Scholar]
- 6.Sos ML, et al. Predicting drug susceptibility of non-small cell lung cancers based on genetic lesions. J Clin Invest. 2009;119:1727–1740. doi: 10.1172/JCI37127. 37127 [pii] [DOI] [PMC free article] [PubMed] [Google Scholar]
- 7.Haibe-Kains B, et al. Inconsistency in large pharmacogenomic studies. Nature. 2013;504:389–393. doi: 10.1038/nature12831. [DOI] [PMC free article] [PubMed] [Google Scholar]
- 8.Barretina J, et al. The Cancer Cell Line Encyclopedia enables predictive modelling of anticancer drug sensitivity. Nature. 2012;483:603–607. doi: 10.1038/nature11003. [DOI] [PMC free article] [PubMed] [Google Scholar]
- 9.Garnett MJ, et al. Systematic identification of genomic markers of drug sensitivity in cancer cells. Nature. 2012;483:570–575. doi: 10.1038/nature11005. [DOI] [PMC free article] [PubMed] [Google Scholar]
- 10.Papillon-Cavanagh S, et al. Comparison and validation of genomic predictors for anticancer drug sensitivity. Journal of the American Medical Informatics Association : JAMIA. 2013;20:597–602. doi: 10.1136/amiajnl-2012-001442. [DOI] [PMC free article] [PubMed] [Google Scholar]
Associated Data
This section collects any data citations, data availability statements, or supplementary materials included in this article.


