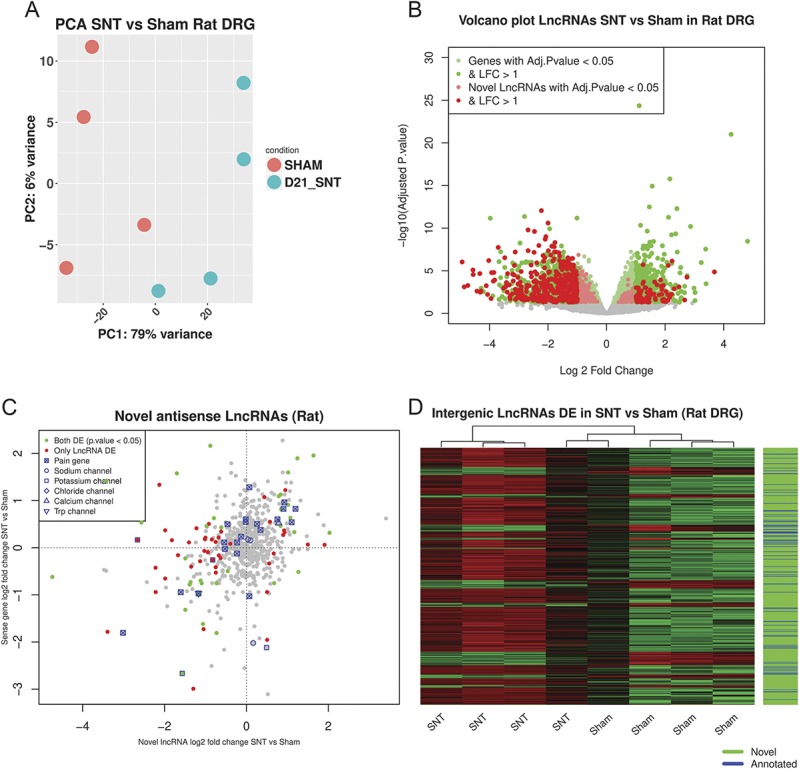
Figure 6.

Dorsal root ganglion transcriptional response in rats after peripheral neuropathy. (A) Principal component analysis plot of samples based on the regularised log2-transformed counts of novel LncRNAs and ENSEMBL genes (first 5000 genes ranked by their SD) in the rat DRG. Axis represents PCs and shows percentage of original data's variance explained by the respective PC. (B) Volcano plot of the whole gene set (ENSEMBL annotated genes and novel LncRNAs). X-axis Log2(Fold Change), y-axis −log10(FDR adjusted P value). Significantly DE ENSEMBL annotated genes and novel LncRNAs are highlighted. (C) Expression plot of novel antisense LncRNAs vs the sense protein-coding gene. (D) Heatmap of novel and annotated intergenic LncRNAs DE between SNT and Sham-operated animals. DE, differentially expressed; DRG, dorsal root ganglion; FDR, false discovery rate; LncRNAs, long noncoding RNAs; PCA, principal component analysis; SNT, spinal nerve transection.
