Abstract
Multi-element focused ultrasound phased arrays have been used in therapeutic applications to treat large tissue volumes by electronic steering of the focus, to target multiple simultaneous foci, and to correct aberration caused by inhomogeneous tissue pathways. There is an increasing interest in using arrays to generate more complex beam shapes and corresponding acoustic radiation force patterns for manipulation of particles such as kidney stones. Toward this end, experimental and computational tools are needed to enable accurate delivery of desired transducer vibrations and corresponding ultrasound fields. The purpose of this study was to characterize the vibrations of a 256-element array at 1.5 MHz, implement strategies to compensate for variability, and test the ability to generate specified vortex beams that are relevant to particle manipulation. Characterization of the array output was performed in water using both element-by-element measurements at the focus of the array and holography measurements for which all elements were excited simultaneously. Both methods were used to quantify each element’s output so that the power of each element could be equalized. Vortex beams generated using both compensation strategies were measured and compared to Rayleigh integral simulations of fields generated by an idealized array based on the manufacturer’s specifications. Although both approaches improved beam axisymmetry, compensation based on holography measurements had half the error relative to the simulation results in comparison to the element-by-element method.
Keywords: Acoustic Beam Shaping, Apodization, Element- by-element (far-field) measurements, Holography, Hydrophone angular response, Radiation force balance
I. Introduction
Multi-element focused ultrasound phased arrays have been used in therapeutic applications to treat large volumes by electronic steering of the focus, to target multiple simultaneous foci, and to correct aberration caused by inhomogeneous tissue pathways. There is an increasing interest in using arrays to generate more complex beam shapes and corresponding acoustic radiation force patterns for noncontact manipulation of particles [1]–[3]. One emerging application for this effect is noninvasive repositioning of urinary stones to facilitate stone clearance [4]–[6]. Vortex beams are characterized by null pressure in the center and a toroidal-like acoustic beam shape [7]–[9]. Such beams offer the possibility of pulling [10]–[12] pushing [10], [13], or trapping an object [3], [14]. In the idealized case, a continuous axisymmetric transducer can generate a vortex beam if the phase varies linearly with the polar angle around the transducer’s acoustic axis with a maximum phase delay of 2π M radians. Here M is an integer number known as the topological charge, which controls the wavefront helicity and the overall toroidal width.
In this effort, we seek to reproduce such beams using a phased array transducer. Although such an implementation involves inherent challenges related to finite element sizes, phased arrays do provide the appealing potential to electronically steer beams and any trapped objects in 3D space. To realize the generation of vortex beams with a phased array transducer, the first step is to characterize its output in order to account for non-uniform behavior of each element. Successful characterization and compensation of non-uniformity will provide a basis for future efforts to synthesize specific beam shapes to trap and manipulate objects such as urinary stones by means of acoustic radiation force.
The simplest method to characterize a focused array involves element-by-element measurements for which the hydrophone is placed in the geometric focus of the array and each element is excited individually to measure amplitude and phase differences among the elements [15], [16]. Several studies have utilized this method to apply phase corrections to yield a high focal intensity in the presence of a scatterer [17]–[19] and to test focal steering capabilities [16], [20], [21]. Time reversal [22]–[24] is another method which uses the reflection of acoustic signals generated, and often received, by each element from a focal target. It has been used to correct for phase aberration as well as non-uniform attenuation introduced by propagation through heterogeneous media [25], [26]. In a third method, element-by-element measurements were taken at multiple locations in the field. This has been used to determine array excitation vectors using a pseudo-inverse method [17], to maximize focal intensity and to produce multiple foci [27]–[29]. In the current paper, a method is developed to determine the required individual adjustments to the vibratory amplitude and phase of each element of the array as needed to generate accurate and uniform complex 2-dimensional beam shapes.
Acoustic holography and element-by-element method are used here to quantify the complex output of every element. In acoustic holography, a 2D scan of the field produced by excitation of the entire array is measured and used as a boundary condition to reconstruct the field at the transducer surface or anywhere in 3D space [30], [31]. Holographic backpropagation of vortex beams was introduced in Ref [7]. The evolution of an unfocused vortex beam along the propagation axis was examined. Holography captures effects caused by cross-talk and eliminates the variability between elements when driven sequentially due to the transient response of the power supply. It has been shown that power sources alone can introduce phase differences between elements that reduce focal intensities by 20–30% [18], and such effects are missed with an element-by-element approach. Compared to holography, element-by-element methods have a limited ability to quantify the vibrations of each element. In particular, such approaches typically require an assumption that each element vibrates uniformly over some prescribed aperture. With this assumption, a pressure measurement at a single point in the far-field can be readily related to the element’s vibration magnitude. However, this approach cannot account for non-uniform vibrations within each element or effective element sizes that differ from assumed values. Because each element’s effective aperture influences its directivity, the synthesis of complex 2D fields will be hindered by such assumptions. Moreover, element-by-element approaches are inherently incapable of capturing the effects of crosstalk among elements and amplifier channels.
The purpose of this study was to characterize a 1.5 MHz 256-element transducer array, compensate for differences in phase and amplitude between the array elements, and demonstrate an improvement in the array performance in the generation of uniform vortex beams. First, the transducer was matched electrically to a Verasonics Data Acquisition system (VDAS) for efficient power transfer. Then element-by-element and holography measurements were acquired to quantify each element’s output. As a part of the holography approach, a method was developed to identify the performance characteristics of each element. Compensation strategies based on both measurement approaches were implemented to equalize the phase and amplitude across all elements. The performance of these compensation strategies was tested by evaluating the uniformity of vortex beams.
II. Methods
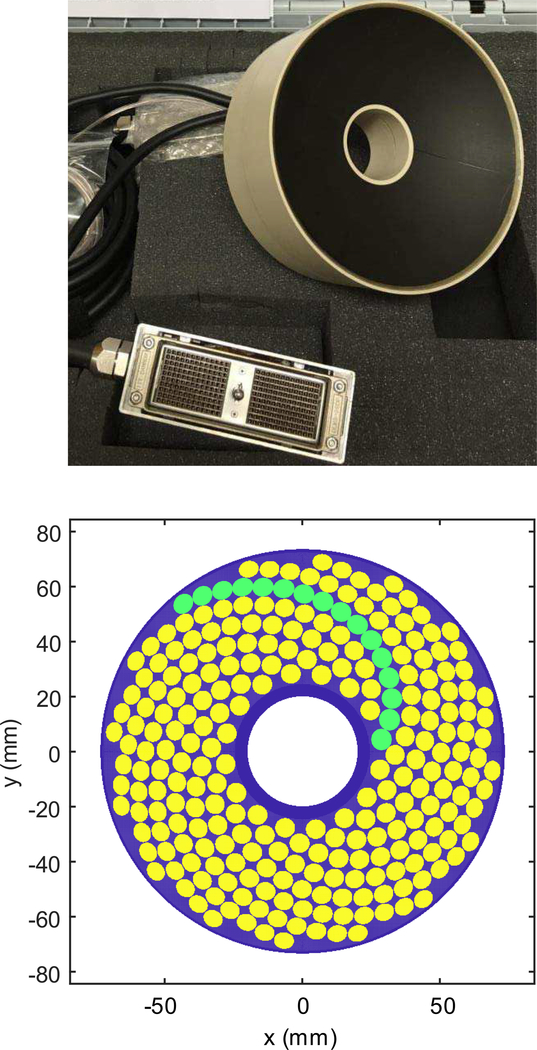
The transducer characterized in this study is a piezocomposite array manufactured by Imasonic, SAS (Voray sur l’Ognon, France) [32]. The array is geometrically focused with a spherical radius of curvature of 120 mm. The mechanical aperture is 160 mm; the active acoustic aperture is 147 mm, including a central opening of 40 mm in diameter (Fig. 1). The 256 piezocomposite elements are arranged in 16 spirals with each spiral having 16 elements. The diameter of each element is 7 mm with inter-element gaps of 0.5 mm. The face of the transducer is acoustically matched to water at a nominal frequency of 1.5 MHz to yield a 1.2—1.8 MHz working frequency range and a manufacturer-reported efficiency in excess of 63%.
Fig. 1.
Top) a photograph of the array. Bottom) 2D layout of the array. The array has 16 spirals with 16 elements in each spiral for a total of 256 elements. Each element has a nominal diameter of 7 mm with inter-element gaps of 0.5 mm. Central opening is 40 mm and active acoustic aperture is 147 mm.
A. Electrical Measurements
The transducer was driven electrically using a Verasonics Data Acquisition System (V-1, Verasonics, LTD., Kirkland, WA), a research ultrasound engine with a 1200-W external power source (QPX600DP, Aim-TTI, Cambridgeshire, UK). The array was electrically tuned using a series inductor for each element to eliminate the imaginary component of the impedance and thus to optimize the driving efficiency at 1.5 MHz. The inductors were mounted on two printed circuit boards. Ferrite-core shielded inductors were used to reduce the electrical crosstalk between the channels. Crosstalk was measured by triggering a single element and monitoring the voltage output of an adjacent element on the circuit board. The maximum voltage on all the monitored adjacent elements was measured to be 0.08% of the voltage signal on the excited element on each circuit board, which was insignificant.
All elements were tuned with the same inductance. The impedance after matching was measured using an impedance analyzer (Antenna Analyzer AIM-4170D, Array solutions Sunnyvale, TX) and compared with values before matching (Table I). Ideally, the inductors network should be lossless; however, an increase in the average real impedance of 22% was measured, which translated to 18% power losses in the inductors. However, a comparison before and after tuning shows that the electrical power delivered is 7 times the power delivered without the electrical tuning. A small nonzero imaginary component remained on most elements (Table I) as the inductors were chosen in discrete values only, and the inductances were measured to be slightly smaller than their nominal value at high frequencies. The total electrical power delivered to the transducer (Wtot) was calculated using the following equation:
| (1) |
where Zj is the complex electrical impedance measured in Ohms and Vj is the voltage on element j measured after matching. In Table I, the negative imaginary impedance indicates that the reactive component is capacitive.
Table I.
Average impedance (Ohms) of array elements before and after tuning with inductors
| Impedance | Re(Z) (Ohms) | Im(Z) (Ohms) |
|---|---|---|
| Untuned | 59.1±3.8 | −207.9±3.2 |
| Tuned | 72.2±4.9 | −13±6.6 |
B. Acoustical Measurements
A total of four experiments were performed in the study at the transducer operating frequency of 1.5 MHz: 1) element-by-element measurements for acoustic characterization of the array and equalization of the element outputs and 2) holography measurements for a comparable acoustic characterization; 3) radiation force balance (RFB) measurements [33] to independently quantify the power output of the array; and 4) two-dimensional hydrophone scans to measure the uniformity of the vortex beam shapes before and after compensation. All experiments were performed in a tank of degassed and deionized water. Except for RFB experiments, all measurements utilized a capsule hydrophone (HGL-0200 with AH-2020 preamplifier, Onda Corporation, Sunnyvale, CA). Per the manufacturer’s calibration, the integrated hydrophone sensitivity at 1.5 MHz was 416 mV/MPa. Hydrophone directivity at 1.5 MHz was measured separately and used to provide corrections for improved accuracy. Hydrophone location was controlled using 3D positioner systems based on stepper motors and linear slides with resolutions less than 10 μm per step (Velmex Inc, Bloomfield, NY).
A function generator (Model 3500B, Keysight Technologies, Inc., Englewood, CO) was used to trigger the VDAS and synchronize data acquisition on an oscilloscope or digitizer. For the holography scan, hydrophone signals were recorded using a 14-bit digitizer board (Razor 14, Gage by DynamicSig- nals LLC, Lockport IL); for other experiments, hydrophone measurements were recorded using a digital oscilloscope (Model 3034A, Agilent Technologies Inc, Santa Clara, CA).
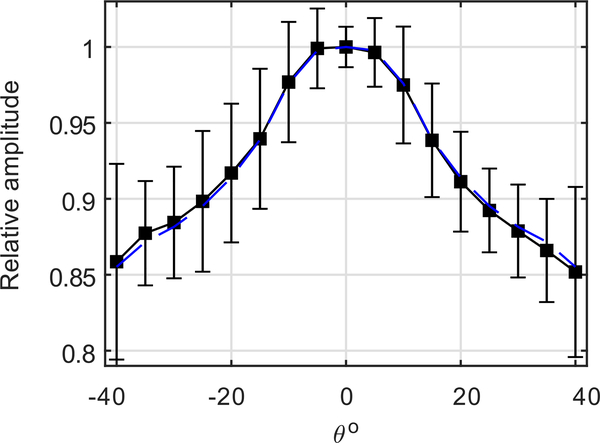
The angular sensitivity response of the hydrophone was measured up to an angle of 40° in an open water bath in the far field of a 1.5 MHz flat piezoelectric source with 1.6 cm diameter. The response was measured along four different azimuthal angles by rotating the hydrophone around its axis and repeating the measurements twice for each angle. The average of these measurements at each angle was then taken to produce the angular response curve shown in Fig. 2. Based on the small variation, the curve is assumed axisymmetric. The acoustic characterization section of this paper reports the various acoustic output and efficiency measurements after compensation for the hydrophone’s angular response while a comparison to the values before compensation are reported in discussion.
Fig. 2.
Angular response up to 40° of the HGL — 0200 Onda capsule hydrophone (sensing element diameter 200 μm). Solid black curve represents experimental data with error bars of 8 angular sweeps; each sweep is performed twice along a different azimuthal angle. Dashed blue line represents the average of the left and right halves of the experimental data, based on a symmetric response assumption.
Losses due to absorption of the fundamental frequency (1.5 MHz) were ignored in the analysis, since they were negligible (0.054 dB over the longest propagation distance to the acoustic focus of 120 mm). Nonlinear propagation effects were neglected in all acoustic measurements. Focal measurements were performed at low voltage levels while holography and radiation force balance measurements were performed prefocally. The level of the second harmonic pressure was less than 7% in all measurements, yielding an intensity level less than 0.5%, which is below the nonlinear intensity threshold criterion of 10% in standards [34].
1). Far-field element-by-element measurements:
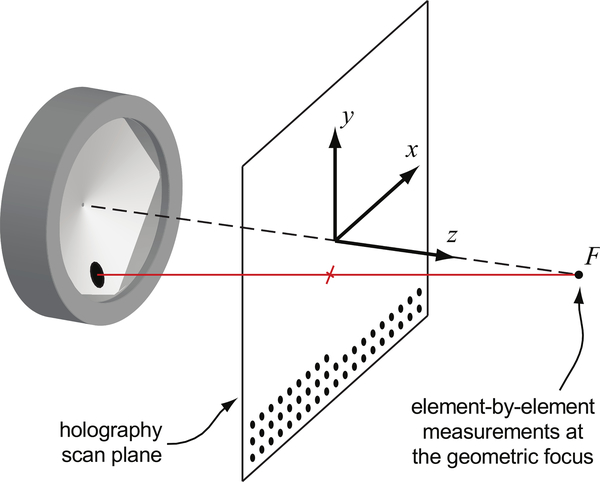
In the element-by-element measurements, the hydrophone was placed at the acoustic focus of the phased array, which is in the far-field of all elements (Fig. 3). The focus of the array was determined as the location where the hydrophone recorded the maximum pressure amplitude while all elements were driven at the same voltage level and without applying any phase delays. Each element was then driven independently at 1.5 MHz with a 128-cycle burst. The waveform was recorded, and the amplitude and phase were calculated using a discrete Fourier transform (DFT) over the steady state portion of the waveform. The CW boundary condition (pressure) at each element surface was then estimated by assuming each element can be modeled as a flat, circular piston source with uniform normal velocity, v0 = P0/ρc. In the far-field approximation,
| (2) |
| (3) |
where P0 is the effective surface pressure amplitude, PR is the pressure amplitude measured at the focus after applying relevant correction for directivity. Considering that the hydrophone was aligned with the array axis, the angle of incidence was determined as the angle between the array axis and the vector defined by the location of an element of interest relative to the hydrophone. Then, the corresponding relative amplitude of the directional response was used to apply a correction. R is the focal distance, a is the nominal radius of each element, W is the acoustic power of the (piston) array element, c is the speed of sound in water, ρ is the density, and λ is the ultrasound wavelength. Based on the measurements for each element, the total acoustic power output and the overall transducer efficiency were calculated.
Fig. 3.
Diagram of the experimental setup. The acoustic focus (F) at which element-by-element hydrophone measurements were taken was determined as a maximum of pressure amplitude when all elements were triggered simultaneously. The holography scan plane with an area of 88 × 88 mm was 40 mm prefocally. The hydrophone recorded the waveform at 0.5 mm increments for a total of 31,329 points. Sample points shown as dots are at larger increments for illustration.
2). Acoustic holography:
In the holography scan, all elements were driven simultaneously with a 128-cycle burst. Hydrophone signals were acquired at each location over a 2D plane oriented approximately perpendicular to the acoustic axis. The scan was performed with the center of the scan region located 40 mm proximal to the transducer relative to the acoustic focus (Fig. 3). The scan comprised an 88 X 88 mm grid with a step size of 0.5 mm. From the recorded hydrophone signals, the CW hologram was defined by analyzing a time window lasting for 15 acoustic cycles with a delay time of 111.17 μs after triggering, and calculating pressure amplitude and phase of the windowed signal using DFT. The time window was chosen based on a VDAS delay of 2.17 μs before actual waveform generation, a delay for acoustic propagation from each element to each point within the scan plane, and a transient ring-up time for the array to reach a steady state. Using the angular spectrum calculated from the raw holography measurements, we compensated for the hydrophone directivity and then calculated the power traversing the scan plane [35] using the following relations:
| (4) |
| (5) |
| (6) |
where S(kx, ky) is the measured angular spectrum of the beam, kx and ky are the wave vector components in x and y, P (x, y) is measured complex amplitude of the pressure field, D(θ) is the directivity, and θ is related to kx and ky by .
After compensation for the angular response of the hydrophone, the inverse Fourier transform was used to recover the true complex pressure amplitude distribution from the recovered angular spectrum using the following expression:
| (7) |
When considering holography measurements and the physical transducer, there are two relevant coordinate systems: one aligned with the transducer and the corresponding beam’s z- axis, and another aligned with the axes of the hydrophone positioner (x, y, z). The acoustic beam z-axis is not generally coincident with the hydrophone z-axis [31], but the misalignment can be corrected by projecting the field to different transverse planes in the positioner coordinates and identifying movement of the beam axis relative to these coordinates. After quantifying the misalignment in this way, a transformation basis between the positioner and transducer coordinates was defined, and the measured hologram was interpreted accordingly. For simplicity, in all subsequent figures presented in the manuscript, all coordinates (x, y) shown are either describing hydrophone axes if shown in a focal plane, or array axes if shown on the array surface.
After the alignment of coordinates, the pressure field recovered from the inverse transform (Eq. 7) was used to back- project the field to a spherical surface that corresponded to the physical surface of the transducer using the Rayleigh integral [31]. From reconstructed normal velocities of the transducer surface, the preliminary boundaries of individual elements were identified based on the maximum of the gradient of velocity amplitude along the transducer surface. Afterwards, the surface normal velocity profile was manually inspected to remove spurious pixels connecting adjacent elements. The pixels inside each boundary were then used to define the corresponding element’s center location as the centroid of these pixels. Final element boundaries were drawn around each of these calculated locations as 7 mm diameter circles to agree with reported manufacturer specifications. The information inside each element’s boundary was collected to calculate its acoustic output as follows:
| (8) |
where Aj is the complex amplitude either of normal velocity or pressure per element j, and N is the number of pixels with their centroid inside an element. The power emitted by the element j is , where, dai is the projection of the square surface area of pixel i on to the spherical array surface, and Pij and Uij are the complex amplitudes of pressure and normal velocity, respectively.
3). Radiation force balance measurements:
Radiation force balance measurements were carried out using a flat 10-cm- diameter absorber brush [36] suspended from a precision scale (Entris623i-1S, Sartorius, Göttingen Germany) and placed 1 cm proximal to the acoustic focus. A 50-μm thick Mylar membrane was placed between the transducer and the absorber to minimize acoustic streaming [37], and the transducer was operated at a 1% duty cycle to minimize heating of the absorber [38]. Based on ray acoustics theory [39], the following correction factor was multiplied by the acoustic power to correct for the geometry of a focused source with a central hole:
| (9) |
where α1 and α2 are the angles which correspond to half apertures of the central opening and the outer edge of the array.
4). Equalization of the output of the array elements (uniformity):
Equalizing the element outputs includes phase corrections to have all elements firing in phase and amplitude equalization. In order to find the phase delays among the elements for the element-by-element measurements, the recorded signal of each element was used to calculate the relative phase delay between the elements. For the holography scan, the phase delays among elements were found using the phase values from the complex normal velocity of each element given by Eq. 8. Phase delay corrections were then applied to the VDAS for both measurements.
Then a VDAS apodization scheme was used to equalize the element amplitude outputs by controlling the voltage delivered to each element. The VDAS takes an apodization factor as input and uses pulse-width modulation to control the number of ‘on’ and ‘off’ clock cycles in a transmit event to set the voltage amplitude on a specific channel. In order to measure the relative electrical output vs the apodization factor applied in the VDAS script, the voltage was measured on a single element for apodization factors ranging from 0 to 1 in increments of 0.1, where 0 denotes being fully off and 1 denotes being fully on. To obtain the required driving voltage for each element from both characterization methods, the reciprocals of effective normal velocity amplitudes from element-by-element measurements and the reciprocals of surface normal velocity amplitudes from holography were found and normalized relative to the largest value of each method separately. The normalized reciprocals were used as scaling factors to control the voltage output delivered to each element, such that the lowest element was scaled by unity and the rest by a factor less than 1. Then the scaling factors were used to back solve and determine the required apodization factors applied in the VDAS script to control the voltage delivered to the elements and ultimately equalizing the amplitude outputs.
5). Generation of vortex beams:
Vortex beams with topological charges, M = 0 (focused), 1, and 4, were generated after applying amplitude and phase corrections, in order to test the effectiveness of the characterization methods for achieving uniformity of the beams. We ran the VDAS script with the relevant apodization factor for each element to equalize amplitudes. In addition to equalizing phase delays, further phase delays were imposed to synthesize different vortex beams. The phase delay imposed on each element was calculated based on its nominal location (xi, yi). For a given M, the total phase delay around the array aperture increases from 0 to 2πM, and the phase on element i is given by:
| (10) |
Two-dimensional hydrophone scans of multiple vortex beam shapes in the focal plane were measured before and after the application of equalization corrections. Pressure amplitude and phase were calculated from waveforms recorded at each spatial location in the scan, as described for the holography scan.
The intensity calculated from measurements were then compared to simulated intensity to evaluate the performance of the characterization methods. Simulations used the Rayleigh integral to calculate pressure fields that would be generated by an idealized representation of the array - uniformly vibrating elements were assumed, with element locations and sizes matching manufacturer specifications.
III. Results
A. Element-by-element in the far-field measurements
Using the recorded pressure waveform for each element, the effective pressure amplitude and phase at the element’s surface were found and then used to calculate the radiated acoustic power from Eqs. 2 and 3. For all elements, the total acoustic power was calculated to be 91.4 W. The applied electrical power was 136.4 W yielding an efficiency of 65.5%, which falls within the specifications provided by the manufacturer.
B. Holography
The holography results are presented to show the alignment of the axes, the element locations and borders, the effect of the directivity on the surface normal velocity vibration profile, and finally the acoustic power output and efficiency calculations.
1). Holography axes alignment:
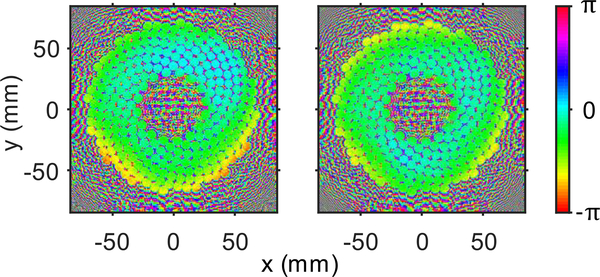
Before using the measured hologram to reconstruct vibrations on the transducer’s surface, corrections were performed for misalignment between the hydrophone and transducer coordinates. The uncertainty in the alignment of the acoustic beam axis with the z-axis of the 3D positioner was found by forward projecting to the focal plane away from the array. The focus appeared to be located at (0.15, −0.25) mm rather than at (0, 0). Using this offset from the origin over the propagating distance (δz = 40.0 mm), the misalignment angle between the axes was found to be 0.42°. After correcting for the angular misalignment and back-projecting to the array surface, a more uniform phase distribution was obtained (Fig. 4). This misalignment only affects the surface phase distribution and has no visible effect on the amplitude.
Fig. 4.
Phase distribution (radians) back-projected onto the transducer surface before (left) and after (right) correcting for the misalignment of the array and holography coordinates. Before correction, the slight misalignment is observed as a non-uniform phase distribution varying from top to bottom on the array surface.
2). Element locations and sphericity:
Element locations identified from reconstructed vibrations at the transducer surface were compared to the nominal locations provided by the manufacturer. To perform this comparison, we note that the orientation of array elements around the beam axis was not controlled relative to any absolute coordinate system. Accordingly, the holographically reconstructed element positions were rotated around the beam axis for initial alignment relative to the manufacturer-specified coordinates. Then an iterative algorithm was executed to optimize alignment by minimizing the sum of the absolute differences between nominal and reconstructed element locations. The minimization search was carried out by first rotating the holographically reconstructed array pattern in the xy-plane about the z-axis. Second, this pattern was shifted in the xy-plane while conserving the radius of curvature of the surface where the vibration velocity pattern was reconstructed. These two steps were repeated iteratively using an angular search with a step size of 0.001° mm from −5° to 5° and a translational search with a step size of 0.001 mm from —2 mm to 2 mm. The optimal alignment found in this way yielded an average distance between nominal and reconstructed locations of 0.107 mm with a standard deviation of 0.055 mm. Additionally, the diameter of each reconstructed element was found to be 6.99 mm with a standard deviation of 0.2 mm, which agrees with the nominal elements ‘diameter of 7 mm.
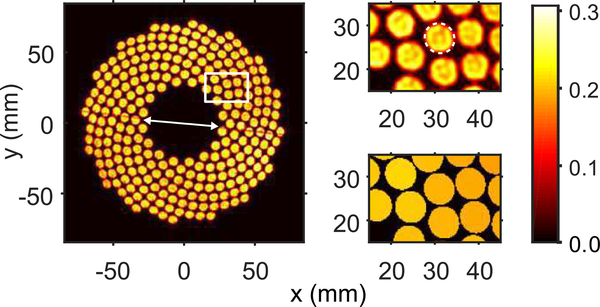
From this alignment comparison, an interesting characteristic of the transducer’s acoustic surface was identified. In particular, it appears that the transducer was made from two physically separate halves that were joined together in the manufacturing process. The line representing that split in the transducer surface was captured by the holography results illustrated in Fig. 5, which shows the surface normal velocity profile after directivity compensation along with the identified element boundaries shown in white.
Fig. 5.
Left) Transducer’s surface normal velocity amplitude profile, |U| (m/s), obtained with compensation for the hydrophone directivity. The arrow marks the line along the hemispherical surface splitting the transducer surface in two halves due to the manufacturing process. Right) Close-up of the elements in the upper right corner of the array; top) showing the surface normal velocity amplitude profile, |U| (m/s), with an example of the calculated boundaries of the elements shown as a dashed contour on a single element, and bottom) showing the averaged and localized surface normal velocity amplitude, |U| (m/s), per element after post-processing of the holography results. Note that the reconstructed surface normal velocity (top) is not uniform within each element which may be explained not only by some true heterogeneity of the source vibration, but by the omission of evanescent wave components in the far-field holography reconstruction used.
3). Acoustic output and efficiency calculations:
The normal velocity output and acoustic power per element were calculated from Eq. 8. The acoustic power from the measured hologram in the scan plane was 308.9 W. After performing back projection to the transducer surface and localizing the output per each element, the sum of the acoustic power from all elements was 301.0 W. Although no absorption losses were included in backpropagation, the difference of 2.53% of the total power was from including only radiation from inside the 7 mm element boundaries.
In Fig. 2, it is shown that the angular response was measured up to 40°; however, the maximum angle the hydrophone reached with the transducer in the holographic scan was 50°. The sensitivity past 40° was assumed to be linearly decreasing down to a value at 90°equal to 8% of the value at 40° The linear curve is defined to be a lower bound to the theoretical sensitivity value specified by the manufacturer and given by the expression for a radiating source in free space in Ref [40]. For verification purposes, we compared the power values gained from using the linear curve - a lower bound - against an assumed constant sensitivity curve beyond 40°- an upper bound - as the most conservative limit. The acoustic power was measured to be 306.3W and 308.9W for constant and linear directivity curves, respectively, which is an increase of less than 1%. The electrical power was calculated to be 463.2W, which resulted in efficiency values between 66.1% and 66.7%, depending on which directivity curve was used. This estimation beyond 40° was not required for the element-by-element, since the hydrophone was placed in the focus, making a maximum angle with the outermost transducer elements less than half the focal angle of 37°.
Element-by-element measurements were performed at 55% of the driving voltage of holography, yielding an electrical power of 136.4W. Holography required higher voltage levels to obtain a good signal-to-noise ratio, since the hydrophone was placed 40 mm prefocally (averaging would have prolonged the scan time considerably). Moreover, making element-by-element measurements at the drive level used for holography was not performed in order to avoid exposing the hydrophone to high pressures at the focus.
C. Radiation Force Balance Measurements
A radiation force balance was employed to provide an independent measure of acoustic power. To eliminate potential inconsistencies introduced by the driving electronics, the input electrical power was measured and used to normalize these acoustic power measurements in terms of overall transducer efficiency. The acoustic power measured at the voltage level of the holography scan was 315.8W. The average efficiency calculated from radiation force balance measurements at different voltage input levels was 68.3%, while the efficiency calculated from the holography scan (66%), element-by-element measurements (65.5%) and manufacturer’s reported efficiency (>63%). The reported efficiency by the manufacturer was calculated using 32 central elements only rather than the whole array. However, our measurements indicate that the outer elements have efficiencies similar to the inner 32 elements.
D. Equalizing the Output of the Array Elements
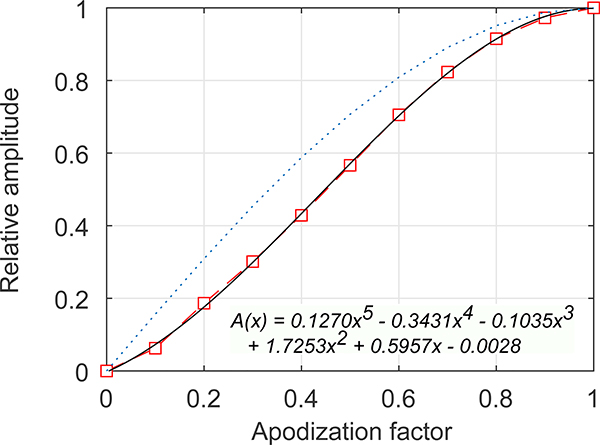
The VDAS apodization factor vs the voltage output amplitude was measured (Fig. 6). Since the VDAS apodization factor (Ap) indicates full power when equal to unity and off when zero, it would be theoretically expected for the resulting amplitude of the output to follow a sinusoidal curve, , where Ap is the apodization factor varying from zero to unity. However, measurement of the voltage amplitude output vs the various apodization factors showed deviation from this curve that could be a result of multiple sinusoidal summation, and thus the curve was approximated by a 5th degree polynomial using a least-squares fit. The polynomial curve was used to calculate the desired apodization factor to equalize all elements’ amplitude outputs based on the element- by-element and holography results (Fig. 5). Phase corrections based on both methods were applied to have zero relative phase delay between all elements.
Fig. 6.
Apodization factor vs relative amplitude output of the VDAS for an extended burst for all elements firing simultaneously. The dashed red curve represents the measurement results and their 5th degree polynomial fit (solid black line); both compared with the pulse width modulation scheme assuming a sinusoidal curve (dotted blue line). The 5th degree polynomial fit is displayed with restriction of having a value of zero at zero and unity at one.
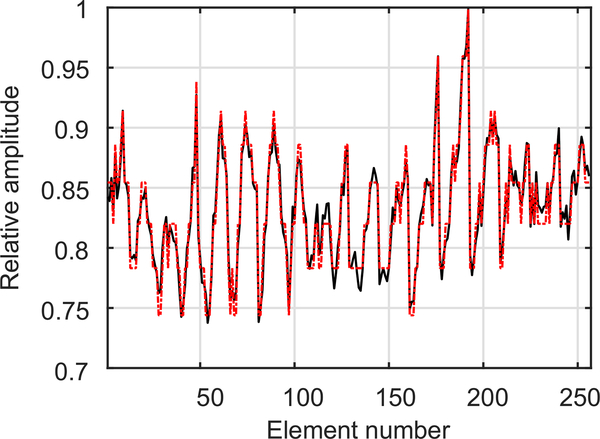
The pulse width modulation scheme in the VDAS is constrained since it is only possible to specify an integer number of ‘on’ cycles in a half transmit clock. This constraint on temporal resolution limits the resolution with which each element’s amplitude can be controlled. Figure 7 shows the desired relative amplitude value (solid black line) vs the VDAS output (dashed red line). As can be seen, the discretization of output levels for some elements causes a non-ideal equalization of the array.
Fig. 7.
Effect of VDAS rounding to whole integers in defining the number of “on-clock” cycles in the apodization scheme. VDAS rounds up or down to the nearest integer to define the number of “on-clock” cycles in the apodization scheme, which limits control of the resolution of the desired output as it underestimates or overestimates the needed amplitude. The VDAS output (solid black line) is shown to deviate from the desired output (dashed red line).
E. Generation of Vortex Beams
Two-dimensional scans were performed in the focal plane of beams with multiple topological charges (M = 0, 1, and 4) as generated with and without equalization of element outputs. From such measurements, the performance of equalization based on each characterization method was quantified by comparison with idealized simulations. A performance metric was calculated based on error in the intensity distribution relative to the corresponding simulation as follows:
| (11) |
where Is the 2D intensity distribution from simulation and I is the 2D intensity distribution - normalized with respect to the total power in Is - from before or after equalization as obtained by either element-by-element or holography.
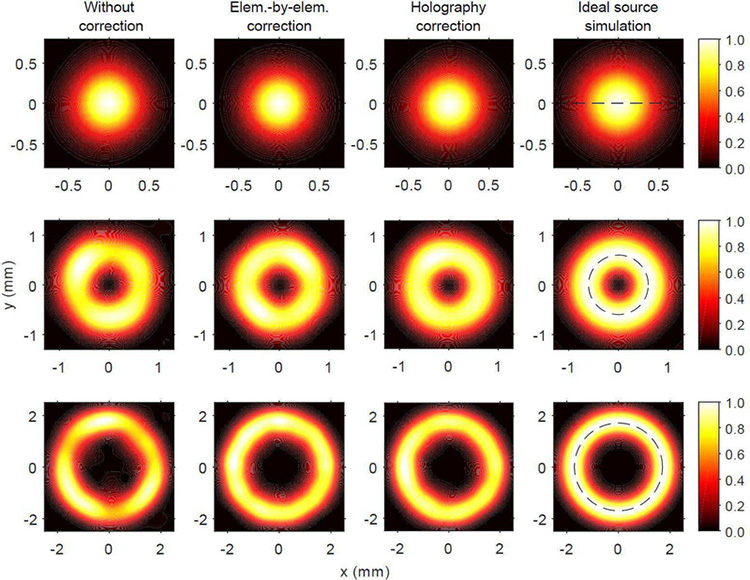
Figure 8 shows normalized intensity distributions corresponding to measurements in the scan plane and corresponding simulation results. All the vortex beam shapes scanned had the same input electrical power; however, the acoustic energy captured in the section of the scan plane shown in Fig. 8 varied slightly with the apodization factors from each method. Therefore, all intensity scans in Fig. 8 were normalized to the acoustic power in the scan plane of the simulation results to calculate the relative error.
Fig. 8.
Normalized 2D intensity distribution to its maximum value in the focal plane for different M values: top row) M = 0, middle) M = 1, and bottom) M = 4, for (from left to right) measurements before and after apodization using element-by-element measurements and holography results, and simulation. The corrections improve the uniformity of the focal rings and final experimental results look more like the simulation. The dashed line in the left column shows the line along which the sectional and circumferential cuts were taken for use in Fig. 9.
Table II presents errors associated with array non-uniformity as calculated from the intensity distributions in Fig. 8. Figure 8 and Table II show that both element-by-element measurements and holography attain improved uniformity for higher values of topological charge M. Values for M = 0 show that element-by-element equalization performs worse than no equalization- 15.3% vs 10.1%, while holography equalization provides minimal improvement. However, Fig. 8 illustrates that both equalization methods yield more circular intensity distributions with the element-by-element method providing the narrowest focal region. Overall, holography outperforms element-by-element measurements and reduces intensity non-uniformity by a factor of about 2 relative to the case with no equalization.
Table II.
Relative error norm of intensity of acoustic beam shapes before and after equalization
| Topological charge (M) | Before equalization | Element-by element equalization | Holography equalization |
|---|---|---|---|
| 0 | 10.1% | 15.3% | 9.0% |
| 1 | 10.8% | 9.1% | 5.3% |
| 4 | 13.3% | 7.8% | 7.4% |
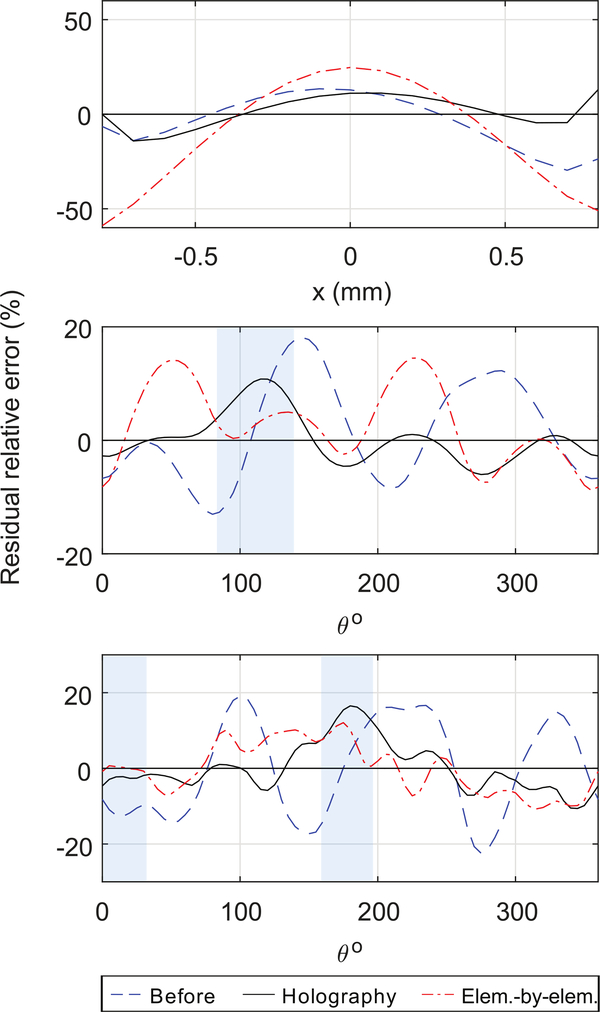
Sectional cuts along the x-axis for M = 0, and circumferential cuts at the radial distance with the maximum intensity values for M = 1 and 4 from the simulation were also examined for comparison of the performance of the different equalization methods (Fig. 9). In a fashion similar to Table II, the residual relative percent error is plotted in Fig. 9 along the dashed black lines shown in the right-hand column of Fig. 8.
Fig. 9.
Sectional and circumferential cuts of residual relative error (%) to the simulation of an ideal array output for M = 0 (top), M = 1 (middle), and M = 4 (bottom). Sectional cut is taken along the x-axis for M = 0 (top) and circumferential cuts are taken at the radius with the maximum intensity value for M = 1 and 4 (middle and bottom, respectively). shaded areas for M = 1 and 4 highlight the sections where holography under performs element-by-element measurements.
Both equalization schemes improved the intensity distribution for most cases (Fig. 8 and Fig. 9). For M = 0 in Fig. 9, the peak intensity obtained using both equalization methods (black and red dashed line) is higher relative to the simulated data (y = 0) because it has a wider distribution of intensity than the measured cases, while the power in all beams is the same. Circumferential cuts for M = 1 and 4 show the overall improvement in uniformity between the spatial distribution. For instance, at M = 1 from the holography method, the residual error is in general less than that from far-field measurements with the error oscillating between 0 and −5% except a large peak of 10% at θ = 125°. Similarly, for M = 4 holography exceeds element-by-element measurements, only under-performing on the interval from θ = 160° to 195° and 0°to 50°. Interestingly, a close inspection of Fig. 9 shows the effect of the equalization scheme on the extrema of the non-equalized case. It is noticeable that uniformity is improved as spatial extrema are flattened. However, there are areas where a maximum or a minimum was overcompensated for, such as at θ = 285° for M = 1, or θ = 150° for M = 4. Similar to the 2D intensity plots of Fig. 8 and the error percent calculated in Table II, the radial cuts of Fig. 9 display more regions of high non-uniformity distribution from simulation are present in the equalization results of the element-by-element than the holography method.
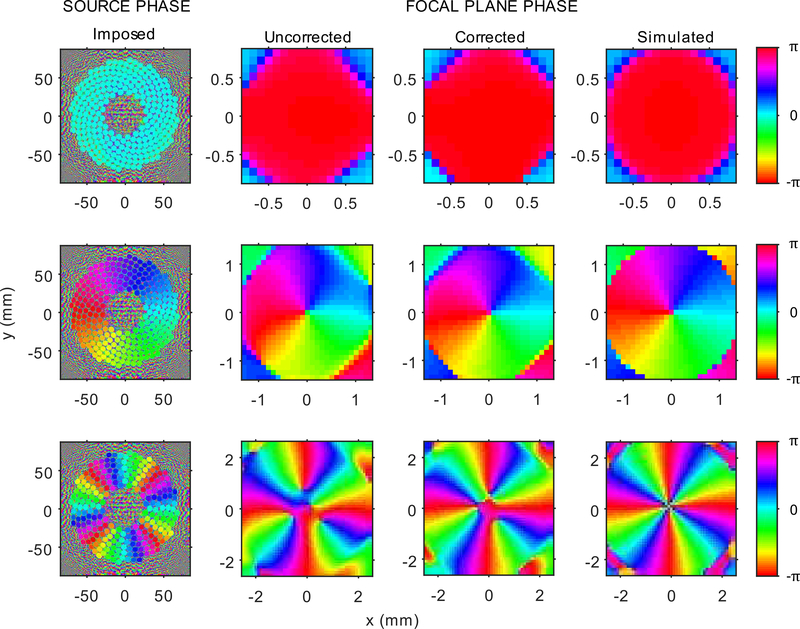
The phase distribution of the various vortex beam shapes was measured to quantify the uniformity of the source before corrections. The distribution was plotted before and after applying corrections. The phase distribution before corrections (second column of Fig. 10) shows slight variations along the radial direction inside the main circular boundary. Additionally, at M = 4, non-ideal phase distribution is observed. Such results are the consequence of small disturbances in the field introduced by the non-ideality of the source. For instance, due to manufacturing errors and tolerances, the array deviates from an ideal spherical surface. Such deviations introduce small perturbations in the acoustic field which lead to instabilities in the low amplitude regions of vortex beams with M > 1, as has been shown in optics [41]—[43]. Furthermore, for elements intended to have the same phase, a maximum time delay of 3 nanoseconds was measured before applying phase corrections. Such a small value indicates that the transducer’s elements are well within phase of each other and the jitter in phase between them is negligible.
Fig. 10.
Phase distribution of vortex beams (radians). Left to right) imposed phase distribution on the array’s discrete elements, measured phase distribution at the focal plane before and after applying phase corrections, and simulation for (top to bottom) M = 0, 1, and 4. Before applying phase corrections, there are slight variations in the phase distribution along the radial direction. The smooth phase transition indicates that the array behaves as a continuous acoustic source.
To find the contribution of the amplitude equalization and phase corrections to the uniformity, the results of elements’ output obtained from holography were used to simulate the beam shapes applying no corrections, amplitude equalization only, or phase corrections only. The three simulation cases were compared to simulation with ideal phase and amplitude, and the error in the intensity distribution was quantified, and the results are presented in Table III. First, the simulation results before equalization from Table III agree with the measurements of the fields before equalization in Table II. Also, Table III illustrates that the contribution of the non-equal element amplitude outputs has the largest error contribution of 6.3% at M = 0, then it steadies at larger M values to around 4%. Conversely, the phase error contribution increases with larger M, since at higher M the increment change in phase delay between elements to produce a specific vortex beam approaches the inherent phase errors of the array elements.
Table III.
Comparison of error norm of simulation of intensity of acoustic beam shapes from holography results with either amplitude equalization or phase corrections
| Topological charge (M) | Before equalization | Amplitude equalization only | Phase corrections only |
|---|---|---|---|
| 0 | 10.4% | 9.6% | 6.3% |
| 1 | 10.8% | 9.9% | 4.2% |
| 4 | 15.3% | 14.5% | 4.4% |
Fig. 10. Phase distribution of vortex beams (radians). Left to right) imposed phase distribution on the array’s discrete elements, measured phase distribution at the focal plane before and after applying phase corrections, and simulation for (top to bottom) M = 0, 1, and 4. Before applying phase corrections, there are slight variations in the phase distribution along the radial direction. The smooth phase transition indicates that the array behaves as a continuous acoustic source.
IV. Discussion
In this study, a HIFU transducer was characterized using two well-known methods, holography and element-by-element measurements. Both approaches were used to estimate the complex pressure and normal velocity of each element, including both amplitude and phase. These characterization measurements were then used to modify how each element was driven in order to equalize element outputs. The performance of equalization based on both holography and element-by-element measurements was evaluated by generating vortex beams and comparing the resulting intensity distributions with simulations representing an idealized array.
Measurements of vortex beams show that equalization of element outputs improved beam uniformity for all shapes, except for the focused case of element-by-element even though it produced more circular intensity distribution than before. While comparison of phase distributions suggests excellent uniformity across all array elements, some non-uniformities in measured beams are still evident, which may be attributable to various sources including discretization error in the VDAS apodization routine, which was estimated to contribute less than 1.9% change in the pressure field. This effect could potentially be improved or eliminated by electronically matching each element separately; however, as a practical tradeoff we did not pursue this level of complexity.
In general, 2D scans of acoustic beams from the element- by-element method exhibit greater non-uniformity and different intensity distribution than those from holography. There are two factors causing this additional non-uniformity. First, element-by-element measurements are taken at the focus, and unlike holography, these measurements do not characterize the surface vibration profile and instead record a far-field approximation of the effective pressure amplitude on the element. Second, electrical variability was present in the VDAS driving system. In our configuration, it was measured that the VDAS will deliver when all elements are operating simultaneously 84% of the voltage compared to when a single element is driven. Furthermore, because of the power drainage behavior of the capacitors in the VDAS and transient response of the external power source used, the output response among the elements, when firing one element at a time, can vary if they are driven one after another at a high pulse frequency rate. Therefore, in the element-by-element experiment, the elements were triggered at 1-Hz frequency to allow the power source to recover between pulses and eliminate this variability when measuring and recording the relative amplitude information. Conversely, if all elements are triggered simultaneously, the total output of the array can change based on the pulse rate frequency; however, the output of the elements relative to one another is steady. Thus, the holography 2D scan in this situation was necessary to capture the actual operating conditions and eliminate this additional electrical variability.
A 2D holography scan has many advantages over element- by-element measurements, such as, characterizing the acoustic output of all elements synchronously, obtaining the surface boundary conditions, which can be used to produce any arbitrary 2D field shape and capturing other details about the array geometry, layout, and imperfections. However, there were several limitations in the 2D holography scan that were not addressed in the analysis presented. The scan lasted for several hours over which the water temperature changes, thus leading to a change in the acoustic properties of the medium, hydrophone sensitivity response and heating of electrical components. During our scan, the temperature changes in water were limited to 1–2 ° C. Furthermore, even though the misalignment of coordinates was corrected for, non-orthogonality between the mechanical axes can contribute to holographic reconstruction errors. These errors are additional contributing factors to the presence of non-uniformity in the distribution after equalization. Reference [31] presents a detailed discussion of the contribution of each source of error to the reconstruction results.
Although known and required in standards [44], the hydrophone directivity had a significant effect on the power measurements. Therefore, a curve fit using the directivity of a source radiating in free space [40] was performed on the directivity results and yielded an effective element size of 510 μm, which is over twice the nominal size of 200 μm. For element-by-element measurements, accounting for directivity increased the power from 72.5W to 91.4W, a 26.1% increase; for holography measurements, consideration of directivity increased power from 245.8W to 308.9W, a 25.7% increase. Furthermore, even though we measured the directivity up to 40° and the hydrophone reached a maximum angle of 50° during the scan, it was shown that maximum possible power contribution with the most conservative comparison is 1%, leading to the conclusion that for such a focused array majority of the acoustic power lies within the aperture angle of the array.
V. Conclusions
A 256-element array system was characterized in this study. Element outputs were equalized and the ability to generate uniform vortex beams that potentially could be used for the acoustic manipulation of kidney stones was demonstrated. The acoustic output of the phased array was successfully characterized by performing element-by-element and holography measurements. The element-by-element method was used to find the effective pressure amplitude and relative phase delay of each array element. For the first time to our knowledge, each element’s output was localized in a holographic reconstruction at the transducer’s surface, with the corresponding power attributed to localized elements equal to 97.5% of the total radiated power. The output was successfully equalized to produce uniform vortex beams in the focal plane. Measurements of uniformity of the beam intensity distribution showed that equalization based on holography surpassed that based on element-by-element measurements. While some non-ideal behavior persisted, the system was sufficient to accurately produce vortex beams. This method paves the way for future synthesis of more complex two-dimensional beams for acoustic manipulation.
Acknowledgements
We appreciate the help of our colleagues of the Center for Industrial and Medical Ultrasound at the University of Washington and the Laboratory for Industrial and Medical Ultrasound at Moscow State University.
The work was supported by the NSBRI through NASA NCC 9–58, RSF 14–12-00974, NIH NIBIB RO1-EB007643, NIDDK P01-DK043881, NIH R01-EB025187 and K01-DK104854
Biography
 Mohamed A. Ghanem is currently a
PhD candidate in the Department of Aeronautics and Astronautics Engineering at the
University of Washington. He received a B.S. in civil engineering in 2009, an M.S.
degree in aeronautics and astronautics engineering in 2012 from the University of
Washington. He received his Engineer in Training Certificate from the State of
Washington in 2009. He worked as a structural engineer at SIE, Mukilteo, WA from
2012 to 2014. Most of his work focused on linear and nonlinear finite element
analysis under mechanical and thermal loads for metallic and composite components.
His research involves the development of three-dimensional acoustical traps for
macroscopic objects and development of advanced holographic lenses, stress wave
propagation, optimization techniques and finite-element modeling.
 Adam D. Maxwell is currently an
Acting Assistant Professor in the Department of Urology at the University of
Washington. He received a B.S. degree in electrical engineering from University of
Washington in 2006, an M.S. degree in electrical engineering in 2007, and a Ph.D. in
biomedical engineering in 2012, both from the University of Michigan. From 2012 to
2014, he was a postdoctoral fellow in the Department of Urology at the University of
Washington. His research involves development of image-guided ultrasound therapies
including focused ultrasound for mechanical tissue ablation (histotripsy) and
lithotripsy.
 Wayne Kreider earned B.S. and
M.S. degrees in engineering mechanics at Virginia Tech, Blacksburg, VA, in 1993 and
1995, respectively. He worked as an engineer at the Naval Surface Warfare Center,
Dahlgren, VA, from 1996 to 1997, and at Dominion Engineering Inc., Reston, VA, from
1997 to 2001. In 2000, he became a licensed Professional Engineer in the
Commonwealth of Virginia. Much of his work during this time focused on the
development and qualification of ultrasonic cleaning technologies for steam
generators and fuel in nuclear power plants. Since 2001, he has worked at the Center
for Industrial and Medical Ultrasound in the Applied Physics Laboratory (APL) at the
University of Washington in Seattle as a student (Ph.D., 2008, bioengineering), a
Research Associate, and a Senior Engineer (since 2012). His research interests
include acoustic cavitation, transport processes in oscillating bubbles, therapeutic
ultrasound, and ultrasound metrology. Related to the characterization of intense
ultrasound fields, he is a U.S. delegate to the International Electrotechnical
Commission (IEC) as a member of Technical Committee 87, Working Group 6 (since
2015). Also, as a member of the Acoustical Society of America (ASA), he serves on
the Committee on Standards as a technical representative (since 2013).
 Bryan W. Cunitz received the B.A.
degree in physics from Colby College, Waterville, ME, USA, in 1999, the B.S. degree
in electrical engineering from Dartmouth College, Hanover, NH, USA, in 2000, and the
M.S. degree in electrical engineering from the University of Washington, Seattle,
WA, USA, in 2005. He is a Senior Research Engineer with the University of
Washington, where he is involved in improving ultrasound systems for the detection
of kidney stones, therapeutic applications of focused ultrasound for the breaking
and repositioning of kidney stones, image guided acoustic hemostasis, transducer
development, and acoustic output measurements.
 Vera A. Khokhlova received her
M.S. degree in physics in 1986 and Ph.D. and D.Sc. degrees in acoustics in 1991 and
2012, respectively, from Moscow State University (MSU), Moscow, Russia. After
graduation from the Ph.D. program she was appointed by the Moscow State University
and currently is an Associate Professor at the Department of Acoustics of the
Physics Faculty of MSU. Starting from 1995 she is also affiliated with the Center
for Industrial and Medical Ultrasound of the Applied Physics Laboratory (APL) at the
University of Washington in Seattle. Her research interests are in the field of
nonlinear acoustics, therapeutic ultrasound including metrology and bioeffects of
high intensity focused ultrasound fields, shock wave focusing, nonlinear wave
propagation in inhomogeneous media, and nonlinear modeling. She is a Fellow (since
2008) and has served as a Member of the Executive Council of the Acoustical Society
of America (2012–2015); a Member of the Board of the International Society
for Therapeutic Ultrasound (2004 – 2008, 2011 – 2014), a Member of the
“Physical Ultrasound” division of the Scientific Council on Acoustics
of the Russian Academy of Sciences (since 2009), and an Associate Editor of the IEEE
Transactions on UFFC (since 2013).
 Oleg A. Sapozhnikov received his
M.S. degree in physics in 1985 and Ph.D. and D.Sc. degrees in acoustics in 1988 and
2008, respectively, from Moscow State University (MSU), Moscow, Russia. After
graduation from the Ph.D. program he was appointed by Moscow State University and
currently is a Professor in the Department of Acoustics of the Physics Faculty of
MSU. Starting from 1996, Prof. Sapozhnikov is also affiliated with the Center for
Industrial and Medical Ultrasound in the Applied Physics Laboratory (APL) at the
University of Washington in Seattle. His research interests are in the fields of
physical acoustics, nonlinear wave phenomena, medical ultrasound including shock
wave lithotripsy, high intensity focused ultrasound, and ultrasound-based imaging.
He has been awarded by M.V. Lomonosov Prize in Physics (1991), a Prize of the
European Academy for Young Russian Scientists (1994), and an Early Career Award of
the International Commission for Acoustics (2004). He is a Member of the
International Society for Therapeutic Ultrasound (since 2001); a Member of the Board
of the International Congress on Ultrasonics (since 2008); a Head of the
“Physical Ultrasound” division of the Scientific Council on Acoustics
of the Russian Academy of Sciences (since 2009); and a Fellow of the Acoustical
Society of America (since 2009).
 Michael R. Bailey received his
B.S. degree in 1991 from Yale and his M.S. and Ph.D. degrees in 1994 and 1997,
respectively, from the University of Texas at Austin, all in mechanical engineering.
He is currently a Senior Principal Engineer at the Applied Research Laboratory, an
Associate Professor of Mechanical Engineering, and Adjunct Associate Professor of
Urology at the University of Washington. His research interests include cavitation,
shock wave lithotripsy, HIFU, and ultrasound imaging; currently his energy is
focused on developing ultrasound-based technology to reposition kidney stones. He is
a Fellow of the Acoustical Society of America (ASA) and served on the ASA Executive
Council. He served on the Board of the International Society for Therapeutic
Ultrasound (ISTU) from 2009 to 2012, the Bio-effects Committee of the American
Institute for Ultrasound in Medicine from 2006 to 2012, and the Biomedical Acoustics
Technical Committee of the ASA from 2005 to 2008. He received Early Career Awards
from ASA in 2004 and ISTU in 2008.
Contributor Information
Mohamed A. Ghanem, Department of Aeronautics and Astronautics Engineering, University of Washington, Seattle, WA
Mohamed A. Ghanem, Center for Industrial and Medical Ultrasound, Applied Physics Laboratory, University of Washington, Seattle, WA
Adam D. Maxwell, Center for Industrial and Medical Ultrasound, Applied Physics Laboratory, University of Washington, Seattle, WA
Wayne Kreider, Center for Industrial and Medical Ultrasound, Applied Physics Laboratory, University of Washington, Seattle, WA.
Bryan W. Cunitz, Center for Industrial and Medical Ultrasound, Applied Physics Laboratory, University of Washington, Seattle, WA
Oleg A. Sapozhnikov, Center for Industrial and Medical Ultrasound, Applied Physics Laboratory, University of Washington, Seattle, WA
Vera A. Khokhlova, Center for Industrial and Medical Ultrasound, Applied Physics Laboratory, University of Washington, Seattle, WA
Michael R. Bailey, Center for Industrial and Medical Ultrasound, Applied Physics Laboratory, University of Washington, Seattle, WA
Adam D. Maxwell, Department of Urology, University of Washington School of Medicine, Seattle, WA
Michael R. Bailey, Department of Urology, University of Washington School of Medicine, Seattle, WA
Vera A. Khokhlova, Physics Faculty, Μ. V. Lomonosov Moscow State University, Moscow, Russia
Oleg A. Sapozhnikov, Physics Faculty, Μ. V. Lomonosov Moscow State University, Moscow, Russia
References
- [1].Foresti D, Nabavi M, Klingauf M, Ferrari A, and Poulikakos D, “Acoustophoretic contactless transport and handling of matter in air,” Proc. Natl. Acad. Sci, vol. 110, no. 31, pp. 12549–12554, 2013. [DOI] [PMC free article] [PubMed] [Google Scholar]
- [2].Ochiai Y, Hoshi T, and Rekimoto J, “Pixie Dust?: Graphics Generated by Levitated and Animated Objects in,” ACM Trans. Graph, vol. 33, no. 4, p. Article 85, 2014. [Google Scholar]
- [3].Marzo A, Seah SA, Drinkwater BW, Sahoo DR, Long B, and Subramanian, “Holographic acoustic elements for manipulation of levitated objects,” Nat. Commun, vol. 6, no. May, p. 8661, 2015. [DOI] [PMC free article] [PubMed] [Google Scholar]
- [4].Harper JD et al. , “First in Human Clinical Trial of Ultrasonic Propulsion of Kidney Stones,” J. Urol, vol. 195, no. 4, pp. 956–964, 2016. [DOI] [PMC free article] [PubMed] [Google Scholar]
- [5].Shah A et al. , “Novel ultrasound method to reposition kidney stones,” in Urological Research, 2010, vol. 38, no. 6, pp. 491–495. [DOI] [PMC free article] [PubMed] [Google Scholar]
- [6].May PC, Bailey MR, and Harper JD, “Ultrasonic propulsion of kidney stones.,” Curr. Opin. Urol, vol. 26, no. 3, pp. 264–70, 2016. [DOI] [PMC free article] [PubMed] [Google Scholar]
- [7].Hefner B and Marston P, “An acoustical helicoidal wave transducer with applications for the alignment of ultrasonic and underwater systems,” J. Acoust. Soc. Am, vol. 106, pp. 3313–3316, 1999. [Google Scholar]
- [8].Arlt J and Dholakia K, “Generation of high-order Bessel beams by use of an axicon,” Opt. Commun, vol. 177, no. 1, pp. 297–301, 2000. [Google Scholar]
- [9].Marchiano R and Thomas J-L, “Synthesis and analysis of linear and nonlinear acoustical vortices,” Phys. Rev. E, vol. 71, no. 6, p. 066616, 2005. [DOI] [PubMed] [Google Scholar]
- [10].Marston PL, “Axial radiation force of a Bessel beam on a sphere and direction reversal of the force,” J. Acoust. Soc. Am, vol. 120, no. 6, pp. 3518–3524, 2006. [DOI] [PubMed] [Google Scholar]
- [11].Mitri FG, “Negative axial radiation force on a fluid and elastic spheres illuminated by a high-order Bessel beam of progressive waves,” J. Phys. A Math. Theor, vol. 42, no. 24, p. 245202, 2009. [Google Scholar]
- [12].Zhang L and Marston PL, “Axial radiation force exerted by general non-diffracting beams,” J. Acoust. Soc. Am, vol. 131, no. 4, pp. EL329–EL335, 2012. [DOI] [PubMed] [Google Scholar]
- [13].Marston PL, “Radiation force of a helicoidal Bessel beam on a sphere,” J. Acoust. Soc. Am, vol. 125, no. 6, pp. 3539–3547, 2009. [DOI] [PubMed] [Google Scholar]
- [14].Baresch D, Thomas JL, and Marchiano R, “Spherical vortex beams of high radial degree for enhanced single-beam tweezers,” J. Appl. Phys, vol. 113, no. 18, pp. 0–9, 2013. [Google Scholar]
- [15].Ngo FC, Ebbini ES, and Cain C. a., “An experimental analysis of a sector-vortex phased array prototype,” Proceedings., IEEE Ultrason. Symp, vol. 281, no. 86, pp. 999–1002, 1989. [Google Scholar]
- [16].Clement GT and Hynynen K, “Micro-receiver guided transcranial beam steering,” IEEE Trans. Ultrason. Ferroelectr. Freq. Control, vol. 49, no. 4, pp. 447–453, 2002. [DOI] [PubMed] [Google Scholar]
- [17].Wang H, Ebbini ES, O’Donnell M, and Cain CA, “Phase Aberration Correction and Motion Compensation for Ultrasonic Hyperthermia Phased Arrays: Experimental Results,” IEEE Trans. Ultrason. Ferroelectr. Freq. Control, vol. 41, no. 1, pp. 34–43, 1994. [Google Scholar]
- [18].Daum DR, Buchanan MT, Fjield T, and Hynynen K, “Design and evaluation of a feedback based phased array system for ultrasound surgery,” IEEE Trans. Ultrason. Ferroelectr. Freq. Control, vol. 45, no. 2, pp. 431–438, 1998. [DOI] [PubMed] [Google Scholar]
- [19].Hynynen K and Jolesz FA, “Demonstration of potential noninvasive ultrasound brain therapy through an intact skull,” Ultrasound Med. Biol, vol. 24, no. 2, pp. 275–283, 1998. [DOI] [PubMed] [Google Scholar]
- [20].Clement GT, Sun J, Giesecke T, and Hynynen K, “A hemisphere array for non-invasive ultrasound brain therapy and surgery.,” Phys. Med. Biol, vol. 45, no. 12, pp. 3707–19, 2000. [DOI] [PubMed] [Google Scholar]
- [21].Hynynen K et al. , “500-Element ultrasound phased array system for noninvasive focal surgery of the brain: A preliminary rabbit study with ex vivo human skulls,” Magn. Reson. Med, vol. 52, no. 1, pp. 100–107, 2004. [DOI] [PubMed] [Google Scholar]
- [22].Wu F, Thomas JL, and Fink M, “Time reversal of ultrasonic fields. II. Experimental results.,” IEEE Trans. Ultrason. Ferroelectr. Freq. Control, vol. 39, no. 5, pp. 567–78, 1992. [DOI] [PubMed] [Google Scholar]
- [23].Fink M and Prada C, “Acoustic time-reversal mirrors,” Inverse Probl, vol. 17, no. 1, p. R1, 2001. [Google Scholar]
- [24].Prada C, Manneville S, Spoliansky D, and Fink M, “Decomposition of the time reversal operator: Detection and selective focusing on two scatterers,” J. Acoust. Soc. Am, vol. 99, no. 4, pp. 2067–2076, 1996. [Google Scholar]
- [25].Thomas JL and Fink MA, “Ultrasonic beam focusing through tissue inhomogeneities with a time reversal mirror: application to transskull therapy,” IEEE Trans. Ultrason. Ferroelectr. Freq. Control, vol. 43, no. pp. 1122–1129, 1996. [Google Scholar]
- [26].Pernot M, Aubry J-F, Tanter M, Thomas J-L, and Fink M, “High power transcranial beam steering for ultrasonic brain therapy,” Phys. Med. Biol, vol. 48, no. 16, pp. 2577–2589, 2003. [DOI] [PMC free article] [PubMed] [Google Scholar]
- [27].Ebbini ES and Cain CA, “Multiple-Focus Ultrasound Phased-Array Pattern Synthesis: Optimal Driving-Signal Distributions for Hyperthermia,” IEEE Trans. Ultrason. Ferroelectr. Freq. Control, vol. 36, no. 5, pp. 540–548, 1989. [DOI] [PubMed] [Google Scholar]
- [28].Lu M, Wan M, Xu F, Wang X, and Chang X, “Design and experiment of 256-element ultrasound phased array for noninvasive focused ultrasound surgery,” Ultrasonics, vol. 44, no. SUPPL., pp. 325–330, 2006. [DOI] [PubMed] [Google Scholar]
- [29].Lu M, Wan M, Xu F, Wang X, and Zhong H, “Focused beam control for ultrasound surgery with spherical-section phased array: Sound field calculation and genetic optimization algorithm,” IEEE Trans. Ultrason. Ferroelectr. Freq. Control, vol. 52, no. 8, pp. 1270–1290, 2005. [DOI] [PubMed] [Google Scholar]
- [30].Clement GT and Hynynen K, “Field characterization of therapeutic ultrasound phased arrays through forward and backward planar projection,” J. Acoust. Soc. Am, vol. 108, no. 1, pp. 441–446, 2000. [DOI] [PubMed] [Google Scholar]
- [31].Sapozhnikov OA, Tsysar SA, Khokhlova VA, and Kreider W, “Acoustic holography as a metrological tool for characterizing medical ultrasound sources and fields,” J. Acoust. Soc. Am, vol. 138, no. 3, pp. 1515–1532, 2015. [DOI] [PMC free article] [PubMed] [Google Scholar]
- [32].Khokhlova VA et al. , “Design of HIFU Transducers to Generate Specific Nonlinear Ultrasound Fields,” in Physics Proceda, 2016, vol. 87, pp. 132–138. [DOI] [PMC free article] [PubMed] [Google Scholar]
- [33].Hekkenberg RT, Beissner K, Zeqiri B, Bezemer RA, and Hod- nett M, “Validated ultrasonic power measurements up to 20 W,” Ultrasound Med. Biol, vol. 27, no. 3, pp. 427–38, 2001. [DOI] [PubMed] [Google Scholar]
- [34].IEC/TS61949, Ultrasonics - Field characterization - In situ exposure estimation in finite-amlitude ultrasonic beams. 2007.
- [35].Maynard JD, Williams EG, and Y Lee, “Nearfield acoustic holography: I. Theory of generalized holography and the development of NAH,” J. Acoust. Soc. Am, vol. 78, no. 4, pp. 1395–1413, 1985. [Google Scholar]
- [36].a Lewin P, Barrie-Smith N, Ide M, Hynynen K, and Macdonald M, “Interlaboratory acoustic power measurement.,” J. Ultrasound Med, vol. 22, no. 2, pp. 207–13, 2003. [DOI] [PubMed] [Google Scholar]
- [37].Zeqiri B and Hodnett M, “Measurements, phantoms, and standardization,” Proc. Inst. Mech. Eng. Part H J. Eng. Med, vol. 224, no. 2, pp. 375–391, 2010. [DOI] [PubMed] [Google Scholar]
- [38].Maruvada S, Harris GR, Herman BA, and King RL, “Acoustic power calibration of high-intensity focused ultrasound transducers using a radiation force technique,” J. Acoust. Soc. Am, vol. 121, no. 3, pp. 1434–1439, 2007. [DOI] [PubMed] [Google Scholar]
- [39].Shou W et al. , “Acoustic power measurement of high intensity focused ultrasound in medicine based on radiation force,” Ultrasonics, vol. 44, no. SUPPL., pp. 17–20, 2006. [DOI] [PubMed] [Google Scholar]
- [40].Delannoy B, Lasota H, Bruneel C, Torguet R, and Bridoux E, “The infinite planar baffles problem in acoustic radiation and its experimental verification,” J. Appl. Phys, vol. 50, no. 8, pp. 5189–5195, 1979. [Google Scholar]
- [41].Freund I, “Critical point explosions in two-dimensional wave fields,” Opt. Commun, vol. 159, no. 1, pp. 99–117, 1999. [Google Scholar]
- [42].Dennis MR and Götte JB, “Instability of higher-order otpical vortices analyzed with multi-pinhole interferometer,” Phys. Rev. Lett, vol. 109, no. 18, pp. 1018–1020, 2012. [Google Scholar]
- [43].Kumar A, Vaity P, Bhatt J, and Singh RP, “Stability of higher order optical vortices produced by spatial light modulators,” J. Mod. Opt, vol. 60, no. 20, pp. 1696–1700, 2013. [Google Scholar]
- [44].IEC/TS62556, Ultrasonics-field characterization-specification and measurement of field parameters for high intensity therapeutic ultrasound (HITU) transducers and systems. 2014.


