Abstract
Lymph node (LN) metastases are widely considered as a vital assessment of disease progression, as well as an essential indicator for biochemical cure of medullary thyroid carcinoma (MTC). Prognostic effect of numbers of metastatic LN has not been fully studied and the optimal cut-point of LN numbers has not been established. This population-based study designed to investigate prognostic value of numbers of positive LN and determinate the prognostic factors.
Data were generated from Surveillance, Epidemiology, and End Results (SEER) database between 1998 and 2013. X-tile program was applied and cut points for division of LN numbers as low-, medium- and high-risk were 0, 1 to 10, and ≥11. The relationship between numbers of metastatic LN, age, tumor size, extent of tumor, and radiotherapy on overall survival (OS) and disease-specific survival (DSS) were evaluated.
A total of 1466 diagnosed primary MTC patients without metastases were eligible for analysis in current study. 945 (64%) patients were classified as no positive LNs, 327 (22%) as 1 to 10 positive LNs, 194 (14%) as ≥11 positive LNs. Patients with older age, tumor size, ≥11 positive LN were associated with unfavorable OS. Those dispensed with radiation had statistically better prognosis than the others. When stratified by age, there was a significant difference in patients ≥45 years within LN categories (log-rank P < .001). When stratified by tumor size, a significant correlation was noted between rising numbers of involved nodes and falling rates of OS in tumor measuring >2cm setting (2–4 cm setting, log-rank P = .003 and >4 cm setting, log-rank P = .014, separately). There was no statistical difference of the area under the curve (AUC) for OS and DSS prediction between LN group and N stage, suggesting the 2 LN systems had the same predictive power for OS and DSS.
Numbers of metastatic LN showed prognostic power in survival analysis and remained an independent survival predictor which can be evaluated in MTC treatment decisions for optimum assessment.
Keywords: disease-specific survival, extrathyroidal extension, lymph nodes metastases, medullary thyroid carcinoma, overall survival
1. Introduction
Medullary thyroid carcinoma (MTC) is a rare thyroid carcinoma. Due to the dramatically increased incidence of papillary thyroid carcinoma (PTC) in last three decades, the prevalence of MTC accounts for 1% to 2% of all thyroid malignancies according to recent Surveillance, Epidemiology, and End Results (SEER) data.[1] MTC originates from calcitonin-secreting parafollicular cells (C cells) of thyroid gland, and has completely disparate biologic and pathologic features compared with those of epithelial thyroid tumors. Thereby MTC exhibits more aggressive behavior than PTC which is responsible for up to 13.4% of all thyroid cancer-related deaths.[2]
Long term survival differs from patients with various disease courses. Age at diagnosis, stage of disease, thyroid capsule status and distant metastases have been consistently observed to be significant prognostic factors in patients with MTC.[3,4] As the full awareness of the utility of germline RET mutations, the role of RET mutations in predicting tumor outcome is well-established.[5]
It was reported that 54.8% to 64.3% MTC patients had lymph node (LN) metastases after diagnosis.[6] Nodal involvement is widely considered as a vital assessment of disease progression, as well as an essential indicator of postoperative calcitonin (CT) normalization.[7] Adverse survival was detected in patients with rising numbers of involved LN from Esfandiari's study, suggesting the prognostic value of numbers of metastatic LN.[8] However, the current American Joint Committee on Cancer (AJCC) staging system for MTC identifies nodal status based on the cervical region where metastatic LN resected.[9] This nodal staging system gives insight into the extent of tumor spread through lymph vessels, whereas fails to take into account of the amount of LN involved. As a crucial instrument of prognosis prediction, current N categories have been challenging.[10]
However, prognostic effect of numbers of metastatic LN has not been fully studied and the optimal cut-point of LN numbers has not been established. In this population-based analysis, X-tile program was applied to investigate the cut points as high-, medium-, low-risk for division of LN numbers.[11] In order to further investigate prognostic value of numbers of positive LN and compare its survival prediction with current nodal classification in patients with MTC, we conducted this analysis based on SEER database.
2. Methods
We accessed the SEER database by SEER∗Stat version 8.3.5 and a patient list was generated for analysis. SEER is the only population-based database in the U.S. that provides information regarding tumor stage and survival information. Data released from the SEER database contains no identifiers and is publicly available. We obtained permission to access the research data file in the SEER program from the National Cancer Institute, USA (reference number 13493-Nov2017). We enrolled 2147 eligible patients between 1998 and 2013. All cases of histologically diagnosed primary MTC (ICD-O-3 8510/3) and atypical MTC (ICD-O-3 8513/3) were received surgical treatment of thyroid tumor. Patients were excluded if distant metastases were detected at the time of diagnosis. Follow-up durations were calculated from January 1, 1998 to December 31, 2015.
Numbers of positive LN were classified as a categorical variable, and categorized as low-, medium- and high-risk from X-tile program as follows:
-
1.
no positive LNs;
-
2.
1–10 positive LNs;
-
3.
≥11 positive LNs.
Positive LNs were confirmed by dissection, sampling, aspiration or core biopsy. The tumor size was classified as categorical variable: ≤2 cm; 2 to 4 cm; and >4 cm. We also classified thyroid procedures into:
-
1.
local excision;
-
2.
lobectomy or lobectomy with isthmusectomy;
-
3.
total/subtotal thyroidectomy.
The extent of tumor was classified as:
-
1.
intrathyroidal disease (tumor confined to the thyroid, or invasion into thyroid capsule but not beyond, or localized tumor not otherwise specified);
-
2.
minimal extrathyroidal disease (extension to sternothyroid muscle or perithyroid soft tissues);
-
3.
moderately advanced extrathyroidal disease (invade to subcutaneous soft tissues, larynx, trachea, esophagus, or recurrent laryngeal nerve);
-
4.
very advanced extrathyroidal disease (invade to prevertebral fascia or encases carotid artery or mediastinal vessels).
Patients with negative LN were used as a reference. The optimal cut-point for the number of involved LNs were analyzed using the X-tile program (http://www.tissuearray.org/rimmlab/), which identified the cut-point with the minimum P values from log-rank χ2 statistics for the optimal division of positive LNs in terms of survival.[11] The demographic and clinical features of stratifying cases were compared between the 3 LN groups using one-way ANOVA (continues variables) and Chi-squared test (categorical variable). The Kaplan–Meier method was performed to generate survival curves, and the log-rank test was performed to compare the unadjusted disease-specific survival (DSS) and overall survival (OS) rates of patients with different LN status. DSS was defined as the time from the date of diagnosis to the date of thyroid cancer death. OS was defined as the time from the date of diagnosis to the date of death due to any cause (including thyroid cancer) or the last follow-up. Univariate and multivariate analyses were carried out using Cox proportional hazards regression model to estimate the outcome-related factors. Hazard ratio (HR) and 95% confidence intervals (CI) were estimated by Cox regression analysis. In univariate analysis, variable with P-values < .2 was entered into multivariate analysis. If the 95% CI of the HR did not cross 1.00, then the relationship was considered statistically significant for multivariable analysis.
All tests were two-tailed. P-values <.05 were considered significant. All statistical analyses were performed using SPSS version 20.0 software (Chicago, IL, USA).
3. Results
3.1. Patient demographics and clinical features and optimal cut-point for the number of involved LNs identification
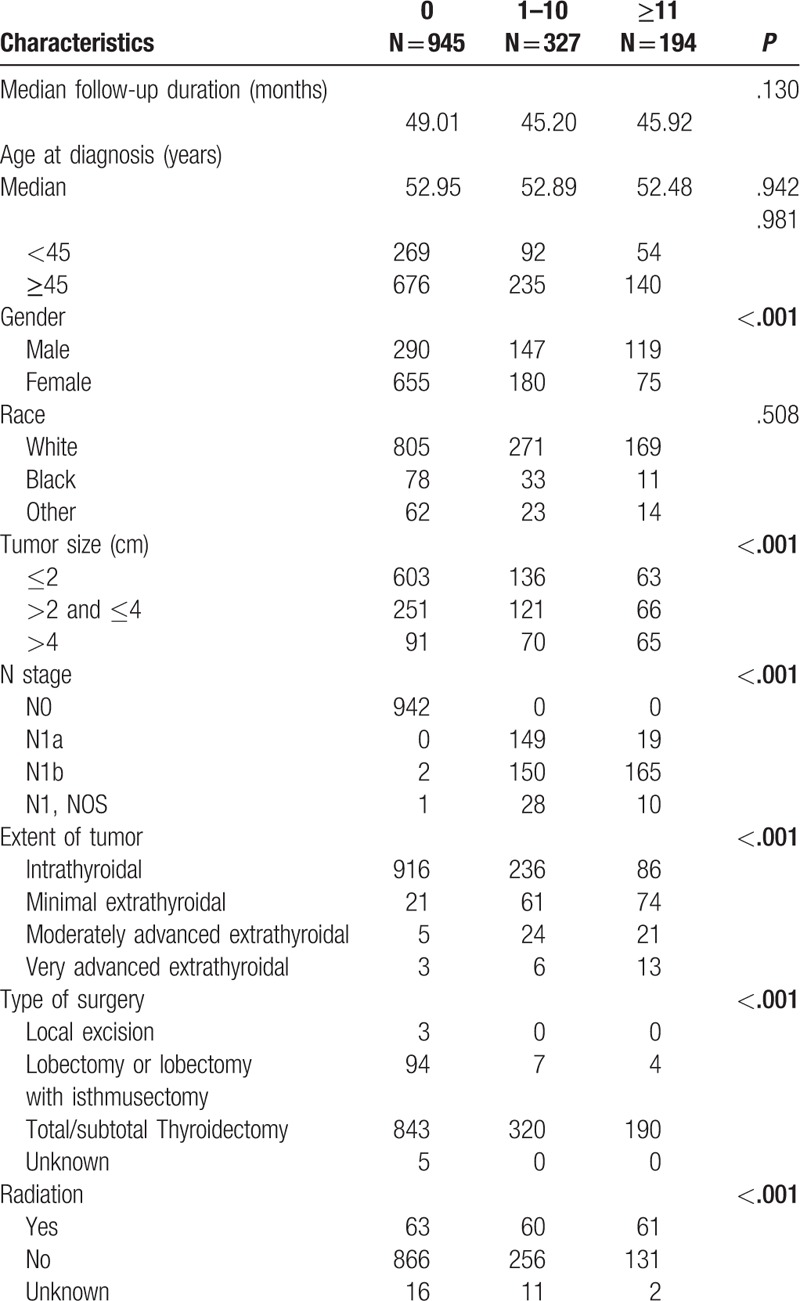
A total of 1466 patients met the eligibility criteria with information of LN status were analyzed in our study. LN metastases were presented in 521 patients (36%). Patient demographics and clinical features were listed in Table 1. Among these patients, 945 (64%) patients were classified as no positive LNs, 327 (22%) as 1 to 10 positive LNs, 194 (14%) as ≥11 positive LNs. The results obtained from clinical-pathologic variables demonstrated that patients with nodal involvement tended to be female (P < .001), presented with a greater tumor size (P < .001), and were more likely to extend beyond thyroid capsule into surrounding tissues (P < .001).
Table 1.
Patient demographics and clinical features.
X-tile identifies the optimal division of LNs into 3 populations (0, 1–10 and ≥11). The maximum of χ2 log-rank values was 25.10, applying 11 and 1 as optimal cut point for the category into high, middle, and low subsets in terms of survival (Fig. 1).
Figure 1.

X-tile analysis of survival data from the SEER registry. X-tile analysis was done on patient data from the SEER registry, equally divided into training and validation sets. X-tile plots of training sets are shown in the left panels, with plots of matched validation sets shown in the smaller inset. The plot shows the χ2 log-rank values produced when dividing the cohort with two cut-points, producing high, middle, and low subsets. The optimal cut-point highlighted by the black circle in the left panels is shown on a histogram of the entire cohort (middle panels) and a Kaplan–Meier plot (right panels). P values were determined by using the cut-point defined in the training set and applying it to the validation set. Figures show positive node numbers divided at the optimal cut-point (1 and 11, χ2 = 25.10, P < .001). SEER = Surveillance, Epidemiology, and End Results.
3.2. Univariate and multivariate analysis
In univariate analysis of OS, age at diagnosis, gender, race, tumor size, extent of tumor, LN group and radiation were selected into Cox proportional hazard model for multivariate analysis (Table 2). Age at diagnosis was entered multivariate analysis as continues variables. Patients with older age (HR 1.067 [95% CI, 1.054–1.081]), tumor size (HR 1.919 [95% CI, 1.272–2.896]), ≥11 positive LNs (HR 1.943 [95% CI, 1.144–3.303]) were associated with unfavorable OS (Table 3). Those dispensed with radiation had statistically better prognosis than the others (HR 0.616 [95% CI, 0.396–0.959]).
Table 2.
Univariate and multivariate Cox proportional hazard analysis for survival-related factors of overall survival.
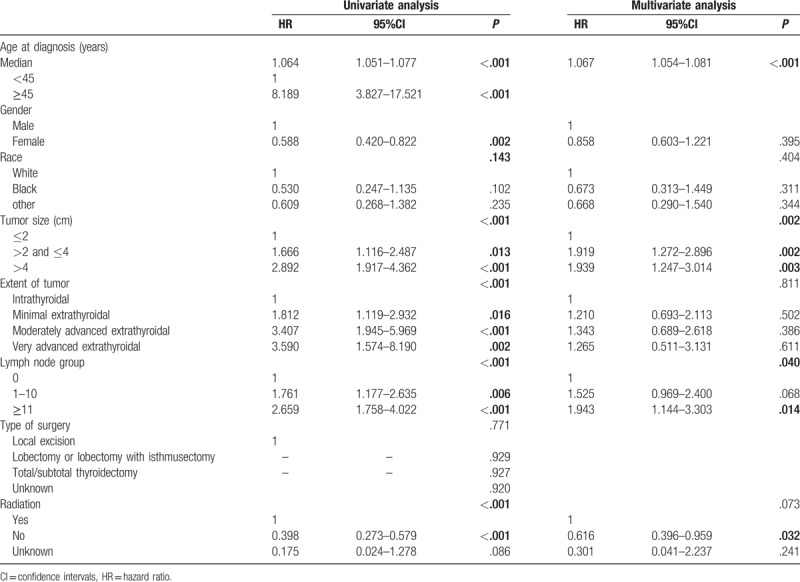
Table 3.
Univariate and multivariate Cox proportional hazard analysis for survival-related factors of disease-specific survival.
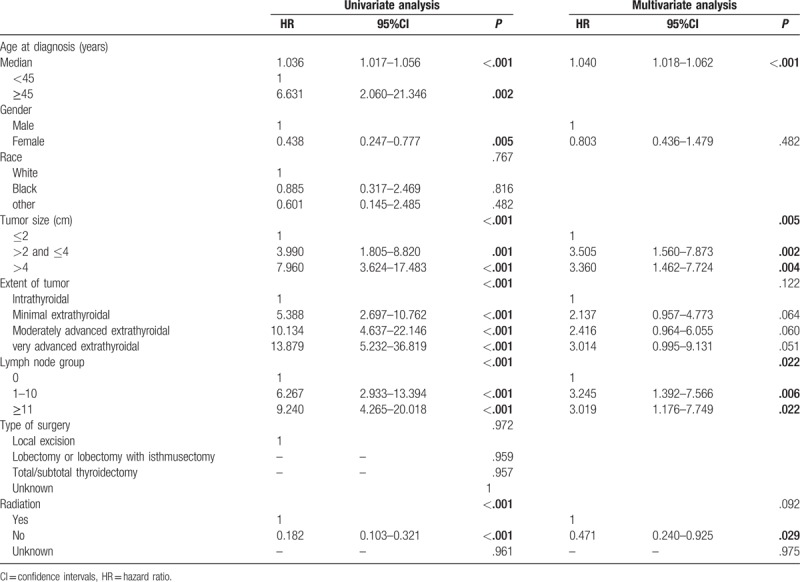
Age at diagnosis, gender, tumor size, extent of tumor, LN group and radiation had significant influences on DSS were selected in univariate analysis. Finally, patients with older age (HR 1.040 [95% CI, 1.018–1.062]), tumor size (HR 3.505 [95% CI, 1.560–7.873]), LN metastases (HR 3.245 [95% CI, 1.392–7.566]) were correlated with poor DSS (Table 3). Those dispensed with radiation had statistically better DSS than the others (HR 0.471 [95% CI, 0.240–0.925]).
3.3. OS comparisons stratified by age, tumor size and radiation categories
Based on the aforementioned results, age at diagnosis, tumor size and radiation significantly affected OS rate. To further investigate this association, we analyzed the difference of OS broken down separately by age, tumor size and radiation classification to avoiding potential confounding factors. When stratified by age, there was a significant difference in patients ≥45 years within LN categories (log-rank P < .001), as opposed to no statistical significant difference of OS in patient aged <45 years (Fig. 2).
Figure 2.
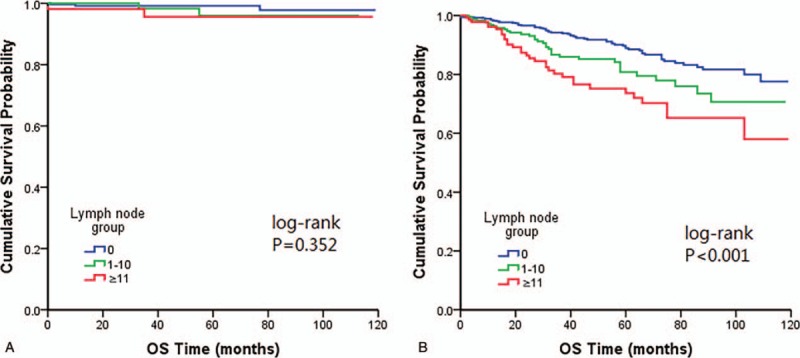
Kaplan–Meier plots showing overall survival stratified by age categories (A) age <45 years (B) age ≥45 years.
When the effect of quantity of positive LNs in OS was compared stratified by tumor size, a similar correlation was noted between rising numbers of involved nodes and falling rates of OS in tumor measuring >2cm setting (Fig. 3).
Figure 3.

Kaplan–Meier plots showing overall survival stratified by tumor size categories (A) tumor size ≤2 cm (B) tumor size 2–4 cm (C) tumor size >4 cm.
After comparison stratified by radiation, we found OS was significantly associated with LN numbers in patients did not receive any form of radiotherapy (Fig. 4).
Figure 4.
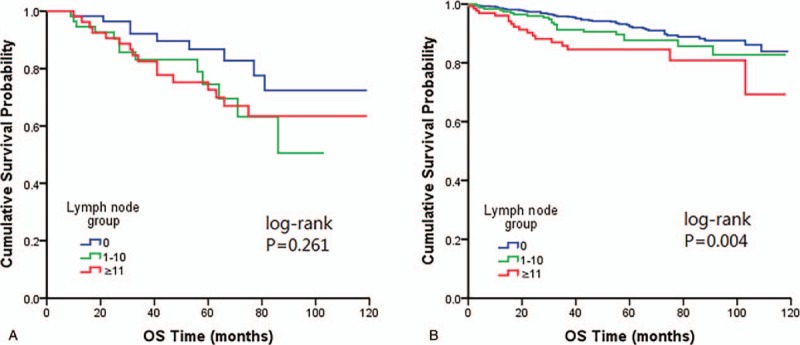
Kaplan–Meier plots showing overall survival stratified by radiation categories (A) with radiation (B) without radiation.
3.4. Predictive accuracy of LN group and N stage
The predictive value of LN group and N stage systems was further studied by receiver operating characteristic curve (ROC) analysis. All of the factors predicted prognosis precisely (P < .05). The area under the curve (AUC) for OS prediction was 0.798 and 0.788 in LN group and N stage (P = .0596) (Fig. 5A), suggesting no statistically difference for OS predictive power between the 2 LN systems. The AUC for DSS prediction was 0.853 and 0.855 in LN group and N stage (P = .2234) (Fig. 5B), suggesting the 2 indexes were both high-power markers for DSS.
Figure 5.
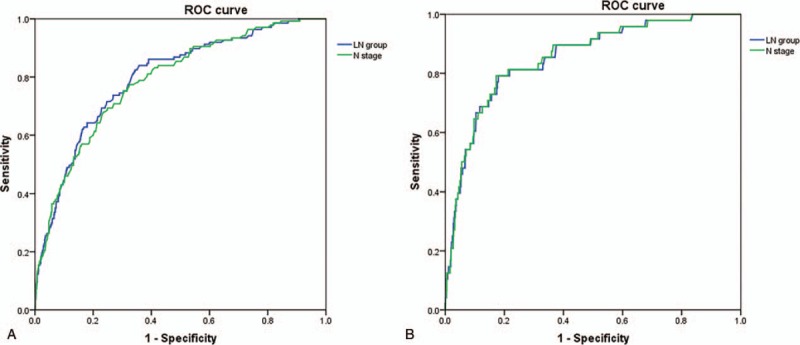
Predictive values of LN group and N stage systems. Both LN group and N stage had the same predictive power for OS (A) and DSS (B). DSS = disease-specific survival, LN = lymph node, OS = overall survival.
4. Discussion
The impact of LN metastases on survival of MTC remains uncertain. There were many researches regarded LN metastases as an indispensable prognostic parameter for analysis in both univariate and multivariate model. Most previous researches defined LN status using different criteria, such as AJCC N categories,[3,4,12] ipsilateral or contralateral,[13] metastatic LN ratio,[14,15] and LN metastases present or not.[2,16] Whereas based on above criteria, status of nodal metastases served as a significant prognostic factor of OS in univariate analysis as opposed to be independent in multivariate analysis, even in large population analysis.[17] Given the failure in multivariate analysis, some authors opposed LN status to be a survival factor.[2,3] Only a few studies have explored the counts of positive LN as prognostic indicator by now.[8,10,18] Esfandiari et al found the number of LN metastases notably influenced OS in multivariate model.[8] From our research, we also demonstrated the predictive effect of LN number categories in survival analysis, emphasizing the importance of LN quantification.
For N staging, the AJCC TNM classification uses metastatic LN locations instead of incremental N categories for LN evaluation. Machens et al designed a study which divided patients according to LN counts (0, 1–10, 11–20, and >20 involved nodes), and confirmed the quantity of LN metastases clearly contributed to prognostic prediction.[10] Similar result was achieved in Esfandiari's study with classification of LN counts (0, 1–5, 6–10, 11–15, and >16 involved nodes) in a large population-based research.[8] Our finding was in agreement with the prognostic status of number-based LN classification.
In aforementioned researches, investigators used distinct criteria for LN categorization and the best threshold for distinction between low-risk and high-risk is not established. Thus, different LN numbers cut-point applied making it difficult to compare between studies. Our study introduced X-tile program to identify the optimal cut-point for LN classification (0, 1–10, ≥11) in 1466 MTC patients, which made our research more reliable. It is noteworthy that positive LN ≥11 is an adverse predictor of OS and DSS in our research.
The AUC value showed LN number categories and N staging are both high power markers for prognostic prediction. As it known to all, N staging is an important prognostic instrument. It is important to recognize that N staging is suggested to be combined with quantity of LN metastases for better risk stratification.
Our results indicated that declining values of LN were obviously implying improved OS in the subgroup of patient ≥45 years. Modigliani et al found that disease detection at early stage would cause survival improvement after the long-term observation of family screening population.[13] We hence recommend regular measurement of CT for elders as a screening marker, especially for those who have family history of MTC.
Numbers of LN remain an independent OS predictor after stratified tumor size in our research. Miccoli et al assumed that lymphatic metastasis developed following extrathyroidal capsule spreading.[19] Yet Esfandiari et al considered frequencies of lymphatic spread appeared to be associated with tumor size.[8] The greater tumor is the higher possibility of lymphatic involvement. Although with different tumor size, LN numbers still have strong association with disease outcome.
The radiotherapy is not a prognostic indicator for MTC patient in previous researches.[2,12] However, patients with metastasis were included in above researches. Our study focused on patients with local disease, and those dispensed with radiation had significantly better prognosis in our study indicating patients receiving radiotherapy usually with more advanced disease. Furthermore, the impact of LN number categories on OS was well established in subgroup excluding radiation confounding.
Biochemical normalization is widely regarded as a strong indicator of disease recurrence and survival, which reflects tumor persistence and occult hematogenous metastasis.[20] Approximately 97.7% MTC patients achieved 10 years survival with biochemical normalization of preoperative CT.[7] On the other hand, rising metastatic LN numbers significantly related to hypercalcitoninemia, resulting elevated rates of distant metastases,[7,10,18,20] regardless of involved LN site. Although some patients lead a normal life without biochemical normalization,[21] absence of involved LN is still a determinant of prolonged survival.[13,22] Strong evidence support ≥10 positive LNs preclude normalization of serum CT after surgical treatment[18,20] and our study further verified ≥11 is a threshold for high risk. Given the significant effect of LN numbers on postoperative CT level, this parameter should be evaluated in treatment decisions for optimum assessment.
In addition, age at diagnosis and stage of disease appeared to be the most important factors in multivariate analysis published so far.[2,13,18] Scopsi et al,[3] Gulben et al,[23] and Brierley et al[16] were found thyroid capsule status were a remarkable predictor of survival in patients with MTC. Our study demonstrated that age and tumor size also contributed to OS and disease specific survival.
However, our study using data from cancer registries also had limitations. As MTC specific biomarker, CT and carcinoembryonic antigen levels are not recorded in SEER database, which are known to be determinants of OS. An additional limitation is that details on genetic result, especially the expression of proto-oncogene RET are unknown. This may influence our results. Moreover, the SEER database does not contain information regarding recurrence data.
5. Conclusion
In conclusion, quantitative metastatic LNs showed prognostic power in survival analysis. Age and tumor size were also the most important prognostic factors for MTC. It is noteworthy that LN number group and N stage both serve as a powerful predictor in OS and DSS and the two LN systems can be evaluated together in MTC treatment decisions for optimum assessment.
Author contributions
Conceptualization: Kexin Meng.
Data curation: Kexin Meng.
Formal analysis: Wenjie Xia and Hua Luo.
Investigation: Haiwei Guo.
Methodology: Hailong Chen.
Supervision: Wenjie Xia.
Writing – original draft: Kexin Meng.
Writing – review & editing: Hailong Chen.
Kexin Meng orcid: 0000-0001-8834-5457.
Footnotes
Abbreviations: AJCC = American Joint Committee on Cancer, AUC = under the curve, CI = confidence intervals, CT = calcitonin, DSS = disease-specific survival, HR = hazard ratio, LN = lymph node, MTC = medullary thyroid carcinoma, OS = overall survival, PTC = papillary thyroid carcinoma, ROC = receiver operating characteristic curve, SEER = Surveillance, Epidemiology, and End Results.
Kexin Meng and Hua Luo contributed equally to this work.
The authors declare no conflict of interests.
References
- [1].Lips CJ, Hoppener JW, Thijssen JH. Medullary thyroid carcinoma: role of genetic testing and calcitonin measurement. Ann Clin Biochem 2001;38:168–79. [DOI] [PubMed] [Google Scholar]
- [2].Kebebew E, Ituarte PH, Siperstein AE, et al. Medullary thyroid carcinoma: clinical characteristics, treatment, prognostic factors, and a comparison of staging systems. Cancer 2000;88:1139–48. [DOI] [PubMed] [Google Scholar]
- [3].Scopsi L, Sampietro G, Boracchi P, et al. Multivariate analysis of prognostic factors in sporadic medullary carcinoma of the thyroid. A retrospective study of 109 consecutive patients. Cancer 1996;78:2173–83. [PubMed] [Google Scholar]
- [4].Dottorini ME, Assi A, Sironi M, et al. Multivariate analysis of patients with medullary thyroid carcinoma. Prognostic significance and impact on treatment of clinical and pathologic variables. Cancer 1996;77:1556–65. [DOI] [PubMed] [Google Scholar]
- [5].Cote GJ, Evers C, Hu MI, et al. Prognostic significance of circulating RET M918T mutated tumor DNA in patients with advanced medullary thyroid carcinoma. J Clin Endocrinol Metab 2017;102:3591–9. [DOI] [PMC free article] [PubMed] [Google Scholar]
- [6].Randle RW, Balentine CJ, Leverson GE, et al. Trends in the presentation, treatment, and survival of patients with medullary thyroid cancer over the past 30 years. Surgery 2017;161:137–46. [DOI] [PMC free article] [PubMed] [Google Scholar]
- [7].Yip DT, Hassan M, Pazaitou-Panayiotou K, et al. Preoperative basal calcitonin and tumor stage correlate with postoperative calcitonin normalization in patients undergoing initial surgical management of medullary thyroid carcinoma. Surgery 2011;150:1168–77. [DOI] [PMC free article] [PubMed] [Google Scholar]
- [8].Esfandiari NH, Hughes DT, Yin H, et al. The effect of extent of surgery and number of lymph node metastases on overall survival in patients with medullary thyroid cancer. J Clin Endocrinol Metab 2014;99:448–54. [DOI] [PMC free article] [PubMed] [Google Scholar]
- [9].Amin MB, Edge S, Greene F, et al. AJCC Cancer Staging Manual. 8th ed. New York, NY, USA: Springer; 2017. [Google Scholar]
- [10].Machens A, Dralle H. Prognostic impact of N staging in 715 medullary thyroid cancer patients: proposal for a revised staging system. Ann Surg 2013;257:323–9. [DOI] [PubMed] [Google Scholar]
- [11].Camp RL, Dolled-Filhart M, Rimm DL. X-tile: a new bio-informatics tool for biomarker assessment and outcome-based cut-point optimization. Clin Cancer ResV 10 2004. 7252–9. [DOI] [PubMed] [Google Scholar]
- [12].Hyer SL, Vini L, A’Hern R, et al. Medullary thyroid cancer: multivariate analysis of prognostic factors influencing survival. Eur J Surg Oncol 2000;26:686–90. [DOI] [PubMed] [Google Scholar]
- [13].Modigliani E, Cohen R, Campos JM, et al. Prognostic factors for survival and for biochemical cure in medullary thyroid carcinoma: results in 899 patients. The GETC Study Group. Groupe d’etude des tumeurs a calcitonine. Clin Endocrinol (Oxf) 1998;48:265–73. [DOI] [PubMed] [Google Scholar]
- [14].Leggett MD, Chen SL, Schneider PD, et al. Prognostic value of lymph node yield and metastatic lymph node ratio in medullary thyroid carcinoma. Ann Surg Oncol 2008;15:2493–9. [DOI] [PubMed] [Google Scholar]
- [15].Qu N, Shi RL, Lu ZW, et al. Metastatic lymph node ratio can further stratify risk for mortality in medullary thyroid cancer patients: a population-based analysis. Oncotarget 2016;7:65937–45. [DOI] [PMC free article] [PubMed] [Google Scholar]
- [16].Brierley J, Tsang R, Simpson WJ, et al. Medullary thyroid cancer: analyses of survival and prognostic factors and the role of radiation therapy in local control. Thyroid 1996;6:305–10. [DOI] [PubMed] [Google Scholar]
- [17].Roman S, Lin R, Sosa JA. Prognosis of medullary thyroid carcinoma: demographic, clinical, and pathologic predictors of survival in 1252 cases. Cancer 2006;107:2134–42. [DOI] [PubMed] [Google Scholar]
- [18].Pilaete K, Delaere P, Decallonne B, et al. Medullary thyroid cancer: prognostic factors for survival and recurrence, recommendations for the extent of lymph node dissection and for surgical therapy in recurrent disease. B-ENT 2012;8:113–21. [PubMed] [Google Scholar]
- [19].Miccoli P, Minuto MN, Ugolini C, et al. Clinically unpredictable prognostic factors in the outcome of medullary thyroid cancer. Endocr Relat Cancer 2007;14:1099–105. [DOI] [PubMed] [Google Scholar]
- [20].Machens A, Gimm O, Ukkat J, et al. Improved prediction of calcitonin normalization in medullary thyroid carcinoma patients by quantitative lymph node analysis. Cancer 2000;88:1909–15. [PubMed] [Google Scholar]
- [21].van Heerden JA, Grant CS, Gharib H, et al. Long-term course of patients with persistent hypercalcitoninemia after apparent curative primary surgery for medullary thyroid carcinoma. Ann Surg 1990;212:395–400. discussion 400–1. [DOI] [PMC free article] [PubMed] [Google Scholar]
- [22].Kandil E, Gilson MM, Alabbas HH, et al. Survival implications of cervical lymphadenectomy in patients with medullary thyroid cancer. Ann Surg Oncol 2011;18:1028–34. [DOI] [PubMed] [Google Scholar]
- [23].Gulben K, Berberoglu U, Boyabatli M. Prognostic factors for sporadic medullary thyroid carcinoma. World J Surg 2006;30:84–90. [DOI] [PubMed] [Google Scholar]


