Abstract
Three-dimensional fat-suppressed spoiled gradient magnetic resonance imaging can be used to observe cartilages with high resolution.
To quantify and compare the T1ρ and T2 relaxation times of the knee articular cartilage between healthy asymptomatic adults and patients with osteoarthritis (OA).
This was a retrospective study of 53 patients with symptomatic OA (6 males and 47 females; aged 57.6 ± 10.0 years) and 26 healthy adults (11 males and 15 females; aged 31.7 ± 12.2 years) from the Ruijin Hospital. T1ρ and T2 relaxation times of knee cartilage were quantified using sagittal multi-echo T1ρ and T2 mapping sequences (3.0-T scanner) and analyzed by receiver operating characteristic (ROC) curve.
T1ρ and T2 relaxation times in the OA group were higher than in controls (both P < .01). The sensitivity, specificity, and critical value for differentiating normal from OA cartilage were respectively 92%, 85.6%, and 45.90 ms for T1ρ, and 93.6%, 93.3%, and 50.42 ms for T2. T2 mapping sequence showed a higher area under the ROC curve (AUC) than T1ρ (0.965 vs 0.927, P = .02). The AUC for differentiating normal from Noyes IIA cartilage was 0.922 for T1ρ (cut-off: 46.0; sensitivity: 87.7%; specificity: 89.7%) and 0.954 for T2 (cut-off: 49.5; sensitivity: 91.2%; specificity: 92.3%), with no significant difference between them (P = .08).
Both T1ρ and T2 mapping sequences could be used to assess OA cartilage lesions, with T2 mapping sequence demonstrating significant sensitivity for cartilage degeneration. These 2 sequences could also identify early-stage OA cartilage.
Keywords: articular cartilage, knee, MRI, osteoarthritis, T1ρ mapping, T2 mapping
1. Introduction
Knee osteoarthritis (OA) is a degenerative disease primarily characterized by the breakdown and loss of the cartilage matrix of the joint. It is typically diagnosed radiographically by the identification of bone changes and joint-space narrowing, and then evaluated using the Kellgren–Lawrence (KL) score.[1] Early changes in the articular cartilage may not be visible on plain X-ray films. Cartilage loss can only be indirectly inferred by the progression of the joint space narrowing, which is highly unreliable even with careful attention to proper technique.[2] In addition, plain X-ray films are insensitive for focal cartilage loss, and joint space widening despite significant cartilage loss may occur in 1 knee compartment simply as a result of narrowing in the other compartment.[3]
Articular cartilage consists of chondrocytes and extracellular matrix, which mainly contains collagen fibers, proteoglycan (PG) aggregates, and water. Cartilage matrix breakdown is characterized by changes in the content of glycosaminoglycan (GAG), type II collagen, and water.[4] Magnetic resonance imaging (MRI) can observe not only the destruction of the structural integrity but also the change of the components in articular cartilage. In particular, many studies showed that T1ρ mapping can detect the changes of PG,[5] while T2 mapping is able to identify the early changes of cartilage (mainly through evaluating the changes in water content).[6] In addition, the changes of T1ρ and T2 relaxation times, can be quantified.[7,8]
Arthroscopy is the gold standard for detecting cartilage lesions; however, it is an invasive operation. Besides, it only observes the surface structure of cartilage and cannot detect the changes of cartilage tissue components. Therefore, it is unsuitable for the follow-up of OA patients. Compared with arthroscopy, three-dimensional (3D) spoiled gradient (SPGR) imaging has good diagnostic accuracy and is considered as the standard for the quantitative morphological evaluation of knee joint cartilage. Since 3D SPGR sequence has high spatial resolution and very high signal intensity in articular cartilage imaging, it has been widely used in cartilage segmentation technology and evaluation of cartilage morphology.[9–12] Nevertheless, this MRI technique still needs to be refined.
In this study, the fat-suppressed (FS) SPGR 3D sequence was used to evaluate the pathological changes of cartilage lesions in patients with knee OA. Many criteria are available for grading the knee cartilage morphology, but we used the Noyes classification standard, which is thought to be close to arthroscopic evaluation.[13] The aim of the present study was to quantify and compare the T1ρ and T2 relaxation times of the knee articular cartilage in healthy adults and OA patients.
2. Materials and methods
2.1. Study design and subjects
This was a retrospective study of healthy subjects and OA patients who underwent knee MRI between April 1, 2013 and October 31, 2013 at the Ruijin Hospital (Shanghai, China). The study was approved by the ethics committee of Ruijin Hospital. The need for individual consent was waived by the committee because of the retrospective nature of the study.
The study involved symptomatic OA patients and healthy volunteers. OA diagnosis was based on the AAOS clinical practice guideline: treatment of OA of the knee.[14] The inclusion criteria were:
-
1.
≥18 years of age;
-
2.
without family history of OA or joint degenerative disease.
The exclusion criteria were:
-
1.
osteosarcoma, giant cell tumor of bone, organic bone injury, or meniscus injury;
-
2.
poor image quality;
-
3.
any contraindication to MRI examination.
2.2. MRI
All MRI examinations were performed using a 3.0-T Signa HDxt MRI scanner (GE Healthcare, Waukesha, WI) and a knee dedicated coil (Quadknee, GE Healthcare, Waukesha, WI). Before examination, all subjects had to statically sit for 30 min outside the MRI room. The following sagittal FS SPGR sequence was used: repetition time/echo time (TR/TE) = 12.3/2.2 ms; field of view (FOV) = 16 cm; matrix = 288 × 256; slice thickness = 1.2 mm; bandwidth (BW) = 31.25 kHz; flip angle = 15°; and acquisition time = 4 min 30 s. Sagittal multi-echo T1ρ and T2 mapping sequences were used to quantify the T1ρ and T2 relaxation times. The T1ρ mapping sequence parameters were: repetition time/echo time (TR/TE) = 9.7/2.9 ms; recovery time = 1175 ms; FOV = 19 cm; matrix = 300 × 200; slice thickness = 4 mm; BW = 41.67 kHz, time of spin-lock (TSL) = 0/10/30/60 ms; spin lock freq (FSL) = 500 Hz; and acquisition time = 12 min 11 s. The 8-echo T2 mapping sequence parameters were: TR = 1000 ms; TE = 8.9–71.0 ms; slice thickness = 5 mm; slice gap = 2 mm; FOV = 16 × 16 cm; number of excitation (NEX) = 1; matrix = 320 × 192; and scan time = 3 min 30 s.
All images were reviewed retrospectively and independently by the 2 experienced musculoskeletal radiologists. In the event of disagreement, a consensus was reached by discussion.
2.3. Morphological analysis
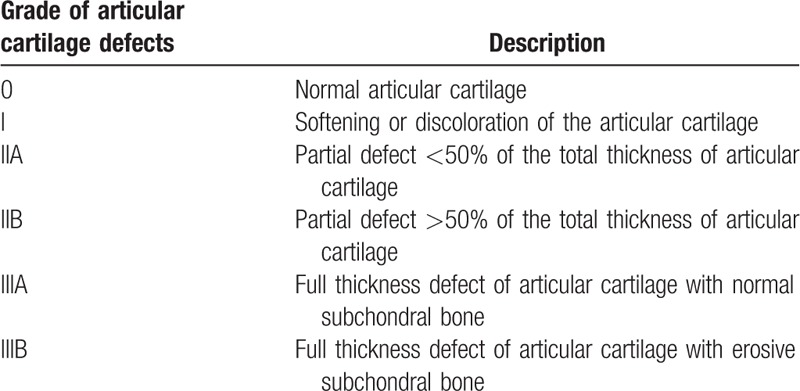
Cartilage defects were graded using 3D FS SPGR images by the 2 experienced radiologists who were blinded to the clinical information and relaxation data of the subjects. The radiologists evaluated the images independently. The Noyes classification standard for evaluation of the knee cartilage morphology is presented in Table 1.[13]
Table 1.
Noyes classification system of knee articular cartilage defects.[13]
2.4. Quantitative analysis
The knee articular cartilage was divided into 4 parts: patella cartilage, intercondylar fossa cartilage (IFC), and the medial and lateral femoral condyle cartilage (MFC and LFC, respectively). The tibial cartilage is very thin, so it was not considered in the present study. T1ρ and T2 images were reconstructed by fitting the image intensity pixel-by-pixel using the mono-exponential fitting algorithms:
where TSL is the time of spin-lock and S is the signal intensity of the T1ρ-weighted image with a given TSL; and
where S is the signal intensity of the T2-weighted image with a given TE. The same pixel and the same ROI of the cartilage were used in the 2 groups.
2.5. Statistical analysis
Continuous data were presented as mean ± standard deviation and analyzed using the Student t test. Categorical data were presented as frequencies and analyzed using the chi-square test. The T1ρ and T2 relaxation times were compared using the paired t test. The diagnostic values of the 2 mapping sequences in detecting cartilage degeneration were evaluated using the receiver-operating characteristic (ROC) curve method. All statistical analyses were conducted using SPSS 16.0 (IBM, Armonk, NY) and MedCalc 12.2.0.0 (MedCalc Software bvba, Ostend, Belgium). Two-sided P-values < .05 were considered statistically significant.
3. Results
3.1. Subjects characteristics
Table 2 presents the characteristics of the subjects. Fifty-three OA patients were recruited as the OA group (6 males and 47 females), with 27 left knees and 26 right knees. Mean age was 57.6 ± 10.0 years and mean BMI was 23.4 ± 2.3 kg/m2. Twenty-six healthy controls were involved (11 males and 15 females), with 14 left knees and 12 right knees. Mean age was 31.7 ± 12.2 years and mean BMI was 22.4 ± 3.1 kg/m2. There were more females in the OA group than in the control group (P < .01). There was no significant difference in BMI (P = .09).
Table 2.
Characteristics of the patients.

3.2. Morphological findings
In the control group, the 3D SPGR images showed that the knee cartilage was integrated and continuous, and there was no lesion to the subchondral bone. There was a laminated structure on the T1ρ and T2 color maps (Fig. 1). Images of cartilage lesions demonstrated that the cartilage was thin, the surface was not smooth and continuous, and there was subchondral bone edema (Figs. 2 and 3).
Figure 1.
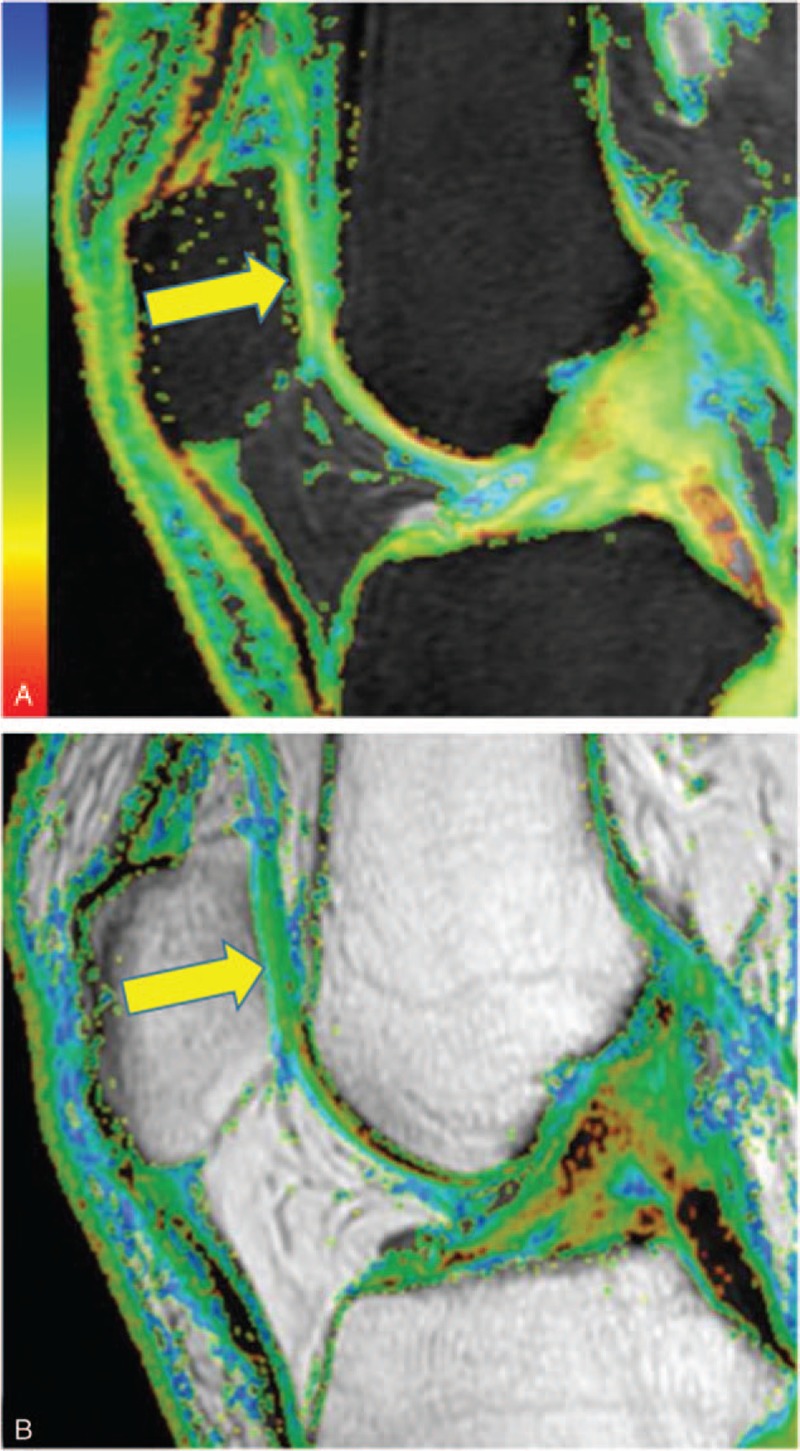
T1ρ (A) and T2 (B) color maps of a representative subject from the control group showing that the patella cartilage (yellow arrow) was integrated, continuous, and has a laminated structure. The T1ρ and T2 relaxation times of patella cartilage were 47.64 ms and 46.25 ms, respectively.
Figure 2.
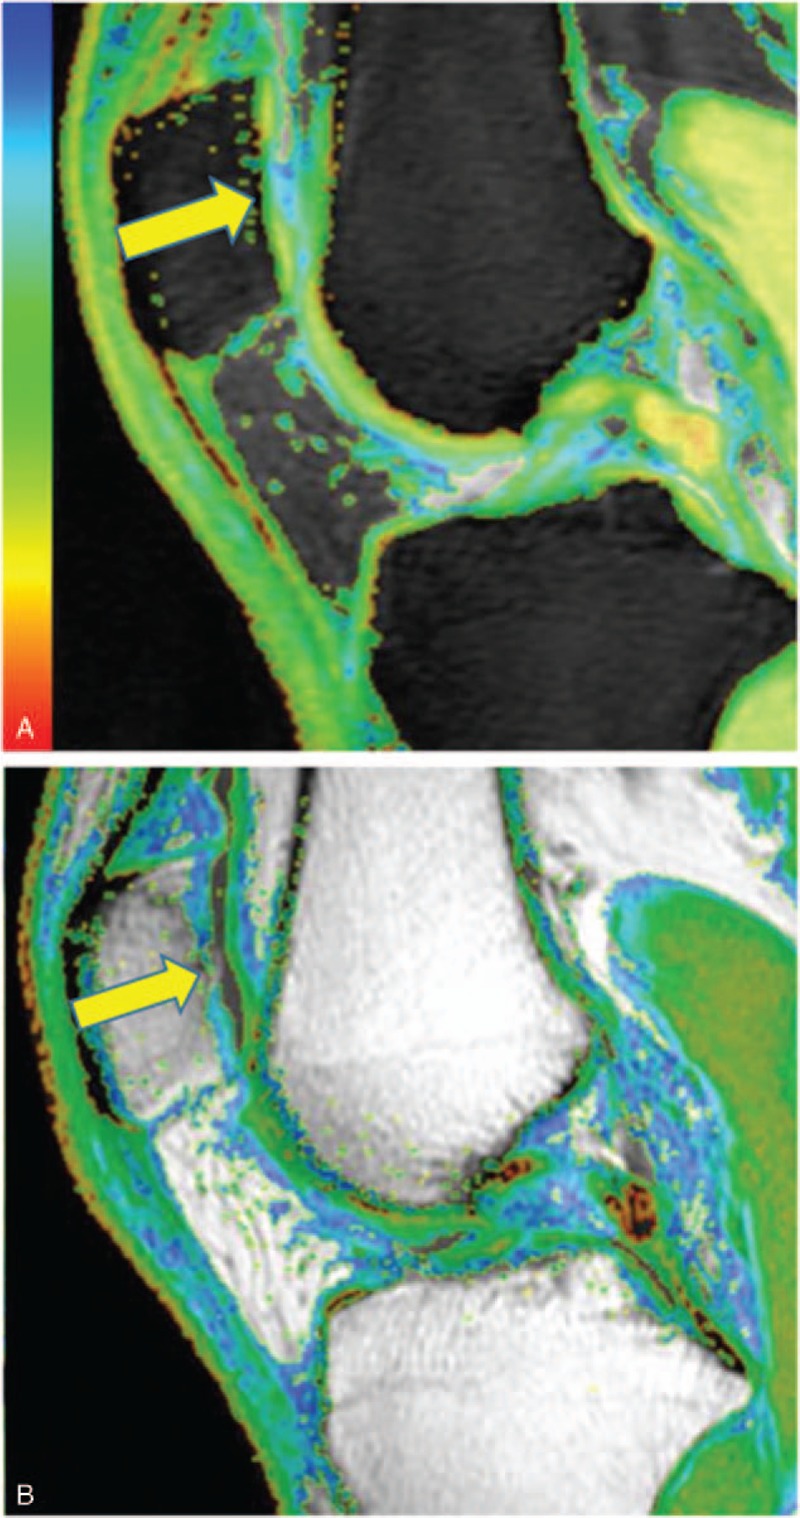
T1ρ (A) and T2 (B) color maps of a representative patient from the OA group showing that the central region of the patella cartilage was thin (yellow arrow). T1ρ and T2 relaxation times of the middle region (71.58 ms and 78.93 ms, respectively) were higher than the surrounding region. OA = osteoarthritis.
Figure 3.
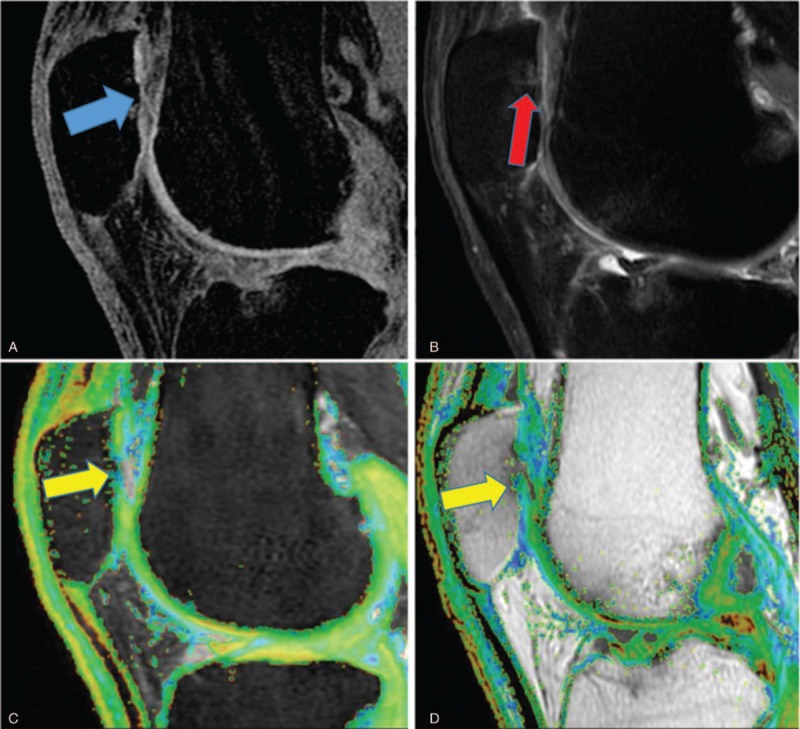
3D SPGR image (A), PD (B), T1ρ color map (C), and T2 color map (D) of a representative OA patient. The central region of the patella cartilage was thin and worn (blue arrow) (A), and there was bone edema (red arrow) under the cartilage lesion (B). T1ρ and T2 relaxation times of the middle region (yellow arrow) (77.77 ms and 78.86 ms, respectively) were higher than the surrounding region. 3D SPGR = 3D fat-suppressed spoiled gradient, OA = osteoarthritis.
3.3. T1ρ and T2 relaxation times
A total of 125 cartilage lesions were found in the OA group, including 37 in patella cartilage, 30 in IFC, 30 in MFC, and 28 in LFC. There were 57 grade IIA lesions, 35 grade IIB lesions, 3 grade IIIA lesion, and 30 grade IIIB lesions.
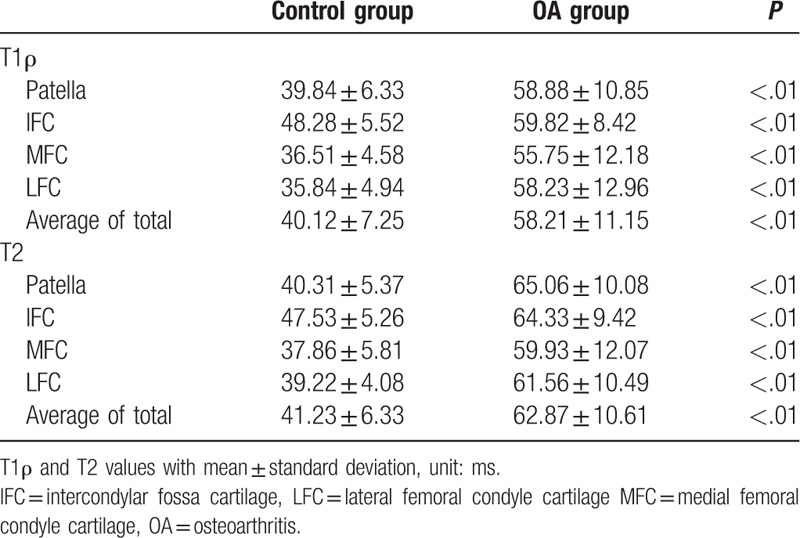
The average T1ρ values of the OA group (58.21 ± 11.15 ms) were significantly higher than those of the control group (40.12 ± 7.25 ms; P < .01) (Table 3). The average T2 values of the OA group (62.87 ± 10.61 ms) were also significantly higher than those of the control group (41.23 ± 6.33 ms; P < .01) (Table 3).
Table 3.
Comparison of the T1ρ and T2 average values between the 2 groups.
Comparisons of T1ρ and T2 values of different grades of cartilage lesions of the OA group are shown in Table 4.
Table 4.
Comparison of the T1ρ and T2 average values in different Noyes classes.

3.4. Comparison of T1ρ and T2 mapping sequences
The ROC curve analysis suggested that the sensitivity, specificity, and critical value for identifying normal and OA cartilage were 92%, 85.6%, and 45.90 ms for T1ρ, and 93.6%, 93.3%, and 50.42 ms for T2 (Table 5). The area under the curve (AUC) of the T2 mapping sequence (0.965) was significantly higher than for the T1ρ mapping sequence (0.927; P = .02) (Table 5 and Fig. 4A).
Table 5.
Value of the T1ρ and T2 mapping sequences for identifying different OA stages.

Figure 4.
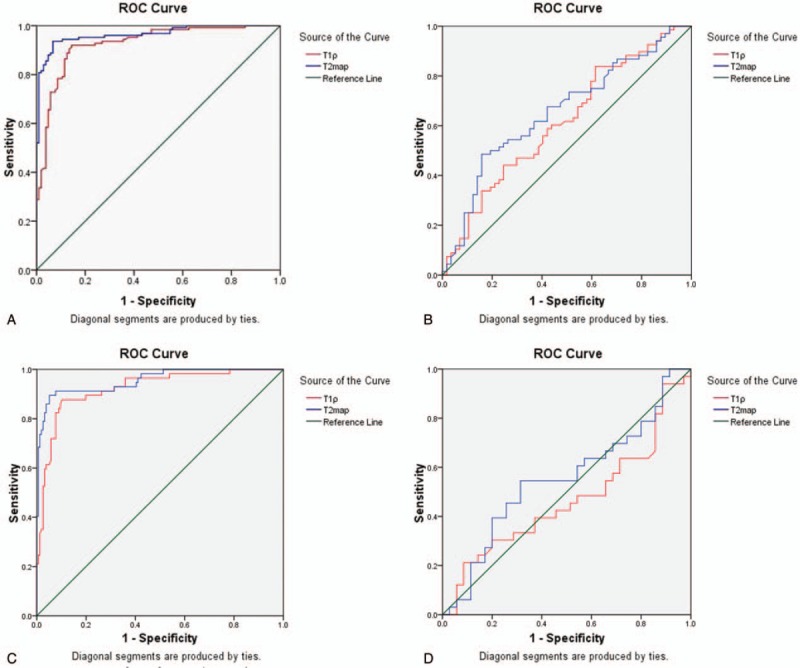
(A) ROC curve analysis of T1ρ and T2 mapping sequence in identifying normal and OA cartilage. (B) ROC curve analysis of T1ρ and T2 mapping sequence in identifying normal and Noyes IIA cartilage. (C) ROC curve analysis of T1ρ and T2 mapping sequence in differentiating Noyes IIA from IIB and Noyes III (IIIA and IIIB) cartilage. (D) ROC curve analysis of T1ρ and T2 mapping sequence in identifying Noyes IIB and Noyes III (IIIA and IIIB) cartilage. ROC = receiver operating characteristic.
We also performed ROC curve analysis of these 2 mapping sequences for different Noyes classes. The AUC for differentiating normal and Noyes IIA cartilage was 0.922 for T1ρ (cut-off value of 46.0, sensitivity of 87.7%, and specificity of 89.7%) and 0.954 for T2 (cut-off value of 49.5, sensitivity of 91.2%, and specificity of 92.3%), indicating that the T1ρ and T2 mapping sequences could effectively differentiate healthy from early-stage OA cartilage, and with no significant difference between them (P = .08) (Table 5 and Fig. 4B). The AUC of differentiating Noyes IIA from IIB and Noyes III (IIIA and IIIB) cartilage was 0.615 for T1ρ (cut-off value of 51.4, sensitivity of 83.8%, and specificity of 38.6%) and 0.656 for T2 (cut-off value of 65.6, sensitivity of 48.5%, and specificity of 84.2%), with no significant difference between them (P = .45) (Table 5 and Fig. 4C). When differentiating Noyes IIB and Noyes III cartilage, the AUC was 0.534 (P = .628) for T1ρ, and for 0.552 (P = .458) for T2, indicating that T1ρ and T2 mapping sequences could not differentiate Noyes IIB from Noyes III cartilage (Table 5 and Fig. 4D). These results suggest that T1ρ and T2 mapping sequences were not able to differentiate different Noyes classes of cartilage.
4. Discussion
FS SPGR-3D MRI can be used to image cartilages with high resolution. The aim of the present study was to quantify and compare the T1ρ and T2 relaxation times of the knee articular cartilage between healthy asymptomatic adults and OA patients. The results demonstrated that both T1ρ and T2 cartilage values were significantly increased in patients with OA. Thus, T1ρ and T2 mapping sequences could be used to assess OA cartilage lesions, and T2 mapping sequence was superior to T1ρ mapping sequence when detecting cartilage degeneration. Moreover, we also found that T1ρ and T2 mapping sequences could differentiate normal from Noyes IIA cartilage, indicating that these 2 sequences could be used to diagnose early-stage OA. In addition, ROC curve analysis of different Noyes classes indicated that these 2 sequences could not effectively identify different Noyes classes of cartilage.
OA is thought to be the most prevalent chronic joint disease and its incidence is rising because of the ageing population and obesity epidemic.[15] Indeed, OA becomes more common with age, and more women are affected than men after 50 years of age.[15] McAlindon et al[16] revealed a higher prevalence of OA in women, especially for the PAT-femur compartment, with a prevalence of 8% in women >55 years of age and of 2% in men of the same age group. Accordingly, we also found that female patients accounted for the majority of the patients with OA, and the mean age of the OA group was 57.6 ± 10.0 years.
Arthroscopy is the gold standard for detecting cartilage lesions, but it is invasive, while X-rays are unsuitable to detect cartilage lesions. Therefore, in order to compare OA cartilage with normal cartilage, younger controls were selected in our study. Although some previous studies demonstrated that aging is a major factor in cartilage degeneration, Hirose et al showed that the T1ρ and T2 values of proximal tibiofibular and femorotibial joint cartilages were not affected by aging in the femorotibial joint.[17,18] Therefore, the difference of age between the 2 groups should not introduce a significant bias.
T1ρ relaxation time has recently been proposed as an attractive alternative modality to detect biochemical changes in cartilage.[7,19–22] Indeed, the T1ρ parameter describes the spin-lattice relaxation in the rotating frame. It probes the slow-motion interactions between motion-restricted water molecules and their local macromolecular environment. Extracellular matrix in articular cartilage provides a motion-restricted environment to water molecules. Thus, changes to the extracellular matrix (such as PG loss) may be reflected by measuring T1ρ.[23] Accordingly, early studies in human subjects had shown elevated T1ρ values in patients with OA.[23–25]
Cobb et al[26] suggested that significant differences were found in T1ρ values between epiphyseal and articular cartilage layers, and that T1ρ measurement is a feasible method for differentiating epiphyseal and articular cartilage in a pediatric population. Before cartilage morphology changes, T1ρ value can be sensitive to show age-related cartilage degeneration and the extent of cartilage degeneration.[27] Therefore, T1ρ is able to display the hierarchical structure of normal cartilage in children and can be used to evaluate the natural degeneration of cartilage.
Some studies suggested that the T1ρ values of patella and femoral cartilages in OA patients were higher than that of controls,[23,28] indicating that T1ρ can be used to detect early cartilage degeneration before morphological changes and may allow the monitoring of the course of OA and injury progression, as well as evaluating treatment success. These results are consistent with the results of our study.
T2 relaxation reflects the free water proton molecules moving and exchanging energy inside the cartilaginous matrix.[28] Damage to the collagen–PG matrix and increase of water content in degenerating cartilage may increase T2 relaxation times. In an effort to correlate the T2 relaxation times with biochemical changes in cartilage, previous in vitro studies have reported that T2 correlated poorly with PG content,[29,30] and PG cleavage did not affect T2 values.[31] Instead, T2 can be affected by collagen content and orientation and/or water content.[19,32] It has been observed that loss of PG is an initiating event in early OA, while neither the content nor the type of collagen is altered in early OA.[33] Increased T2 values were reported previously in degenerated cartilage in both animal models and human subjects.[34–36] The values obtained in the present study are consistent with the reported values.
Previous studies showed that T1ρ and T2 relaxation times can display the biochemical changes of the knee joint cartilage.[37,38] Li et al[28] demonstrated that the average T1ρ and T2 values were significantly higher in patients with OA compared with controls. Increased T1ρ and T2 values were correlated with increased severity in plain X-ray imaging and MRI grading of OA. T1ρ has a larger range and higher effect size than T2, suggesting that the T1ρ relaxation time may be a more sensitive indicator for early cartilage degeneration than T2. Takayama et al[39] suggested that T1ρ mapping was superior to T2 mapping for evaluating the denatured articular cartilage of the knee in OA, supporting the present study.
In previous studies, T1ρ and T2 mappings were compared after correlating them to radiological scaling of severity or clinical severity scoring, and it was concluded that T1ρ mapping was more sensitive than T2 mapping for depicting articular cartilage degeneration.[28,40] Articular cartilage is composed of 90% type II collagen, 5% to 10% PG, and water.[41] It is known that the T1ρ value is inversely correlated to PG content and that T2 value is proportionally correlated to collagen orientation and water content, but not to PG content.[19,42,43] In the early stage of OA, PG depletion occurs before decrease in collagen.[44–46] Therefore, it is presumed that T1ρ mapping is sensitive enough to detect PG depletion in the early stage of OA. Results of our study showed that T2 change was more obvious than T1ρ change, and that the sensitivity and specificity of T2 are higher than that of T1ρ. Nevertheless, the results suggest that T1ρ and T2 mapping sequences were not able to differentiate different Noyes classes of cartilage. In addition, T1ρ and T2 mappings have similar values to differentiate between moderate and severe OA. Discrepancies between studies may be explained, at least in part, by the fact that T1ρ is more sensitive to early cartilage lesions, while the lesions assessed in the present study were more advanced lesions, leading to higher T2 sensitivity.
Of course, the present study is not without limitations. The sample size was small and from a single center. In addition, age and gender distribution were different between the 2 groups. Further study is still necessary to assess adequately the value of T1ρ and T2 FS SPGR 3D MRI for OA. In addition, SPGR should be compared with other advanced MRI sequences such as FLAIR, FIESTA, and 2D cine PC-MRI, which have been shown to be valuable for the observation of fine soft tissue structures.[47,48] The value of computer-assisted diagnostic tools and radionomics should also be explored.[49–51] Indeed, such sequences and tools are used in a variety of diseases and conditions, and they should be assessed in knee OA.
5. Conclusion
Both T1ρ and T2 mapping sequences could be used to assess OA cartilage lesions, with T2 mapping sequence being superior to T1ρ mapping sequence in detecting cartilage degeneration. These 2 sequences could also effectively identify healthy and early-stage OA cartilage.
Acknowledgments
The authors acknowledge the invaluable participation of the subjects and the help from the staff of the MRI suite of the Ruijin Hospital.
Author contributions
Conceptualization: Zhihui Li and Yong Lu.
Data curation: Zhihui Li, Meihua Jiang, Zhe Chen, Xiaobing Xi, Xiaoyi Ding, and Fuhua Yan.
Formal analysis: Zhihui Li, Yong Lu, Meihua Jiang, Zhe Chen, Xiaobing Xi, Xiaoyi Ding, and Fuhua Yan.
Funding acquisition: Yong Lu.
Project administration: Yong Lu.
Writing – original draft: Zhihui Li.
Writing – review & editing: Yong Lu, Meihua Jiang, Zhe Chen, Xiaobing Xi, Xiaoyi Ding, and Fuhua Yan.
Footnotes
Abbreviations: AUC = area under the curve, BW = bandwidth, FOV = field of view, FSL = spin lock freq, FS SPGR-3D = three-dimensional fat-suppressed spoiled gradient, GAG = glycosaminoglycan, IFC = intercondylar fossa cartilage, KL = Kellgren–Lawrence, MRI = magnetic resonance imaging, NEX = number of excitation, OA = osteoarthritis, PG = proteoglycan, ROC = receiver operating characteristic, TR/TE = repetition time/echo time, TSL = time of spin-lock.
ZL and HW contributed equally to this work.
This study was supported by National Natural Science Foundation of China (No. 81372000).
The authors declare that they have no conflict of interest.
References
- [1].Kellgren JH, Lawrence JS. Radiological assessment of osteo-arthrosis. Ann Rheum Dis 1957;16:494–502. [DOI] [PMC free article] [PubMed] [Google Scholar]
- [2].Rogers J, Watt I, Dieppe P. Comparison of visual and radiographic detection of bony changes at the knee joint. Br Med J 1990;300:367–8. [DOI] [PMC free article] [PubMed] [Google Scholar]
- [3].Chan WP, Lang P, Stevens MP, et al. Osteoarthritis of the knee: comparison of radiography, CT, and MR imaging to assess extent and severity. AJR Am J Roentgenol 1991;157:799–806. [DOI] [PubMed] [Google Scholar]
- [4].Dijkgraaf LC, de Bont LG, Boering G, et al. Normal cartilage structure, biochemistry, and metabolism: a review of the literature. J Oral Maxillofac Surg 1995;53:924–9. [DOI] [PubMed] [Google Scholar]
- [5].Wheaton AJ, Dodge GR, Borthakur A, et al. Detection of changes in articular cartilage proteoglycan by T(1rho) magnetic resonance imaging. J Orthop Res 2005;23:102–8. [DOI] [PMC free article] [PubMed] [Google Scholar]
- [6].Kijowski R, Blankenbaker DG, Munoz Del Rio A, et al. Evaluation of the articular cartilage of the knee joint: value of adding a T2 mapping sequence to a routine MR imaging protocol. Radiology 2013;267:503–13. [DOI] [PubMed] [Google Scholar]
- [7].Akella SV, Regatte RR, Gougoutas AJ, et al. Proteoglycan-induced changes in T1rho-relaxation of articular cartilage at 4T. Magn Reson Med 2001;46:419–23. [DOI] [PubMed] [Google Scholar]
- [8].Duvvuri U, Kudchodkar S, Reddy R, et al. T(1rho) relaxation can assess longitudinal proteoglycan loss from articular cartilage in vitro. Osteoarthritis Cartilage 2002;10:838–44. [DOI] [PubMed] [Google Scholar]
- [9].Disler DG, McCauley TR, Kelman CG, et al. Fat-suppressed three-dimensional spoiled gradient-echo MR imaging of hyaline cartilage defects in the knee: comparison with standard MR imaging and arthroscopy. AJR Am J Roentgenol 1996;167:127–32. [DOI] [PubMed] [Google Scholar]
- [10].Disler DG, McCauley TR, Wirth CR, et al. Detection of knee hyaline cartilage defects using fat-suppressed three-dimensional spoiled gradient-echo MR imaging: comparison with standard MR imaging and correlation with arthroscopy. AJR Am J Roentgenol 1995;165:377–82. [DOI] [PubMed] [Google Scholar]
- [11].Disler DG. Fat-suppressed three-dimensional spoiled gradient-recalled MR imaging: assessment of articular and physeal hyaline cartilage. AJR Am J Roentgenol 1997;169:1117–23. [DOI] [PubMed] [Google Scholar]
- [12].Wang SF, Cheng HC, Chang CY. Fat-suppressed three-dimensional fast spoiled gradient-recalled echo imaging: a modified FS 3D SPGR technique for assessment of patellofemoral joint chondromalacia. Clin Imaging 1999;23:177–80. [DOI] [PubMed] [Google Scholar]
- [13].Noyes FR, Stabler CL. A system for grading articular cartilage lesions at arthroscopy. Am J Sports Med 1989;17:505–13. [DOI] [PubMed] [Google Scholar]
- [14].Richmond J, Hunter D, Irrgang J, et al. American Academy of Orthopaedic Surgeons clinical practice guideline on the treatment of osteoarthritis (OA) of the knee. J Bone Joint Surg Am 2010;92:990–3. [DOI] [PubMed] [Google Scholar]
- [15].Bijlsma JW, Berenbaum F, Lafeber FP. Osteoarthritis: an update with relevance for clinical practice. Lancet 2011;377:2115–26. [DOI] [PubMed] [Google Scholar]
- [16].McAlindon TE, Snow S, Cooper C, et al. Radiographic patterns of osteoarthritis of the knee joint in the community: the importance of the patellofemoral joint. Ann Rheum Dis 1992;51:844–9. [DOI] [PMC free article] [PubMed] [Google Scholar]
- [17].Hirose J, Nishioka H, Nakamura E, et al. T1rho and T2 mapping of the proximal tibiofibular joint in relation to aging and cartilage degeneration. Eur J Radiol 2012;81:2776–82. [DOI] [PubMed] [Google Scholar]
- [18].Goto H, Iwama Y, Fujii M. The natural degeneration course in the T1rho values of normal knee cartilage. Kobe J Med Sci 2012;57:155–70. [PubMed] [Google Scholar]
- [19].Duvvuri U, Reddy R, Patel SD, et al. T1rho-relaxation in articular cartilage: effects of enzymatic degradation. Magn Reson Med 1997;38:863–7. [DOI] [PubMed] [Google Scholar]
- [20].Nugent AC, Johnson GA. T1rho imaging using magnetization-prepared projection encoding (MaPPE). Magn Reson Med 2000;43:421–8. [DOI] [PubMed] [Google Scholar]
- [21].Makela HI, Grohn OH, Kettunen MI, et al. Proton exchange as a relaxation mechanism for T1 in the rotating frame in native and immobilized protein solutions. Biochem Biophys Res Commun 2001;289:813–8. [DOI] [PubMed] [Google Scholar]
- [22].Mlynarik V, Szomolanyi P, Toffanin R, et al. Transverse relaxation mechanisms in articular cartilage. J Magn Reson 2004;169:300–7. [DOI] [PubMed] [Google Scholar]
- [23].Li X, Han ET, Ma CB, et al. In vivo 3T spiral imaging based multi-slice T(1rho) mapping of knee cartilage in osteoarthritis. Magn Reson Med 2005;54:929–36. [DOI] [PubMed] [Google Scholar]
- [24].Duvvuri U, Charagundla SR, Kudchodkar SB, et al. Human knee: in vivo T1(rho)-weighted MR imaging at 1.5 T--preliminary experience. Radiology 2001;220:822–6. [DOI] [PubMed] [Google Scholar]
- [25].Regatte RR, Akella SV, Wheaton AJ, et al. 3D-T1rho-relaxation mapping of articular cartilage: in vivo assessment of early degenerative changes in symptomatic osteoarthritic subjects. Acad Radiol 2004;11:741–9. [DOI] [PubMed] [Google Scholar]
- [26].Cobb JG, Kan JH, Gore JC. T1rho mapping of pediatric epiphyseal and articular cartilage in the knee. J Magn Reson Imaging 2013;38:299–305. [DOI] [PMC free article] [PubMed] [Google Scholar]
- [27].Goto H, Iwama Y, Fujii M, et al. A preliminary study of the T1rho values of normal knee cartilage using 3T-MRI. Eur J Radiol 2012;81:e796–803. [DOI] [PubMed] [Google Scholar]
- [28].Li X, Benjamin Ma C, Link TM, et al. In vivo T(1rho) and T(2) mapping of articular cartilage in osteoarthritis of the knee using 3 T MRI. Osteoarthritis Cartilage 2007;15:789–97. [DOI] [PMC free article] [PubMed] [Google Scholar]
- [29].Regatte RR, Akella SV, Borthakur A, et al. Proteoglycan depletion-induced changes in transverse relaxation maps of cartilage: comparison of T2 and T1rho. Acad Radiol 2002;9:1388–94. [DOI] [PubMed] [Google Scholar]
- [30].Toffanin R, Mlynarik V, Russo S, et al. Proteoglycan depletion and magnetic resonance parameters of articular cartilage. Arch Biochem Biophys 2001;390:235–42. [DOI] [PubMed] [Google Scholar]
- [31].Nieminen MT, Toyras J, Rieppo J, et al. Quantitative MR microscopy of enzymatically degraded articular cartilage. Magn Reson Med 2000;43:676–81. [DOI] [PubMed] [Google Scholar]
- [32].Gray ML, Burstein D, Xia Y. Biochemical (and functional) imaging of articular cartilage. Semin Musculoskelet Radiol 2001;5:329–43. [DOI] [PubMed] [Google Scholar]
- [33].Dijkgraaf LC, de Bont LG, Boering G, et al. The structure, biochemistry, and metabolism of osteoarthritic cartilage: a review of the literature. J Oral Maxillofac Surg 1995;53:1182–92. [DOI] [PubMed] [Google Scholar]
- [34].Mosher TJ, Dardzinski BJ, Smith MB. Human articular cartilage: influence of aging and early symptomatic degeneration on the spatial variation of T2–preliminary findings at 3 T. Radiology 2000;214:259–66. [DOI] [PubMed] [Google Scholar]
- [35].Dunn TC, Lu Y, Jin H, et al. T2 relaxation time of cartilage at MR imaging: comparison with severity of knee osteoarthritis. Radiology 2004;232:592–8. [DOI] [PMC free article] [PubMed] [Google Scholar]
- [36].Mosher TJ, Dardzinski BJ. Cartilage MRI T2 relaxation time mapping: overview and applications. Semin Musculoskelet Radiol 2004;8:355–68. [DOI] [PubMed] [Google Scholar]
- [37].Carballido-Gamio J, Stahl R, Blumenkrantz G, et al. Spatial analysis of magnetic resonance T1rho and T2 relaxation times improves classification between subjects with and without osteoarthritis. Med Phys 2009;36:4059–67. [DOI] [PMC free article] [PubMed] [Google Scholar]
- [38].Regatte RR, Akella SV, Lonner JH, et al. T1rho relaxation mapping in human osteoarthritis (OA) cartilage: comparison of T1rho with T2. J Magn Reson Imaging 2006;23:547–53. [DOI] [PubMed] [Google Scholar]
- [39].Takayama Y, Hatakenaka M, Tsushima H, et al. T1rho is superior to T2 mapping for the evaluation of articular cartilage denaturalization with osteoarthritis: radiological-pathological correlation after total knee arthroplasty. Eur J Radiol 2013;82:e192–8. [DOI] [PubMed] [Google Scholar]
- [40].Stahl R, Luke A, Li X, et al. T1rho, T2 and focal knee cartilage abnormalities in physically active and sedentary healthy subjects versus early OA patients–a 3.0-Tesla MRI study. Eur Radiol 2009;19:132–43. [DOI] [PubMed] [Google Scholar]
- [41].Bolbos RI, Link TM, Ma CB, et al. T1rho relaxation time of the meniscus and its relationship with T1rho of adjacent cartilage in knees with acute ACL injuries at 3 T. Osteoarthritis Cartilage 2009;17:12–8. [DOI] [PMC free article] [PubMed] [Google Scholar]
- [42].Tsushima H, Okazaki K, Takayama Y, et al. Evaluation of cartilage degradation in arthritis using T1rho magnetic resonance imaging mapping. Rheumatol Int 2012;32:2867–75. [DOI] [PubMed] [Google Scholar]
- [43].Keenan KE, Besier TF, Pauly JM, et al. Prediction of glycosaminoglycan content in human cartilage by age, T1rho and T2 MRI. Osteoarthritis Cartilage 2011;19:171–9. [DOI] [PMC free article] [PubMed] [Google Scholar]
- [44].Waldschmidt JG, Rilling RJ, Kajdacsy-Balla AA, et al. In vitro and in vivo MR imaging of hyaline cartilage: zonal anatomy, imaging pitfalls, and pathologic conditions. Radiographics 1997;17:1387–402. [DOI] [PubMed] [Google Scholar]
- [45].Park S, Krishnan R, Nicoll SB, et al. Cartilage interstitial fluid load support in unconfined compression. J Biomech 2003;36:1785–96. [DOI] [PMC free article] [PubMed] [Google Scholar]
- [46].Saarakkala S, Julkunen P, Kiviranta P, et al. Depth-wise progression of osteoarthritis in human articular cartilage: investigation of composition, structure and biomechanics. Osteoarthritis Cartilage 2010;18:73–81. [DOI] [PubMed] [Google Scholar]
- [47].Carrillo Mezo R, Lara Garcia J, Arroyo M, et al. Relevance of 3D magnetic resonance imaging sequences in diagnosing basal subarachnoid neurocysticercosis. Acta Trop 2015;152:60–5. [DOI] [PubMed] [Google Scholar]
- [48].Sun W, Ruan Z, Dai X, et al. Quantifying hemodynamic changes in moyamoya disease based on two-dimensional cine phase-contrast magnetic resonance imaging and computational fluid dynamics. World Neurosurg 2018. [DOI] [PubMed] [Google Scholar]
- [49].Kong B, Sun S, Wang X, et al. Invasive cancer detection utilizing compressed convolutional neural network and transfer learning. In: Frangi A, Schnabel J, Davatzikos C, Alberola-Lopez C, Fichtinger G, eds. Medical Image Computing and Computer Assisted Intervention – MICCAI 2018. Lecture Notes in Computer Science vol 11071. Cham: Springer; 2018. [Google Scholar]
- [50].Kong B, Zhan Y, Shin M, et al. Recognizing end-diastole and end-systole frames via deep temporal regression network. In: Ourselin S, Joskowicz L, Sabuncu M, Unal G, Wells W, eds. Medical image computing and computer-assisted intervention–MICCAI 2016. Lecture Notes in Computer Science, vol 9902. Cham: Springer; 2016. [Google Scholar]
- [51].Wang Q, Li Q, Mi R, et al. Radiomics nomogram building from multiparametric MRI to predict grade in patients with glioma: a cohort study. J Magn Reson Imaging 2018. [DOI] [PubMed] [Google Scholar]


