Abstract
The prevalence of low vision has increased in China especially among youth population, which is an important public health issue. The trend on the prevalence of subnormal visual acuity and updated information is essential to quantify health effects and to prompt decision makers to prioritize action and assess the effectiveness of measures. Therefore, the study aimed to analyze the prevalence and geographical distribution of visual acuity level among young men in China based on 3 national cross-sectional surveys from 1974 to 2012.
The data on visual acuity of young men were collected from 3 national surveys among military recruit youth conducted in 1974, 2001, and 2012 by using a stratified cluster sampling method in China. The prevalence of visual acuity among military recruit youth during this period was analyzed by region, year, age, and economic level.
A total of 139,929, 72,894, and 58,106 young men were included, covering all 31 provinces of mainland of China, from the 3 national surveys respectively. The prevalence of subnormal visual acuity had geographic diversity and increased significantly from 1974 to 2012 (P < .05). The visual acuity level was negatively correlated with the age (17–23 years) in 2012 (P < .05). Furthermore, the prevalence of subnormal visual acuity was positively correlated with the gross domestic product in 31 provinces of China (P ≤ .001).
The prevalence of subnormal visual acuity increased with economic development among young men from 1974 to 2012, with distinct variation among geographic areas in China. Furthermore, subnormal visual acuity was increasingly prevalent with age and warrant public health attention.
Keywords: geographical regions, population-based survey, prevalence, visual acuity
1. Introduction
Visual impairment has become a global challenge, especially for developing countries.[1,2] In recent decades, the prevalence of low vision has increased in China especially among youth population, and the continuing increase in the prevalence of myopia has become an important public health issue.[1] The subnormal visual acuity has serious effects not only on a person's mentality and physicality but also on their capability of learning and solving problems, as well as activities of daily living, obtaining employment, and the quality of life.
With the remarkable economy and lifestyle change in China, people's living condition has been greatly improved. However, the popularity of electronics and electronic entertainment also lead to a general decline of visual acuity.[3,4] Furthermore, the increasing learning burden among students and the unhealthy lifestyles have aggravated the prevalence of subnormal visual acuity especially among youth population. Population-based health studies are indispensable to the understanding of the prevalence and causes of disease, and the findings often direct medical research priorities and inform evidence-based policy on resource allocation.[5] However, most of the existing studies were conducted in local regions with limited sample size, which could not provide sufficient information on subnormal visual acuity in China.[6] Therefore, updated information and trends on the prevalence of subnormal visual acuity are essential to quantify health effects and to prompt decision makers to prioritize action and assess the effectiveness of measures. The study aimed to analyze the characteristics and trends of visual acuity level, and their relationship to economic level among young men in China based on the examination data from a series of national surveys from 1974 to 2012, and to provide evidence for disease control and prevention and highlight important implications for policy making.
2. Methods
2.1. Data source and participants
Candidates for military service were recruited for the 3 national surveys conducted in November 1974, 2001, and 2012 in China. The surveys employed a stratified cluster sampling method to select locations among counties or cantons in mainland of China. According to population, geography, and local economy, several counties or cantons in each selected province were designated as sampling locations. This strategy resulted in the coverage of all provinces, autonomous regions, and municipalities in China except the Hong Kong Special Administrative Region, Macao Special Administrative Region, and Taiwan.
The data of the participants were excluded from the study if they were of minority (non-Han) nationality, female, or disabled. Except for the analysis of the relationship between age and visual acuity level using 2012 data, participants aged <18 years and >21 years were also excluded from the analysis to make the age range concordant with the 1974 survey for comparison purposes. The Ethics Committee of the Air Force Medical University (Fourth Military Medical University) approved this study, and all participants provided informed consent prior to study participation. Furthermore, all methods were performed in accordance with the relevant guidelines and regulations.
2.2. Examination indicators
The investigators included medical researchers, physicians, nurses, and technicians who were trained to use uniform training documents prior to the survey. In each survey location, each staff has been allocated for the measurement or examination of a specific item. The visual acuity was measured using a logarithm of the minimum angle of resolution (logMAR) chart by ophthalmologists, which is the “gold standard” by which the outcomes of the vast majority of clinical trials or interventions were assessed, and each eye was measured separately (using the Standard for Logarithmic Visual Acuity Charts, GB 11533-1989, GB/T 11533-2011 of the Standardization Administration of the People's Republic of China).[7–9]
Examinations were conducted in a well-lit bright locale, with no direct sunlight or shadows. All the results used the uncorrected visual acuity (UCVA). The subnormal visual acuity was defined as binocular visual acuity under 1.0. All measurement data were recorded in field and ultimately transferred to the study center.[9–12]
2.3. Gross domestic product
To address the relationship between UCVA and gross domestic product (GDP), data on average GDP per person in each province or autonomous region and municipality were obtained from China's statistical yearbook.[13]
2.4. Statistical analysis
The EpiData 3.1 (EpiData Association, Odense, Denmark) was used for data entry and management, and the SPSS 17.0 for Windows (SPSS Inc, Chicago, IL) was used for statistical analyses. The Chi-squared test and the analysis of variance were used for comparison among groups as suitable, and the Spearmen correlation analysis was used to analyze the relationship between the UCVA and age, and between the subnormal visual acuity and GDP after weighting by the population average. A P < .05 was taken to indicate statistical significance.
The data sets generated during and/or analyzed during the present study are available from the corresponding author on reasonable request.
3. Results
In 1974, data were collected from a total of 139,929 participants in 120 selected counties. In 2001, 100 survey points (counties or cities) were selected from all areas in mainland of China and a total of 81,193 participants were included. In 2012, 101 survey points were included, and data were collected from 58,076 young male participants. As for the final analysis, a total of 118,092, 69,776, and 57,969 participants were included from the 3 national surveys, respectively.
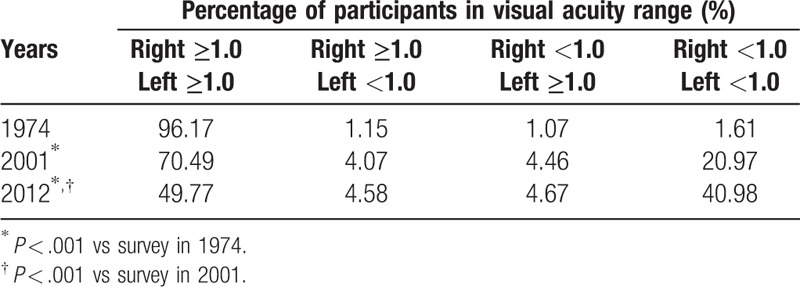
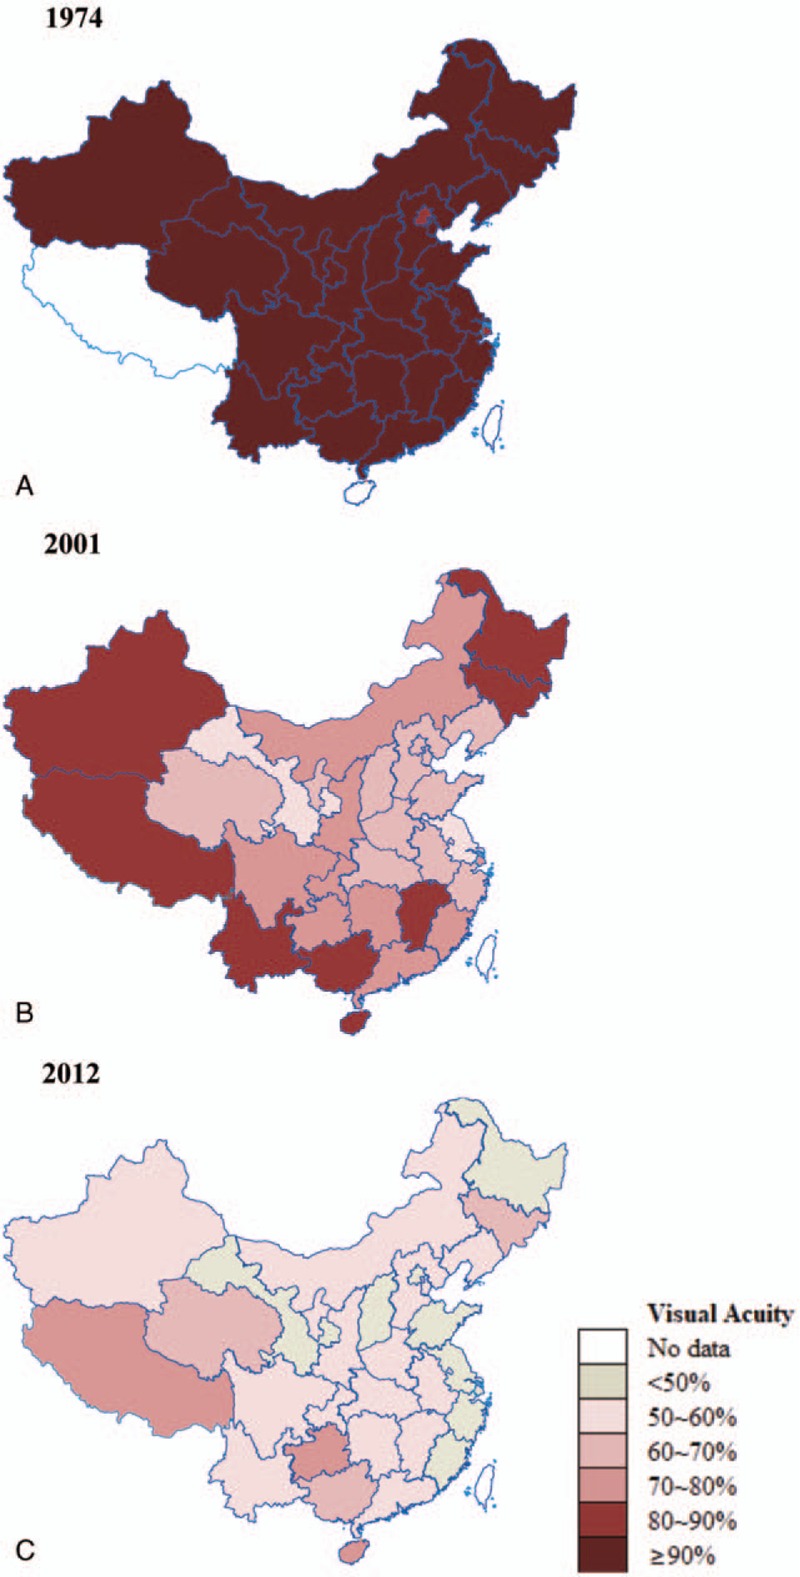
The prevalence of different visual acuity levels among young men had significant difference among the 3 national surveys (P < .001). The percentage of young men with UCVA above 1.0 on both eyes continued to decline from 96.17% in 1974 to only 49.77% in 2012 (Table 1). The UCVA among young men differed among different geographic regions. It was lower in the Eastern and Central areas, such as in Jiangsu Province and in Shanghai City; and higher in the southwestern area, including Guizhou Province and Tibet autonomous regions (Fig. 1).
Table 1.
The visual acuity level distribution in the 3 surveys.

Figure 1.

Percentage of young men with visual acuity of both eyes above 1.0 in the 3 national surveys in China.
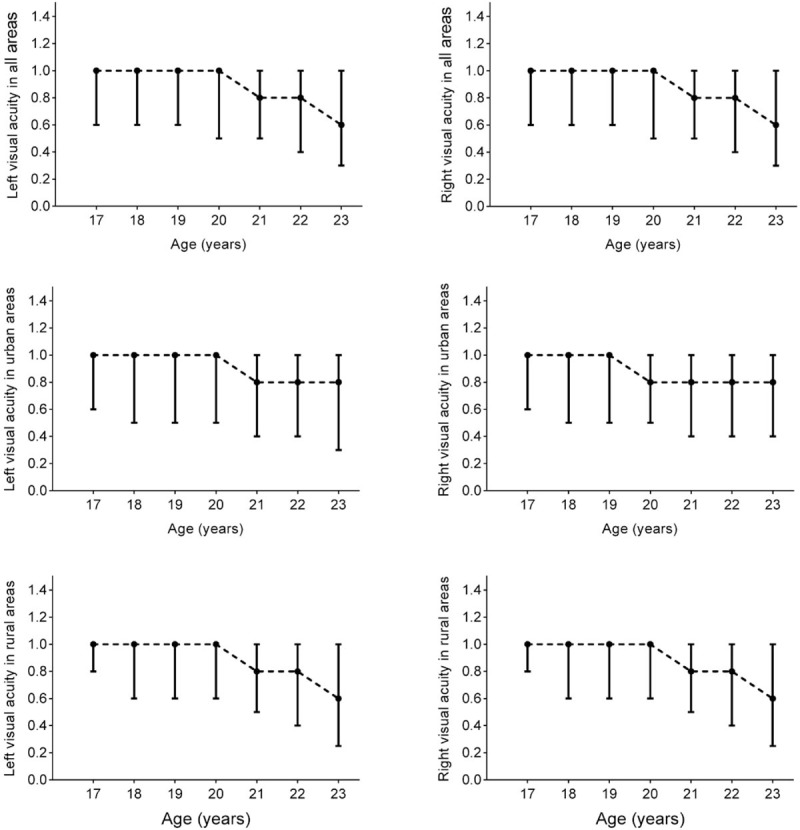
In 2012, significantly negative correlation was found between UCVA and age among young men aged 17 to 23 years in all areas and in rural areas for both left and right eyes (all P < .001), and no statistical difference on visual acuity level was found between the urban and rural areas (P > .05 for both left and right eyes) (Fig. 2). Furthermore, statistical significant difference was found on the UCVA of different educational levels among young men (all P < .05), and the young men with university or above educational levels had lower UCVA than those with senior high school or below educational levels (4.9 ± 0.3 vs 4.8 ± 0.2, P < .001).
Figure 2.

The visual acuity of young men with age of 17 to 23 years in all, urban, and rural areas in the 2012 survey in China. For each age of year, the median with interquartile range of visual acuity was presented. The Spearman correlation analysis showed significant negative correlation between the visual acuity and age among young men in all areas and in rural areas (P < .001 for both left and right eyes). No statistical difference on visual acuity level was found between urban and rural areas (P > .05 for both left and right eyes).
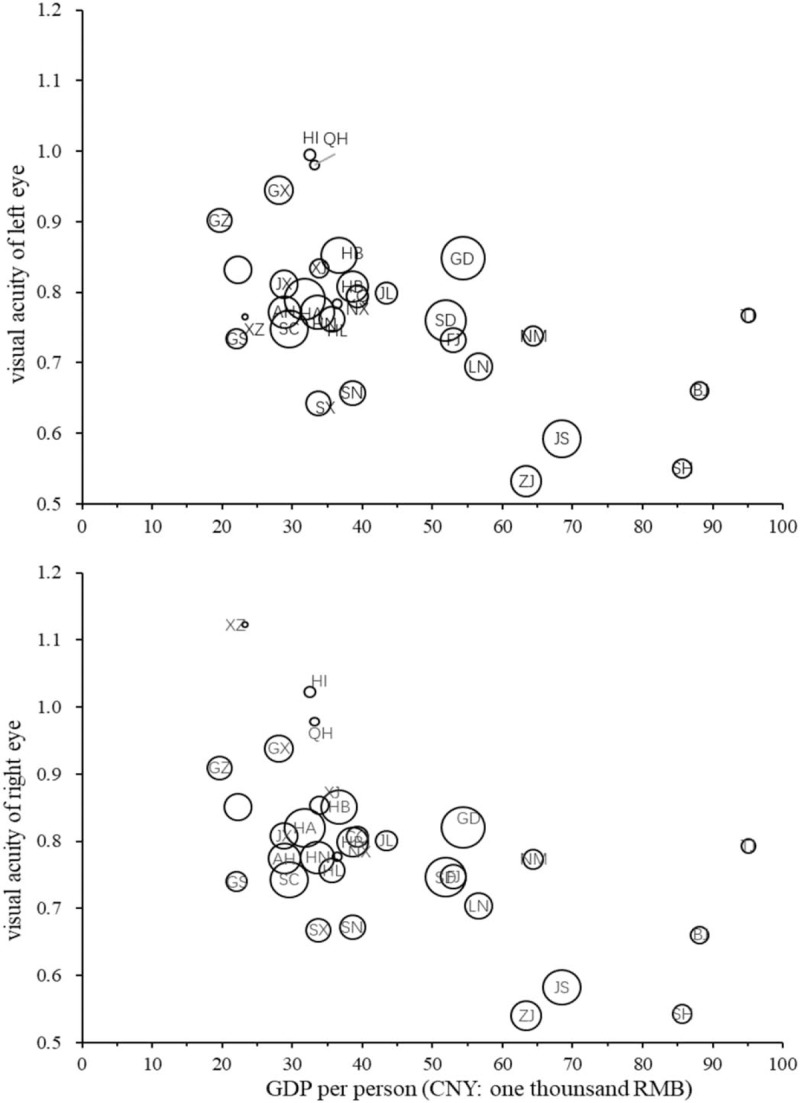
Furthermore, there had significantly negative correlation between the prevalence of normal visual acuity among young men and the average GDP levels among different regions (r = –0.564, P = .001, and r = –0.591, P < .001, for the left and right eyes, respectively) (Fig. 3).
Figure 3.

Relationships between the visual acuity and the GDP in 2012. Correlation coefficients between the visual acuity and the GDP in 2012 (weighted by population average) are r = –0.564 (P = .001) and r = –0.591 (P < .001), for the left and right eyes, respectively. BJ = Beijing, CQ = Chongqing, FJ = Fujian, GD = Guangdong, GDP = gross domestic product, GS = Gansu, GX = Guangxi, GZ = Guizhou, HA = Henan, HB = Hubei, HE = Hebei, HI = Hainan, HL = Heilong-Heilongjiang, HN = Hunan, JL = Jilin, JS = Jiangsu, JX = Jiangxi, LN = Liaoning, NM = Inner Mongolia, NX = Ningxia, QH = Qinghai, SC = Sichuan, SD = Shandong, SH = Shanghai, SN = Shaanxi, SX = Shanxi, TJ = Tianjin, XJ = Xinjiang, XZ = Tibet, YN = Yunnan, ZJ = Zhejiang.
4. Discussion
The study found an overall significantly declining trend on the UCVA level among Chinese young men from 1974 to 2012 at national level, and it was found with diversity among geographic regions in mainland of China. From different geographical regions, the overall vision level of Chinese young men was lower in the coastal and middle areas, and higher in the southwest areas. Analysis of the data of 2012 survey showed that the vision level decreased with age among Chinese young men aged 17 to 23 years, and statistical significant difference was found among different educational levels. Furthermore, the prevalence of subnormal visual acuity among young men was significantly negatively correlated with the average GDP levels among different regions.
The results of the study showed the worse trend of the visual acuity level among Chinese young men between 1974 and 2012, and the high prevalence of low visual acuity level would definitely influence their school performance, functioning, physical, and life quality.[3,4]
Although the cause of the reduced visual acuity is divers, it is no more than the genetic and environmental factors, and the latter is the main and common one. Heredity cannot be changed, but environment factors can be improved. The relation between environmental factors and visual acuity had been explored, and these environmental factors primarily focused on education, sight, nourishment, health habit, economic, etc. Studies have demonstrated an age-related loss in visual acuity with increasing age.[14] In 2005, prevalence rates of reduced visual acuity for urban schoolboys aged 7 to 10, 10 to 13, 13 to 16, and 16 to 18 in China were 25.6%, 40.7%, 61.0%, and 74.9%, respectively, and those for rural were 14.0%, 21.9%, 39.1%, and 63.7%, respectively,[15] which were accordant with the results of our study. With the remarkable improvement on economy in China, people's living condition and life standard have been greatly improved. However, it is a common phenomenon that the incidence of myopia among students is gradually increased by the continually tightening lens and the fatigue spasm of the ciliary muscle under the heavy learning load. It would make the eyes overloaded due to the wrong posture of reading, surfing the Internet, watching TV, playing game through electronic devices including Pad or mobile phones, etc, for a long period of time. Furthermore, other factors, such as lack of outdoor activities and physical exercise, also affect the situation. Meanwhile, with the development of society and economy, facing the pressure from the stressful work and life in the competitive society in China today, Chinese young men were more likely to neglect their eye problems, which may also result in the higher risk of subnormal visual level.[16] Except for showing the characteristics and the worse trend of the visual acuity level among Chinese youth, it is important to raise public awareness on eye health care, and the centers for disease control and prevention and related departments should focus on strategies development and take actions to effectively prevent the deteriorated situation and improve visual acuity outcomes.
A markedly geographic heterogeneity on the prevalence of subnormal visual acuity was showed among the eastern coastal areas, central, and western areas in China. Furthermore, the results confirmed the existence of negative correlation relationship between economy development and the prevalence of normal visual acuity across the 31 provinces, autonomous regions, and municipalities in mainland of China. It presented similar results as a study in Shanghai of China and others from Asian countries, which showed a high myopia prevalence and much of the vision impairment was likely to be due to myopia.[17–19] Studies had showed that by 2050, nearly 10% of the global population will have high myopia with the prevalence being much higher in Asian countries.[20] In addition, the prevalence of high myopia is already high in many parts of Asia and is one of the leading causes of vision impairment and blindness in adults.[21–24]
The study also had several limitations. Firstly, the study data were collected from the 3 examination surveys conducted between 1974 and 2012, and many factors influencing results might not be the same over this long-time span. However, all 3 surveys were conducted by a stable academic study team. Furthermore, the survey design and procedure, including sampling method, outcome measurement, and data collection, were kept consistent to the greatest extent possible overtime, facilitating the comparison of results. Secondly, the regions of participants were not completely consistent in 3 surveys, which may have produced results that deviate slightly from the real values. In 1974, data were collected from a total of 139,929 candidates in 120 selected points. The summarized data instead of the original examination data of the 1974 survey were available due to the long period of time. However, the estimation was based on a large sample, and this potential deviation was small enough to be ignored; hence, the result can be considered acceptable for use in the present study. Furthermore, in the study, the subjects were military recruit male youth, as for the proportion in urban/rural, they were accordant with those of the whole social youth in China. Therefore, the results could reflect the whole country's visual acuity status of male youth. Regardless of these limitations, the study was based on a large, representative population-based sample covering all provincial areas of mainland of China, which provided a new and broader understanding of low vision across long period of time at the national level for the 1st time.
5. Conclusion
The visual acuity level among Chinese young men decreased significantly with economic development from 1974 to 2012 with distinct variation among geographic regions in China. Furthermore, subnormal visual acuity was increasingly prevalent with age among young men, which warrants attention by general public and policy makers. Public health interventions and evidence-based policy should be considered and made to effectively prevent the deteriorated situation and improve visual acuity outcomes.
Author contributions
All authors contributed to this article. YW, LS, and YYX conceived of the presented idea. All authors participated the surveys. YW, JPZ, NXC, and YC conducted data cleaning and statistical analysis, and modified by LS and YYX. The article was edited by YW and revised by XJ and JQZ. All authors confirmed the final version.
Conceptualization: Yong-Yong Xu, Lei Shang.
Data curation: Yi Wan, Jin-Peng Zhang, Ning-Xu Chen, Yong-Yong Xu, Lei Shang.
Formal analysis: Yi Wan, Jin-Peng Zhang, Ning-Xu Chen, Yang Cao.
Funding acquisition: Yi Wan, Lei Shang.
Investigation: Yi Wan, Lei Shang.
Methodology: Yi Wan, Yong-Yong Xu, Lei Shang.
Project administration: Yong-Yong Xu, Lei Shang.
Resources: Xun Jiang, Jie-qiong Zhang, Ning-Xu Chen, Yang Cao, Yong-Yong Xu, Lei Shang.
Software: Yi Wan, Jin-Peng Zhang, Lei Shang.
Supervision: Yong-Yong Xu, Lei Shang.
Validation: Yi Wan, Lei Shang.
Visualization: Yi Wan.
Writing – original draft: Yi Wan, Jin-Peng Zhang, Ning-Xu Chen.
Writing – review & editing: Yi Wan, Xun Jiang, Jie-qiong Zhang, Yong-Yong Xu, Lei Shang.
Footnotes
Abbreviations: GDP = gross domestic product, logMAR = logarithm of the minimum angle of resolution, UCVA = uncorrected visual acuity.
YW, JX, and JQZ contributed equally to the study.
LS was supported by the National Natural Science Fund of China (no: 81773540) and the Key Research Projects of Shaanxi Province (no: 2017SF-005). YW was supported by the Natural Science Foundation of Shaanxi Province (no: 2017JM7008), and the Boosting Project of Fourth Military Medical University (no: 2016TSB-001). The funders had no role in study design, data collection and analysis, decision to publish, or preparation of the manuscript.
The authors have no conflicts of interest to disclose.
References
- [1].World Health Organization. Universal Eye Health: A Global Action Plan. 2013;Geneva, Switzerland: World Health Organization, 2014-2019. [Google Scholar]
- [2].Xie HL, Xie ZK, Ye J, et al. Analysis of correlative factors and prevalence on China's youth myopia [in Chinese]. Zhonghua Yi Xue Za Zhi 2010;90:439–42. [PubMed] [Google Scholar]
- [3].Tsai DC, Fang SY, Huang N, et al. Myopia development among young schoolchildren: the myopia investigation study in Taipei. Invest Ophthalmol Vis Sci 2016;57:6852–60. [DOI] [PubMed] [Google Scholar]
- [4].Lee SJ, Urm SH, Yu BC, et al. The prevalence of high myopia in 19 year-old men in Busan, Ulsan and Gyeongsangnam-do [in Korean]. J Prev Med Public Health 2011;44:56–64. [DOI] [PubMed] [Google Scholar]
- [5].Gupta N, Kocur I. Chronic eye disease and the WHO Universal Eye Health Global Action Plan 2014-2019. Can J Ophthalmol 2014;49:403–5. [DOI] [PubMed] [Google Scholar]
- [6].Guo C, Wang Z, He P, et al. Prevalence, causes and social factors of visual impairment among Chinese adults: based on a national survey. Int J Environ Res Public Health 2017;14:1034. [DOI] [PMC free article] [PubMed] [Google Scholar]
- [7].Standardization Administration of the People's Republic of China (SAC). Standard for Logarithmic Visual Acuity Charts (GB 11533-1989). Available at: http://www.gb688.cn/bzgk/gb/std_list_type?r=0.07544278490949763&p.p1=1&p.p2=11533&p.p6=11&p.p90=circulation_date&p.p91=desc Accessed November 5, 2016. [Google Scholar]
- [8].Standardization Administration of the People's Republic of China (SAC). Standard for Logarithmic Visual Acuity Charts (GB/T 11533-2011). Available at: http://www.gb688.cn/bzgk/gb/newGbInfo?hcno=A9F9E03A346211223DE34421A85CA1C8 Accessed November 5, 2016. [Google Scholar]
- [9].Hazel CA, Elliott DB. The dependency of logMAR visual acuity measurements on chart design and scoring rule. Optom Vis Sci 2002;79:788–92. [DOI] [PubMed] [Google Scholar]
- [10].Xu Y, Shang L, Pan F, et al. The physical status and secular changes of army recruits in Shaanxi province. Med J Chin People's Liber Army 1998;23:431–4. [Google Scholar]
- [11].Wan Y, Jiang X, He Y, et al. Body mass index of young men in China: results from four national surveys conducted between 1955 and 2012. Medicine (Baltimore) 2016;95:e2829. [DOI] [PMC free article] [PubMed] [Google Scholar]
- [12].Guo Z. Statistical Analysis of the Physical Examination Data of the Candidate for Military Service in 1974. Beijing: Health Bureau; 1974. [Google Scholar]
- [13].National Bureau of Statistics of China. China statistical yearbook 2012. Available at: http://www.stats.gov.cn/tjsj/ndsj/2012/indexch.htm Accessed November 5, 2016. [Google Scholar]
- [14].Foran S, Wang JJ, Rochtchina E, et al. Projected number of Australians with visual impairment in 2000 and 2030. Clin Experiment Ophthalmol 2000;28:143–5. [DOI] [PubMed] [Google Scholar]
- [15].JI C. Secular changes of impaired vision and suspect myopia in Chinese students [in Chinese]. Chin J School Health 2008;29:677–80. [Google Scholar]
- [16].JI C, Lin M. An epidemiological study on the prevalence of eyesight dysfunction in the primary and secondary school students in China [in Chinese]. Chin J School Health 2000;21:208–9. [Google Scholar]
- [17].Sun J, Zhou J, Zhao P, et al. High prevalence of myopia and high myopia in 5060 Chinese university students in Shanghai. Invest Ophthalmol Vis Sci 2012;53:7504–9. [DOI] [PubMed] [Google Scholar]
- [18].Morgan IG, Rose KA. Myopia and ophthalmic. Physiol Opt 2013;33:329–38. [DOI] [PubMed] [Google Scholar]
- [19].Zhang Y, Wang H, Liu J, et al. Prevalence of blindness and low vision: a study in the rural Heilongjiang Province of China. Clin Exp Ophthalmol 2012;40:484–9. [DOI] [PubMed] [Google Scholar]
- [20].Holden BA, Fricke TR, Wilson DA, et al. Global prevalence of myopia and high myopia and temporal trends from 2000 through 2050. Ophthalmology 2016;123:1036–42. [DOI] [PubMed] [Google Scholar]
- [21].Koh V, Yang A, Saw SM, et al. Differences in prevalence of refractive errors in young Asian males in Singapore between 1996-1997 and 2009-2010. Ophthalmic Epidemiol 2014;21:247–55. [DOI] [PubMed] [Google Scholar]
- [22].Jung SK, Lee JH, Kakizaki H, et al. Prevalence of myopia and its association with body stature and educational level in 19-year-old male conscripts in Seoul, South Korea. Invest Ophthalmol Vis Sci 2012;53:5579–83. [DOI] [PubMed] [Google Scholar]
- [23].Iwase A, Araie M, Tomidokoro A, et al. Prevalence and causes of low vision and blindness in a Japanese adult population: the Tajimi Study. Ophthalmology 2006;113:1354–62. [DOI] [PubMed] [Google Scholar]
- [24].Verhoeven VJ, Wong KT, Buitendijk GH, et al. Visual consequences of refractive errors in the general population. Ophthalmology 2015;122:101–9. [DOI] [PubMed] [Google Scholar]


