Abstract
Background
Malignant pleural effusion (MPE) is a common medical problem in lung cancer (LC). Pleural fluid cytology (PFC), chest computed tomography (CCT) and positron emission tomography (PET) findings are helpful as first line approach. The objectives of this study were to evaluate whether there is a correlation between PFC, CCT and PET in patients with MPE due to LC.
Methods
We selected patients from our electronic files. Data of PFC, pleural biopsy (PB), CCT and PET have been recorded and analyzed.
Results
A total of 101 consecutive patients (66 males, 65.3%) with a mean age of 66.2±31 years were selected. Types of LC were adenocarcinoma in 71 patients (70.2%), squamous in 13 (12.8%), small-cell in 12 (11.8%) and large cell in 5 (4.9%). CCT showed nodules in 6 (5.9%), pleural thickening in 8 (7.9%) and both in 17 (16.8%) patients. PFC was positive in 55/91 thoracentesis (60.4%) and 32/52 thoracoscopy (61.5%), while PB in 38/40 performed (95%). PET fixation was found in 32/47 (68%) patients who had MPE at diagnosis. When we associate PFC to CCT and PET findings, the yield in our study becomes 90%. No correlation was observed between CCT findings and PFC (P=0.62) between PFC and PET fixation (P=0.63) or between CCT and PET (P=0.06).
Conclusions
In our cohort of LC patients with MPE, we observed a high sensitivity for PFC, while in most of the cases no findings were observed in CCT. PET had a relative low sensitivity. However, when all 3 methods were combined the yield was 90%.
Keywords: Lung cancer (LC), pleural disease, malignant effusion, positron emission tomography (PET), chest computed tomography (CCT), cytology, thoracoscopy
Introduction
Malignant pleural effusion (MPE) is defined by the presence of malignant cells in the pleural fluid. It is a common medical situation in patients with cancer (1,2). The annual incidence of MPE in the United States (US) is estimated to be greater than 150,000 cases. MPE can be either the inaugural syndrome of the disease or the signs of its progression but the majority are symptomatic (1,3). Usually, Patients with MPE have large pleural effusions (greater than 1,000 cc but less than massive) or moderate-sized effusions (500 to 1,000 mL) (2). The most common causes of MPE are lung (37.5%) and breast tumors (16.8%) (4).
A 2015 study based on 556 patients with lung cancer (LC), has shown that 40% of patients developed PE: 26% at diagnosis and 14% during follow-up. Survival of LC patients with MPE was statistically significant poor compared with those without MPE (median survival of 7.49 vs. 12.65 months) (5).
Pleural fluid cytology (PFC) is the simplest way to diagnose MPE. The examination is considered as being an important investigation in the diagnosis of malignancy. The sensitivity of this test is ranging between 25–87%, according to the primary tumor (3,6). Indeed, adenocarcinomas have the highest rate of accuracy for cytology in MPE, as they desquamate easily (4). Sensitivity of cytological diagnosis of pleural fluid also depends on the quality of the samples, the interest and expertise of the cytopathologist and the preparation technique (7,8). Therefore, thoracoscopy with pleural biopsies (PB) is still considered the gold standard for diagnosis of MPE in patients with good performance status (9).
Chest computed tomography (CCT) is able to image the pleural space (10). Although, pleural nodules, masses and pleural thickening are findings suggestive MPE, they are also frequently seen in non-MPEs such as empyemas and parapneumonic effusions (11). Positron emission tomography (PET) using 18-fluorodeoxyglucose (18-FDG) is usually indicated for the work-up of neoplastic disease extension. Yet, in the case of pleural effusion, it is not generally considered to be accurate in distinguishing malignant from benign effusions because of the great number of false positives due non-malignant inflammatory processes of the pleural cavity, such as empyema, sarcoidosis, or pleurodesis (12).
Overall, management of MPE is difficult. As an initial approach PFC and CCT might be helpful in the diagnosis of pleural metastasis, while PET is usually not indicated. All the above tests proved to be useful in the diagnosis of MPE, yet they do have their limitations and question is raised whether we can improve their diagnostic yield by using an association of these tests. However, little is known about possible combination of PFC, CCT and PET. Therefore, the aim of this study was to evaluate whether there is a correlation between PFC and CCT or PET, by studying a homogenous sample of patients such as LC with pleural effusion, as PFC accuracy depends also on the primary tumor.
Methods
This is a retrospective study including patients admitted at the Department of Pulmonary Medicine and Thoracic Oncology of the University Hospital of Saint Etienne, France from January 2011 to December 2016. We used our electronic files to extract all patients with LC and MPE. One hundred and one consecutive patients with confirmed LC and MPE were extracted from the electronic files. All demographic, clinical data of patients including PFC, PB, CCT and PET were recorded. The diagnosis of LC was confirmed by histological or cytological sampling of the primary or a secondary lesion. The date of initial diagnosis was the date of the first histology or cytology confirming LC. The date of the last follow-up was indicated in the medical record as well as the date of death. The study protocol was approved by the Internal Review Board of the Saint-Etienne University Hospital (IRB no 082018/CHUSTE).
The PFC was prepared and considered positive when the cytologist specified in his report the presence of LC cells (13). We recorded the CCT in relation to the initially reported (within one month) pleural effusion. The CCT was considered suggestive of pleural metastasis, if the radiologist recorded the presence of nodules or pleural masses and/or pleural thickening. If other information was indicated such as pleural inflammation, pleural lesion, or pleural invasion without further details, CCT was reviewed. CCT report was negative if no parietal or visceral pleural lesions were mentioned. We also recorded PET 18-FDG findings from patients at the time of the initial diagnosis of MPE when available. Positive or negative PET was considered as reported by the radiologist, and the standardized uptake values (SUV) were recorded when available.
Median overall survival of our population (n=101; Figure 1) was defined as the median period of all patients between the date of the diagnosis of their lung carcinoma and the date of death or last follow-up. Median overall survival of patients presented with PE at the initial diagnosis of their carcinoma (n=76; Table 1) was defined as the median period between the date of the initial diagnosis of their carcinoma associated to PE and the date of death or last follow-up (treatment naïve patients). Median overall survival of patients developed a PE during the course of the disease (no PE at the initial diagnosis of LC) while they were under treatment and/or follow-up (at follow-up) was defined as the median period between the date of their lung carcinoma diagnosis and the date of death or last follow-up (n=25). Median survival of patients from the date of the appearance of their effusion was defined as the median period between the PE appearance and date of death or last follow-up (n=101). This group includes the 76 patients with presence of PE at initial diagnosis of lung carcinoma and the 25 patients only the period after the appearance of their effusion.
Figure 1.
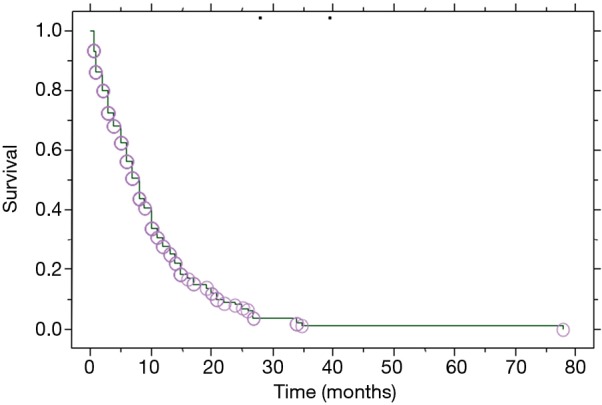
Kaplan-Meier survival curve of all patients (n=101) from the time of diagnosis of their lung carcinoma.
Table 1. Characteristics of the population (n=101).
| Characteristics | Value |
|---|---|
| Mean age [range], years | 66.2 [35–87] |
| Gender, n (%) | |
| Males | 66 (65.3) |
| Females | 35 (34.6) |
| PE, n (%) | |
| At diagnosis of lung carcinoma | 76 (75.2) |
| At follow-up | 25 (24.7) |
| Diagnosis, n (%) | |
| Adenocarcinoma | 71 (70.3) |
| Squamous cell carcinoma | 13 (12.9) |
| Small cell carcinoma | 12 (11.9) |
| Large cell carcinoma | 5 (5.0) |
| Type of intervention, n (%) | |
| Thoracocentesis | 91 (90.1) |
| Cytology + | 55 (54.5) |
| Cytology – | 36 (35.6) |
| Thoracoscopy | 52 (51.5) |
| Cytology + | 32 (31.7) |
| Cytology – | 16 (15.8) |
| Pleural biopsy + | 38 (37.6) |
| Pleural biopsy – | 2 (2.0) |
| CT, n (%) | 32 (31.7) |
| Pleural lesion | 1 (1.0) |
| Pleural thickening | 8 (7.9) |
| Nodule/masse | 6 (5.9) |
| Thickening + nodule/mass | 17 (16.8) |
| PET-FDG | 47 |
| Fixation, n (%) | 32 (68.1) |
| SUV max (mean ± SD) | 6.3±2.5 |
| Stage at diagnosis, n (%) | |
| NSCLC | |
| IV | 78 (86.7) |
| III | 11 (12.2) |
| II | 1 (1.2) |
| SCLC | |
| Localized | 2 (16.7) |
| Diffuse | 10 (83.3) |
| Treatment, n (%) | |
| Chemotherapy | 76 (75.2) |
| Radiation therapy | 22 (21.8) |
| TKIs | 31 (30.7) |
| Surgery | 1 (1.0) |
| None | 20 (19.8) |
| Multiple | 38 (37.6) |
PE, pleural effusion; CT, computed tomography; PET, positron emission tomography; FDG, fluorodeoxyglucose; SUV, standardized uptake values; SD, standard deviation; NSCLC, non-small cell lung cancer; SCLC, small cell lung cancer; TKIs, tyrosine kinase inhibitors
Statistical analysis
Descriptive statistics were used to study patient’s characteristics. Data are expressed as percentage of the total study population, median (range) or mean ± standard deviation (SD) when appropriate. Group comparison was conducted using chi-square (χ2) test for categorical variables and two tailed t-test for continuous variables. The Kaplan-Meier method was employed to determine patients’ survival according to the studied parameters. Statistical significance was determined at P<0.05. All analyses were performed using the StatView® software (Abacus Concepts Inc., Berkeley, Ca, USA).
Results
From our 101 patients, 66 (65.3%) were males and 35 (34.6%) females. Their mean age was 66.2 years ranging from 35 to 87. Smokers were 81 patients (80.1%). The mean consumption of tobacco was 37.4 (range, 1.5–81) pack-years. Histological diagnosis was adenocarcinoma in 71 patients (70.3%), squamous in 13 (12.9%), small-cell in 12 (11.9%) and large cell in 5 (5.0%). At diagnosis, 83 patients (84%) had an advanced disease. Patients’ characteristics are presented in Table 1.
Patients with PE at the initial diagnosis of LC were 76 (75.2%), and 25 (24.8%) developed a PE during disease progression. Median overall survival of our patient population (Table 2) was 8 (range, 0.5–78) months (Figure 1). Median overall survival of patients presented with PE at the initial diagnosis of their carcinoma was 5 (range, 0.5–35) months and median overall survival of patients developed a PE during the course of the disease (at follow-up) was 11 (range, 3–78) months. This difference was statistically significant (P=0.009, Figure 2) (Table 2). Also, the median survival of patients after pleural effusion appearance was significantly better in patients who presented their effusion initially revealing their LC than those who presented the effusion during the course of the disease (respectively 6 and 1 month, P<0.0001) (Table 2; Figure 3). No difference of median survival was observed between males and females, nor between the different tumor histological types, although there is a trend in favor of adenocarcinoma (Table 2). After presenting their pleural effusion, survival was significantly different according to whether (median: 7 months; range, 0.5–35 months) or not (median: 1; range, 0.5–15) patients received chemotherapy (P=0.0003), whether (median: 9 months; range, 0.5–35 months) or not (median: 3; range, 0.5–34) they received tyrosine kinase inhibitors (TKIs) (P=0.0029), but no significant difference was noted whether (median: 5 months; range, 0.5–35 months) or not (median: 5 months; range, 0.5–34 months) they received radiation therapy (P=0.99).
Table 2. Survival of our patients.
| Variables | Survival | P | ||
|---|---|---|---|---|
| Median (months) | Minimum | Maximum | ||
| Overall median (n=101) (Figure 1) | 8 | 0.5 | 78 | |
| Gender | ns | |||
| Overall females (n=35) | 7 | 1 | 78 | |
| Overall males (n=66) | 8 | 0.5 | 34 | |
| Diagnosis | ns | |||
| Overall ADC (n=71) | 8 | 0.5 | 78 | |
| Overall squamous cell carcinoma (n=13) | 5 | 0.5 | 16 | |
| Overall small-cell carcinoma (n=12) | 4.5 | 1 | 17 | |
| PE | ||||
| Overall at follow-up (n=25) | 11 | 3 | 78 | 0.009 (Figure 2) |
| Overall at diagnosis (n=76) | 6 | 0.5 | 35 | |
| Overall from PE appearance (n=101) | 5 | 0.5 | 35 | |
| Overall from PE appearance at diagnosis (n=76) | 6 | 0.5 | 35 | <0.0001 (Figure 3) |
| Overall from PE appearance during follow-up (n=25) | 1 | 0.5 | 13 | |
ADC, adenocarcinoma; PE, pleural effusion; ns, no significance.
Figure 2.
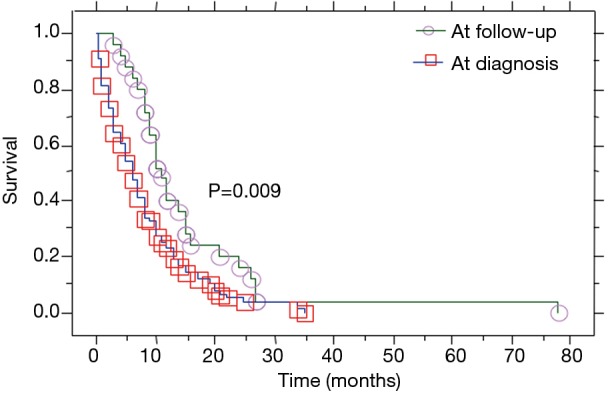
Kaplan-Meier survival curves of all patients presented with PE at diagnosis of their carcinoma versus those who presented their effusion during follow-up.
Figure 3.
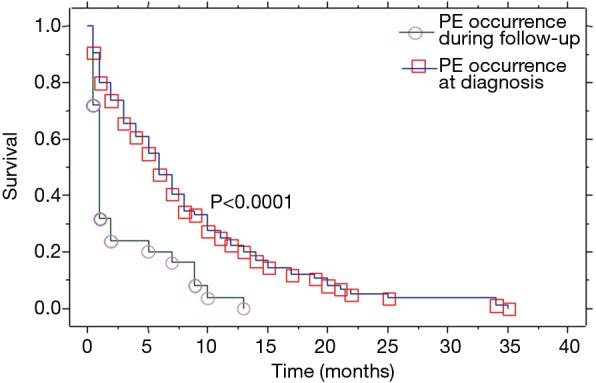
Patients’ survival curves measured only after pleural effusion occurrence: at the time of diagnosis versus follow-up.
PFC was positive in 55 out of 91 (60.4%) thoracentesis and in another 32 patients of 48 who underwent thoracoscopy (66.7%) during which a pleural fluid cytological analysis was asked. Overall, thoracoscopy was performed in 52 patients (51%). From these 52 patients, 40 patients had a PB during thoracoscopy; in 38 patients the biopsies were positive for malignancy (95%).
Findings of CCT were as follow: nodules or masses (Figure 4) were observed in 6 patients (5.9%), pleural thickening (Figure 4) in 8 (7.9%), association of both (nodule, masse and PT) in 17 patients (16.8%) and lesion non-further specified in 1 (1.0%). Interestingly, in 69 patients (68.3%), no lesion was recorded on the CCT. No relationship was observed between CCT findings and PFC post thoracentesis (chi-square =0.25, P=0.61). Also, no relationship was observed between CCT findings and PFC during thoracoscopy (chi-square =0.72, P=0.39) or PB (chi-square =6.01, P=0.49) (Table 3). According to the presence of lesions on CCT, no difference was noted in the median overall survival of patients (6 versus 8 months, P=0.7) nor in the median survival after pleural effusion occurrence (respectively 4 versus 5 months, P=0.2).
Figure 4.
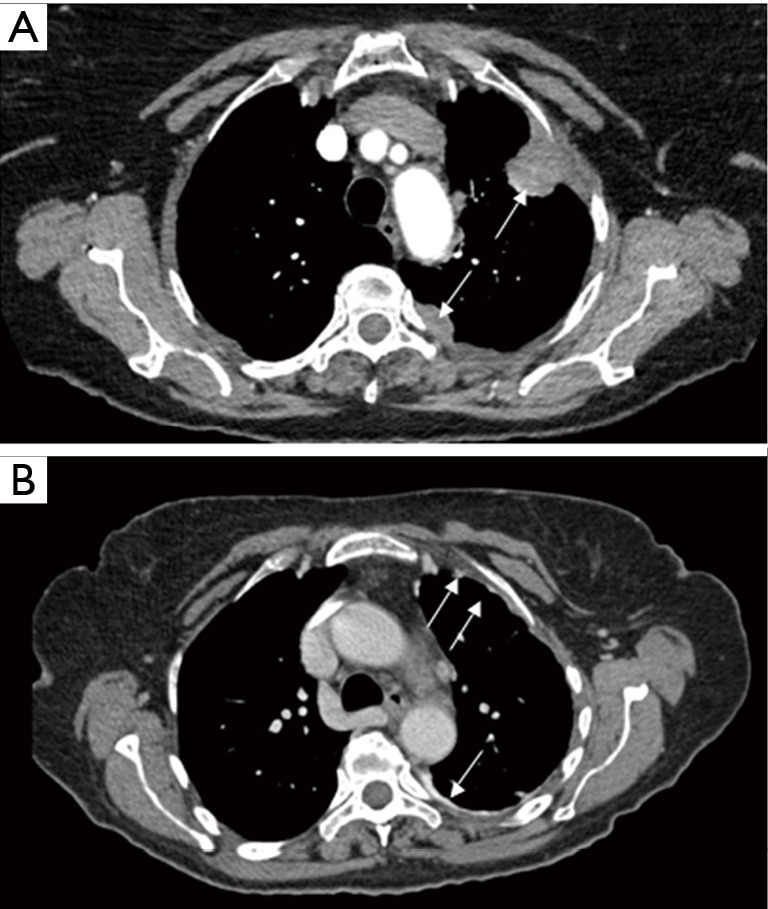
Chest computed tomography of a patient with lung adenocarcinoma showing (A) pleural masses and (B) pleural thickening associated to small nodules.
Table 3. Correlations between the different diagnostic procedures in our study.
| Parameters | χ2 | P value |
|---|---|---|
| PFC (thoracentesis) vs. pleural lesion on CTT | 0.25 | 0.61 |
| PFC (thoracoscopy) vs. pleural lesion on CTT | 0.72 | 0.39 |
| PB vs. pleural lesion on CCT | 6.01 | 0.49 |
| PFC (thoracentesis) vs. fixation on PET-FDG | 0.22 | 0.63 |
| PFC (thoracoscopy) vs. fixation on PET-FDG | 2.6 | 0.26 |
| PF vs. pleural lesion on CCT | 3.51 | 0.06 |
| PB vs. fixation on PET-FDG | 2.5 | 0.11 |
| Histology type vs. fixation on PET-FDG | 2.5 | 0.46 |
PFC, pleural fluid cytology; PB, pleural biopsy; CCT, chest computed tomography; PET-FDG, positron emission tomography using 18-fluorodeoxyglucose.
From the 76 patients who presented a PE at initial diagnosis of their LC, 47 had an FDG-PET for the initial staging of the disease. From those 47 patients 32 (68%) patients had an increased pleural fixation on the PET-FDG (Figure 5) with a mean SUVmax value of 6.3±2.5. No correlation was observed between PFC and PET fixation (chi-square =0.22, P=0.63) or between thoracoscopy cytology and PET fixation (chi-square =2.6, P=0.26). Also, no correlation was observed between the presence or not of lesions on CCT and PET fixation (chi-square =3.51, P=0.06), although there was a trend in favor of the presence of lesions (Table 3). However, this trend was not confirmed when the type of CCT lesions (mass/nodules, thickening or both) were taken in account vs. PET fixation (chi-square =3.1, P=0.21). No difference (P=0.48) in patients’ overall survival was observed according to whether the PET fixed (median =7 months) or not (median =9 months). Considering that thoracoscopy is the gold standard for the diagnosis of MPE, when we associate PFC to CCT and PET findings, the yield in our study becomes 90%. When we added cytology from thoracoscopic fluid the yield became 100%. When PFC was combined to CCT the yield was 75%, when PFC to PET was 84.2% and when CCT to PET 81%.
Figure 5.
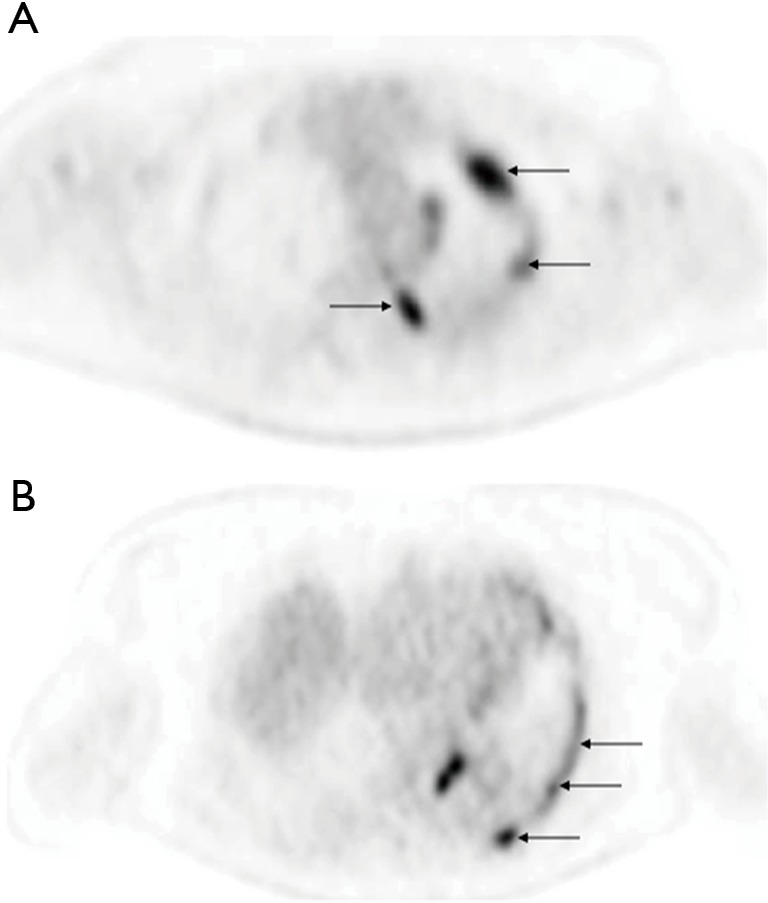
Positron emission tomography of a patient with lung adenocarcinoma showing (A) pleural masses and (B) metastatic pleural thickening associated to nodules.
Discussion
The aim of our study was to improve the management of MPE in patients with LC, using a combination of PFC, CCT and PET-FDG. A possible correlation between PFC and CCT/PET-FDG, may lead to a substitution of other invasive techniques such as thoracoscopy or thoracotomy. Unfortunately, we were unable to show any such correlation. Indeed, according to our results no correlation was found between PFC after thoracentesis or after thoracoscopy and CCT or PET-FDG, nor even between CCT and PET-FDG. However, when we combined these three tests, taking thoracoscopy as the reference examination, the diagnostic yield increased to 90%. This is the first study in the literature comparing these three methods of investigation in LC patients with MPE.
In our study, the sensitivity of PFC was 60.4% of patients. The high rate of the diagnostic yield in our study can be explained by the high rate of adenocarcinomas (70.2%), which, it is well known that desquamate easily in the pleural cavity (14). A recent study showed the same sensitivity of PFC (56%), yet all 163 patients with LC had thoracoscopy with complete exploration of the pleura (15). Swiderek et al. found that sensitivity and negative predictive value (NPV) are better for 60 mL samples than 10 mL samples for direct smear/cytospin. There is no difference of sensitivity and NPV between 60 and 150 mL sample (7). In the study by Garcia et al. (16), the first positive diagnosis was made on the initial specimen (65%), on the second (27%) and on the third (5%). In our study, the majority of cases, patients had at least two thoracenteses.
Findings of CCT investigation with contrast enhancement of the pleural effusion such as thickening, masses, and nodules lead to suspect a diagnosis of malignancy, as well as initial and ongoing management. The British Thoracic Society recommends performing computed tomography in all undiagnosed exudative pleural effusions (12). Malignant pleural mesothelioma (MPM) and metastatic disease appear similar radiologically. However, when a CCT suggests lack of findings, the patient will not have malignancy in only 65% of cases (17). In our study, only 30% of patients had findings suspecting malignancy with CCT. Overall, CCT sensitivity and specificity for MPE as reported by the literature are 68% and 78%, respectively (18). Furthermore, nodular pleural thickening, parietal or mediastinal pleural thickening >1 cm and circumferential pleural thickening have a specificity of respectively 94%, 94%, 88% and 100% (19). The positive predictive value (PPV) of CCT to suspect malignancy is 80% with an NPV of only 65% (18). The low diagnostic yield of CCT in our study can be explained in a part by the fact that it is difficult for a radiologist to describe the pleural space in particular visceral pleura when PE is massive. Majority of MPE are moderate size or massive (2) and PFC are correlated with visceral pleural involvement (15). In addition, the costal parietal pleura is not involved in about 50% of patients with malignant pleural disease (20).
In general, PET FDG is considered to detect earlier tissue involvement than CT, because functional abnormalities may precede morphological changes. Kim et al. showed that pleural uptake on PET images was the most important parameter for identifying MPE of non-small-cell lung cancer (NSCLC), reporting a sensitivity, specificity, PPV, NPV, and accuracy respectively 87.5%, 88.8%, 95.5%, 72.7%, and 87.8% (21). Treglia et al. in a recent meta-analysis of patients with LC indicate that 18F-FDG-PET had a high sensitivity (90%) but a low specificity (78%) in assessing pleural abnormalities (22). However, the published studies, also used for this meta-analysis, are lacking of power due to small number of patients enrolled. Furthermore, some of these studies may have enrolled LC patients with an acute non-malignant inflammatory condition of the pleura and thus specificity was probably due to false positives. Also, it is well known that PET may overlook active pleural disease confirmed by thoracoscopy (23). In our study, 32 patients out of 47 (68%) that have undergone FDG-PET as a part of their initial staging showed a pleural uptake. Indeed, there are several causes of false negative results in patients with malignant disease, due to low tumor metabolic activity by itself, or to the presence of raised serum glucose, as glucose competes with FDG for uptake by the membrane transporter proteins, or to small size pleural lesions (24). Indeed, in our study the majority of cases were adenocarcinomas, that are known to be located more peripheral and having a lower metabolism uptake, which explains the lower mean SUVmax (25). Because of the non-optimal NPV, FDG-PET cannot replace invasive methods in the evaluation of suspected pleural malignant lesions in cancer patients.
The prognosis of patients with LC and MPE is generally poor very much as a metastatic disease with a median survival of 8.5 months (26). Therefore, since the 7th edition of the LC classification (27), the pleural dissemination is upstaged into M1a category (26). Our median overall survival is in agreement with this number. The overall median survival of patients in our study initially without pleural effusion was significantly longer than those presenting initially with an MPE revealing their carcinoma. Also, we confirmed that patients presented with an MPE revealing LC have a longer survival (9) than those with an MPE during their disease progression which is much shorter. Indeed, the latter patients are generally resistant to any treatment (5). Overall, no difference in survival was noted when compared the different histological subtypes. Also, the presence of lesions on CCT or of fixation in PET, were not factors affecting survival in our study. Indeed, other authors confirmed our results in terms of equal survival of the different histological LC subtypes (9) or CCT and PET findings (27).
Our study has limitations, as it is a retrospective one. Ninety-one patients had an initial thoracentesis with PFC. The remaining 10, and the 36 patients with negative pleural cytology at the initial evaluation were finally diagnosed either by cytology and/or biopsy performed during thoracoscopy. However, we cannot exclude a false positive cytology at the initial evaluation, as only 51.4% of our patients underwent thoracoscopy, which is considered to be the gold standard for the diagnosis of malignant pleural disease (28). In our study, although 100% of patients had a CCT performed at the time of the effusion presentation, patients with FDG-PET were only 47 out of the 76 patients presented initially with pleural effusion revealing LC. Due to this, the mismatch between PFC, PET, CCT and thoracoscopy numbers may lead to a likely underpowered statistical analysis. However, at this stage of the disease FDG-PET is not systematically recommended and this was the reason why PET was not performed in all 101 patients. Indeed, in NSCLC patients PET is recommended actually to select patients for surgery in stage I/II and for definitive treatment in stage III (29). Although we showed differences in survival in subgroups of patients, this was also related to the treatment effect and therefore it has to be taken with caution. However, it is accepted that LC patients with metastatic pleural effusion should undergo chemotherapy and/or TKIs in specific indications (29), and our study is in accordance with this statement. Yet, as our study is a retrospective analysis from cases starting at the year of 2011, treatment options have changed according to guidelines modifications.
To conclude, in our study of LC patients with MPE, we observed a high sensitivity for PFC, while in most of the cases no findings were observed in CCT. PET had a relative low sensitivity. Thoracoscopy, according to our results, remains the gold diagnostic standard, as we observed a 95% yield in our patient population. We did not observe any correlation of findings between the 3 methods of investigation, yet these methods are complementary as we were able to diagnose 90% of our patients when PFC was added to CCT and PET findings and 100% of our patients when thoracoscopic fluid cytology was added.
Acknowledgements
None.
Ethical Statement: The study protocol was approved by the Internal Review Board of the Saint-Etienne University Hospital (IRB no 082018/CHUSTE).
Footnotes
Conflicts of Interest: The authors have no conflicts of interest to declare.
References
- 1.Froudarakis ME. Diagnostic work-up of pleural effusions. Respiration 2008;75:4-13. 10.1159/000112221 [DOI] [PubMed] [Google Scholar]
- 2.Chernow B, Sahn SA. Carcinomatous involvement of the pleura: An analysis of 96 patients. Am J Med 1977;63:695-702. 10.1016/0002-9343(77)90154-1 [DOI] [PubMed] [Google Scholar]
- 3.Froudarakis ME. Pleural effusion in lung cancer: more questions than answers. Respiration 2012;83:367-76. 10.1159/000338169 [DOI] [PubMed] [Google Scholar]
- 4.Porcel JM, Esquerda A, Vives M, et al. Etiology of pleural effusions: analysis of more than 3,000 consecutive thoracenteses. Arch Bronconeumol 2014;50:161-5. [DOI] [PubMed] [Google Scholar]
- 5.Porcel JM, Gasol A, Bielsa S, et al. Clinical features and survival of lung cancer patients with pleural effusions. Respirology 2015;20:654-9. 10.1111/resp.12496 [DOI] [PubMed] [Google Scholar]
- 6.Arnold DT, De Fonseka D, Perry S, et al. Investigating Unilateral Pleural Effusions: The role of cytology. Eur Respir J 2018;52:1801254. 10.1183/13993003.01254-2018 [DOI] [PubMed] [Google Scholar]
- 7.Swiderek J, Morcos S, Donthireddy V, et al. Prospective study to determine the volume of pleural fluid required to diagnose malignancy. Chest 2010;137:68-73. 10.1378/chest.09-0641 [DOI] [PubMed] [Google Scholar]
- 8.Thomas SC, Davidson LR, McKean ME. An investigation of adequate volume for the diagnosis of malignancy in pleural fluids. Cytopathology 2011;22:179-83. 10.1111/j.1365-2303.2010.00786.x [DOI] [PubMed] [Google Scholar]
- 9.Anevlavis S, Kouliatsis G, Sotiriou I, et al. Prognostic factors in patients presenting with pleural effusion revealing malignancy. Respiration 2014;87:311-6. 10.1159/000356764 [DOI] [PubMed] [Google Scholar]
- 10.McLoud TC, Flower CD. Imaging the pleura: sonography, CT, and MR imaging. AJR Am J Roentgenol 1991;156:1145-53. 10.2214/ajr.156.6.2028857 [DOI] [PubMed] [Google Scholar]
- 11.Arenas-Jiménez J, Alonso-Charterina S, Sánchez-Payá J, et al. Evaluation of CT findings for diagnosis of pleural effusions. Eur Radiol 2000;10:681-90. 10.1007/s003300050984 [DOI] [PubMed] [Google Scholar]
- 12.Hooper C, Lee YC, Maskell N. Investigation of a unilateral pleural effusion in adults: British Thoracic Society pleural disease guideline 2010. Thorax 2010;65:ii4-17. 10.1136/thx.2010.136978 [DOI] [PubMed] [Google Scholar]
- 13.Piaton E, Vancina S, Cottier M. Immunocytochemistry in malignant serous effusions. Ann Pathol 2006;26:327-31. 10.1016/S0242-6498(06)70736-2 [DOI] [PubMed] [Google Scholar]
- 14.Riquet M, Badoual C, Le Pimpec Barthes F, et al. Visceral pleura invasion and pleural lavage tumor cytology by lung cancer: a prospective appraisal. Ann Thorac Surg 2003;75:353-5. 10.1016/S0003-4975(02)04403-X [DOI] [PubMed] [Google Scholar]
- 15.Froudarakis ME, Plojoux J, Kaspi E, et al. Positive pleural cytology is an indicator for visceral pleural invasion in metastatic pleural effusions. Clin Respir J 2018;12:1011-6. 10.1111/crj.12619 [DOI] [PubMed] [Google Scholar]
- 16.Garcia LW, Ducatman BS, Wang HH. The value of multiple fluid specimens in the cytological diagnosis of malignancy. Mod Pathol 1994;7:665-8. [PubMed] [Google Scholar]
- 17.Hallifax RJ, Talwar A, Rahman NM. The role of computed tomography in assessing pleural malignancy prior to thoracoscopy. Curr Opin Pulm Med 2015;21:368-71. 10.1097/MCP.0000000000000175 [DOI] [PubMed] [Google Scholar]
- 18.Hallifax RJ, Haris M, Corcoran JP, et al. Role of CT in assessing pleural malignancy prior to thoracoscopy. Thorax 2015;70:192-3. 10.1136/thoraxjnl-2014-206054 [DOI] [PubMed] [Google Scholar]
- 19.Leung AN, Müller NL, Miller RR. CT in differential diagnosis of diffuse pleural disease. AJR Am J Roentgenol 1990;154:487-92. 10.2214/ajr.154.3.2106209 [DOI] [PubMed] [Google Scholar]
- 20.Canto A, Rivas J, Saumench J, et al. Points to consider when choosing a biopsy method in cases of pleurisy of unknown origin. Chest 1983;84:176-9. [DOI] [PubMed] [Google Scholar]
- 21.Kim BS, Kim IJ, Kim SJ, et al. Predictive value of F-18 FDG PET/CT for malignant pleural effusion in non-small cell lung cancer patients: Onkologie 2011;34:298-303. [DOI] [PubMed] [Google Scholar]
- 22.Treglia G, Sadeghi R, Annunziata S, et al. Diagnostic performance of Fluorine-18-Fluorodeoxyglucose positron emission tomography in the assessment of pleural abnormalities in cancer patients: A systematic review and a meta-analysis. Lung Cancer 2014;83:1-7. 10.1016/j.lungcan.2013.11.002 [DOI] [PubMed] [Google Scholar]
- 23.Pinelli V, Roca E, Lucchini S, et al. Positron Emission Tomography/Computed Tomography for the Pleural Staging of Malignant Pleural Mesothelioma: How Accurate Is It? Respiration 2015;89:558-64. 10.1159/000381922 [DOI] [PubMed] [Google Scholar]
- 24.Roca E, Laroumagne S, Vandemoortele T, et al. 18F-fluoro-2-deoxy-d-glucose positron emission tomography/computed tomography fused imaging in malignant mesothelioma patients: Looking from outside is not enough. Lung Cancer 2013;79:187-90. 10.1016/j.lungcan.2012.10.017 [DOI] [PubMed] [Google Scholar]
- 25.Ito R, Iwano S, Kishimoto M, et al. Correlation between FDG-PET/CT findings and solid type non-small cell cancer prognostic factors: are there differences between adenocarcinoma and squamous cell carcinoma? Ann Nucl Med 2015;29:897-905. 10.1007/s12149-015-1025-z [DOI] [PubMed] [Google Scholar]
- 26.Goldstraw P, Crowley J, Chansky K, et al. The IASLC Lung Cancer Staging Project: proposals for the revision of the TNM stage groupings in the forthcoming (seventh) edition of the TNM Classification of malignant tumours. J Thorac Oncol 2007;2:706-14. 10.1097/JTO.0b013e31812f3c1a [DOI] [PubMed] [Google Scholar]
- 27.Francis R, Segard T, Morandeau L. Novel molecular imaging in lung and pleural diseases. Respirology 2011;16:1173-88. 10.1111/j.1440-1843.2011.02059.x [DOI] [PubMed] [Google Scholar]
- 28.Rodríguez-Panadero F. Medical Thoracoscopy. Respiration 2008;76:363-72. 10.1159/000158545 [DOI] [PubMed] [Google Scholar]
- 29.Postmus PE, Kerr KM, Oudkerk M, et al. Early and locally advanced non-small-cell lung cancer (NSCLC): ESMO Clinical Practice Guidelines for diagnosis, treatment and follow-up. Ann Oncol 2017;28:iv1-21. 10.1093/annonc/mdx222 [DOI] [PubMed] [Google Scholar]


