

Abstract
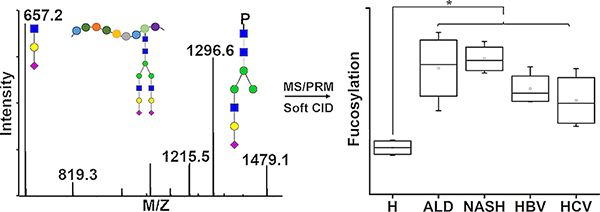
Sex-hormone-binding globulin (SHBG) is a liver-secreted glycoprotein and a major regulator of steroid distribution. It has been reported that the serum concentration of SHBG changes in liver disease. To explore the involvement of SHBG in liver disease of different etiologies in greater detail, we developed a sensitive and selective liquid chromatography–mass spectrometry parallel reaction monitoring workflow to achieve quantitative analysis of SHBG glycosylation micro heterogeneity. The method uses energy-optimized “soft” fragmentation to extract informative Y ions for maximal coverage of glycoforms and their quantitative comparisons. A total of 15 N-glycoforms of two N-glycosites and 3 O-glycoforms of 1 O-glycosite of this low-abundance serum protein were simultaneously analyzed in the complex samples. At the same time, we were able to partially resolve linkage isoforms of the fucosylated glycoforms and to identify and quantify SHBG N-glycoforms that were not previously reported. The results show that both core and outer-arm fucosylation of the N-glycoforms increases with liver cirrhosis but that a further increase of fucosylation is not observed with hepatocellular carcinoma (HCC). In contrast, the α-2–6 sialylated glycoform of the O-glycopeptide of SHBG increases in liver cirrhosis, and a significant 2-fold further increase is observed in HCC. In general, we do not find a significant contribution of different liver disease etiologies to the observed changes in glycosylation; however, elevation of the newly reported HexNAc(4)Hex(6) N-glycoform is associated with alcoholic liver disease.
Keywords: Glycoproteomics, SHBG, glycosylation, fucosylation, liver disease
Graphical Abstract
INTRODUCTION
Glycosylation is a common post-translational modification that regulates many biological processes including protein folding, stability, immune response, and receptor activation.1,2 The involvement of glycosylation of proteins in various diseases including cancer has been demonstrated,1 and the alteration of glycosylation pathways in the progression of liver disease of various etiologies to hepatocellular cancer is under investigation in multiple laboratories.3–6 Changes in the fucosylation,6–9 branching,10,11 galactosylation,12 or bisected N-glycosylation13 as well as the increased sialylation of mucin-type O-glycans in liver disease14 are well-documented. However, lack of accurate and robust mass spectrometric (MS) methods for sensitive quantification of the site-specific glycoforms still limits the exploration of liver diseases.
Sex-hormone-binding globulin (SHBG) is a serum glycoprotein secreted mainly by the liver. It binds sex hormones with high affinity and regulates their bioavailability.15 Liver diseases are associated with altered concentration of sex hormones in serum, which is, in part, caused by altered production of SHBG. The concentration of SHBG in serum was found to be elevated in liver cirrhosis independent of the etiology.15–18 In addition, SHBG is a glycoprotein that contains both N- and mucin-type O-glycosylation.15 Glycosylation of SHBG does not affect steroid hormone binding,19 but the impact of the O-glycosylation of SHBG on cellular signaling was reported.20,21 Even though the function of the N-glycans is not fully understood, Terasaki et al. suggested that aberrant glycosylation of SHBG is responsible for its elevation in cirrhosis,22 and Brenta et al. suggested that the higher content ofsialic acid prolongs the half-life of SHBG.23
Quantitative analysis of glycosylation at the glycopepetide level is essential to achieving resolution of microheterogenity of SHBG glycoforms and protein glycosylation in general. However, the microheterogeneous glycopeptides are substoi-chiometric compared with peptides and can have lower ionization efficiency, which introduces analytical challenges.24 Selective enrichment of glycopeptides from complex sample is often applied prior to mass spectrometric analysis to increase the abundance of the glycopeptides.25–27 However, the information on protein concentration or site occupancy can be lost during the enrichment process. Selected reaction monitoring (SRM) workflows are commonly used for the quantification of proteins due to their high sensitivity and specificity. We9,28 and others29–33 have shown that SRM can be optimized for the quantification of glycopeptides, especially in samples of reduced complexity. More recently, parallel reaction monitoring (PRM) was introduced as a quantitative workflow for the analysis of peptides on high-resolution mass analyzers,34,35 but we are not aware of any applications of the PRM workflows to glycopeptides. Our recent work suggests that adjusted collision induced dissociation (CID) conditions improve the quantification of glycopeptides36 and allow the analysis of glycopeptides by data-independent methods.7 In this study, we show that the combination of optimized CID conditions with liquid chromatography–mass spectrometry PRM (LC–MS PRM) allows the simultaneous quantitative characterization of the N- and O-glycosylation of SHBG, in one chromatographic run, with high sensitivity and specificity. The optimized method was applied to a pilot study of the glycosylation changes in liver disease of various etiologies.
EXPERIMENTAL PROCEDURES
Chemicals and Reagents
SHBG purified from human serum was purchased from Lee Biosolutions (Maryland Heights, MO). Dithiothreitol (DTT) and all of the solvents of LC–MS grade were obtained from ThermoFisher Scientific (Waltham, MA). Iodoacetamide (IAA) was from MP Biomedicals (Santa Ana, CA). Trypsin Gold (V5280) and ProteaseMax (V2071) were from Promega (Madison, WI). Rapigest SF was from Waters (Milford, MA). α-2–3,6,8,9 Neuraminidase A (P0722), α-2–3 neuraminidase (P0743), α-1–2 fucosidase (P0724), α-1–3,4 fucosidase (P0769), and digestion buffers were from New England Biolabs (Ipswitch, MA). All other chemicals were obtained from Sigma-Aldrich (Saint Louis, MO).
Study Population
We compared SHBG glycoforms in the serum of healthy controls, cirrhotic patients of hepatitis C (HCV), hepatitis B (HBV), alcoholic (ALD), and nonalcoholic steatohepatitis (NASH) etiologies and patients with hepatocellular carcinoma. All of the participants were recruited under protocols approved by the Georgetown University Institutional Review Board. Serum was isolated within 6 h of blood collection, aliquoted, and stored at −80 °C until use. To evaluate the performance of the method on liver disease of different etiologies, we created two pooled samples for each disease category, and each pool represents five subjects except for one sample from HBV, which contains the serum from four subjects. All of the pools were age-matched and had a comparable degree of liver damage, as measured by the model for end-stage liver disease (MELD) score (Table S1).
Serum SHBG Concentration Measurement by ELISA
Concentration of SHBG in serum was determnined by ELISA using monoclonal antihuman SHBG antibodies developed in Dr. John G. Lewis’s Steroid & Immunobiochemistry Laboratory of Canterbury Health Laboratories, Christchurch, New Zealand.37 Experiments were carried out at room temperature. In brief, each well of a microtiter plate (96) was coated with 100 μL of protein A purified mouse monoclonal antihuman IgG2a SHBG antibody 11F11 (1 μg/mL) in phosphate-buffered saline (10 mM PBS solution, pH 7.4) overnight. The following day, the plate was washed by PBST (0.05% Tween-20 in PBS) four times and blocked with reagent diluent (R&D Systems, Minneapolis, MN) for 1 h. The plate was then washed as described above, and SHBG standard or diluted serum samples in RDBT (reagent diluent containing 0.01% Tween-20) were added for a 2 h incubation. After washing in the same manner, 100 μL of a second SHBG mouse monoclonal IgG1 antibody (hybridoma supernatant), 7H9, diluted 1:20 in RDBT, was added to each well and incubated for 1 h. The plate was washed again, and 100 μL of goat biotinylated anti-mouse IgG1 antibody (Jackson Immunoresearch, West Grove, PA) diluted in RDBT (1:50 000) was added to each well for another 1h incubation. A total of 100 μL of strepavidin horseradish peroxidase (R&D Systems, Minneapolis, MN) diluted 1:200 in RDBT was then added to each well after another washing procedure. After 40 min of incubation, the plate was washed again, and each well was supplemented with 100 μL of freshly prepared substrate solution containing tetramethylbenzidine and hydrogen peroxide. The mixture was incubated for 30 min, and the colorimetric development was quenched by adding 50 μL of a 2N sulfuric acid solution to each well. The absorbance at 450 nm was recorded with 600 nm as a reference.
Immunoaffinity Enrichment of SHBG from Human Serum
SHBG was enriched from human serum on a resin conjugated to 11F11 anti-SHBG antibody.37 An aliquot of serum (100 μL) was diluted with 500 μL of phosphate buffer (0.1 M disodium hydrogen phosphate containing 0.15 M NaCl, pH 7.0) and incubated overnight at 4 °C in a Pierce spin column (Rockford, IL) packed with 40 μL of the anti-SHBG resin. The column was washed three times with 0.5 mL of phosphate buffer followed by one washing with phosphate buffer containing 0.3 M NaCl. Bound SHBG was eluted with 0.1 M glycine (pH 2.5) and neutralized with Tris buffer (1.5 M, pH 8.8) immediately after the elution step. The collected SHBG eluate was further concentrated on an Amicon Ultra centrifugal filter (MWCO 10K, MilliporeSigma, Burlington, MA). Briefly, the filter was pretreated with 500 μL of 50 mM ammonium bicarbonate, and the SHBG eluate was concentrated on the filter to a volume of approximately 50 μL. The retained proteins were further buffer exchanged by three washes into 50 mM ammonium bicarbonate. To improve protein recovery, ProteaseMax surfactant (0.003%) was added to the ammonium bicarbonate buffer in the last wash. The processed samples were stored at −80 °C until further use.
Tryptic Digest and Exoglycosidase Treatment
The samples of enriched SHBG were diluted in 50 mM ammonium bicarbonate buffer, reduced with 5 mM DTT, and alkylated with 15 mM Iodoacetamide, which was quenched by 5 mM DTT. The samples were digested with Trypsin Gold in a Barocycler NEP 2320 (Pressure BioScience, Medford, MA) for 1 h. ProteaseMax surfactant (0.03%) was added to the samples to improve the efficiency of digestion. The digests were frozen at −80 °C for 30 min before centrifugation at 16000g for 10 min to facilitate the removal of the surfactant. The volume of the digested proteins were reduced to approximately 15 μL in a refrigerated centrivap concentrator (Labconco, Kansas City, MO) and subjected to liquid chromatography–tandem mass spectrometry (LC–MS/MS) analysis without further processing.
For the resolution of glycan linkage, tryptic digests were deactivated at 99 °C for 10 min and further treated with α-2–3,6,8,9 neuraminidase A or α-2–3 neuraminidase in GlycoBuffer 1 (50 mM sodium acetate, 5 mM CaCl2, pH 5.5) according to the manufacturer’s instructions. The solutions were acidified to pH 5.5 with 5 mM acetic acid and digested overnight at 37 °C, and the exoglycosidases were deactivated at 70 °C for 10 min. For specific analyses, the deactivated α−2–3,6,8,9 neuraminidase A digests were further treated with α-1–2 and α-1–3,4 fucosidases at 37 °C for another 20 h in the same buffer. The digests were then processed as described above for tryptic digests and analyzed by LC–-MS/MS.
Identification and Quantification of SHBG Clycoforms by LC–MS/MS
We analyzed SHBG standard (Biosolutions) and SHBG enriched from serum to verify the glycoforms selected for quantification (Table 1). The analyses were done on an Orbitrap Fusion Lumos connected to a Dionex 3500 RSLC-nano-LC (Thermo Scientific). Samples were analyzed using a data-dependent mode. The detailed MS and chromatographic conditions are described in the Supporting Information. All subsequent analyses were performed in positive-ion mode on a 6600 TripleToF mass analyzer (AB Sciex, Framingham, MA) coupled with a nanoAcquity chromatographic system (Waters Associates, Milford, MA) consisting of a UPLC 2G Symmetry C18 TRAP column (5 μm, 180 μm × 20 mm) and a BEH C18 300 capillary analytical column (1.7 μm particles, 75 μm X 150 mm). Peptide and glycopeptide separation was achieved by a 5 min trapping and washing step using 99% solvent A (2% acetonitrile containing 0.1% formic acid) at 15 μL/min followed by a 40 min acetonitrile gradient at a flow rate of 0.4 μL/min: 1 min from 1% to 5% solvent B (0.1% formic acid in acetonitrile) and 39 min from 5% to 50% solvent B. A cleaning gradient at a flow rate of 0.4 μL/min (10 min from 1% to 99% solvent B followed by a 10 min of isocratic run at 99% solvent B) followed immediately after the peptide and glycopeptide separation to remove the nonpolar residues of ProteaseMax. Parallel reaction monitoring with soft fragmentation was used for peptide and glycopeptide quantification. The CID conditions (CE) were optimized for each N-glycoform to obtain optimal Y-ion yields for glycopeptide quantification. The MS products of N-glycoforms of LDVDQALNR and SHEIWTHSCPQSPGNGTDASH peptides as well as O-glycoforms of the LRPVLPTQSAHDPPAVHLSNGPGQEPIAVMTFDLTKpep-tide were monitored. The optimized CE for each glycoform is listed in Table S2. Data were acquired on the TripleTOF 6600 system with instrument control and data acquisition performed by the AB Sciex Analyst software (version1.7.1). Q1 resolution was set to “Open”, and the offset drop from unit resolution was 0.2. Ahigh-sensitivity MS/MS mode was used to obtain MS/MS spectra with a resolution of >30 000 (full width at halfmaximum, fwhm), and the accumulation time was set at 0.1 s. A total of 12 samples from the 6 patient groups, as described in the Study Population section, were analyzed in duplicate for each sample.
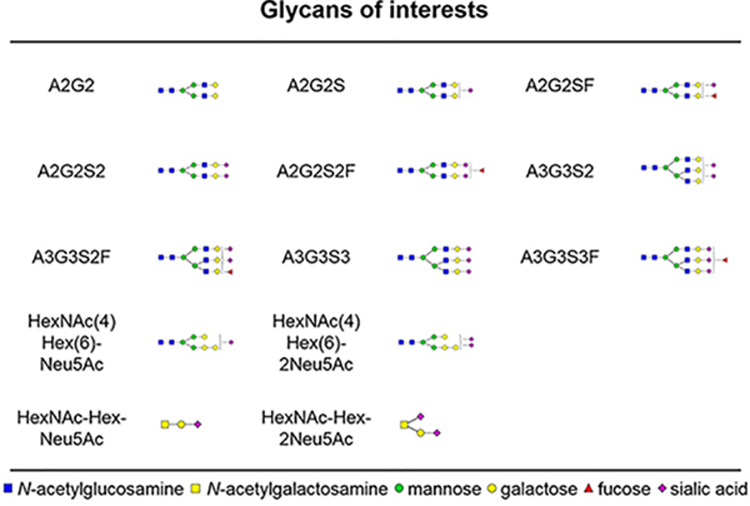
Table 1.
Glycans Associated with the SHBG Protein in Human Serum
 |
Data Processing and Statistical Analysis
LC–MS data were processed by Multi Quant 2.0 software (AB Sciex) with manual confirmation. Peak areas were used for peptide and glycopeptide quantification and data normalization. A selection of specific Y-ions (e.g., loss of one glycan arm) was summed for the quantification of the N-glycopeptides. The summation of specific backbone fragments (y or b ions) was used for the quantification of the O-glycopeptides and the unoccupied peptide. The details of the MSMS transitions used for the quantification of each glycoform are listed in Table S2. Relative intensity of each analyte was calculated by normalizing its peak area to the sum of areas of all targeted peaks at a specific glycosylation site.
One-way analysis of variance (ANOVA) was used to evaluate the difference in the mean percentage of specific glycoforms among the six patient groups. To determine which pairs of groups are different, after we reject the null hypothesis from ANOVA, Bonferroni’s procedure at level 0.05 was performed for multiple testing. All reported p values are two-sided. Statistical analyses were performed under SAS version 9.4 (SAS Institute, Cary, NC). Intrasample variation was evaluated by the relative standard deviation (RSD) of analytes from four replicate analyses of the same sample, and intersample variation was evaluated by RSD of analytes from duplicate analyses of nine independent samples.
RESULTS AND DISCUSSION
Quantification of SHBG Glycoforms by LC/MS-PRM
Recent studies show that targeted quantification by LC–MS PRM methods achieves sensitivity and specificity comparable to SRM while acquiring high-resolution full-scan MS/MS spectra.38 Selected reaction monitoring (SRM) provides high sensitivity and specificity but requires the preselection and optimization of transitions for the targeted analyte. In addition, SRM only monitors the selected transitions, which means that it is harder to identify and resolve background interferences. The post-acquisition selection of fragment ions in PRM facilitates method development and the availabillity of the full spectra allows the efficient control of potential interferences. In addition, analysis of the spectra allows even the discovery of unexpected glycoforms, as we describe below. In this study, we developed a PRM workflow to quantify simultaneously site-specific glycoforms of two N-glycopepides and an O-glycopeptide of SHBG. The list of glycans associated with SHBG and analyzed in our study (Table 1) includes all of the known glycoforms of SHBG39 and a newly described N-glycoform HexNAc(4)Hex(6) identified in the course of our analyses.
Oxonium ions are the main fragments produced from the N-glycopeptides under CID condition typical for the analysis of peptides.40 We have shown recently that energy optimized soft CID conditions allow for the sensitive quantification of N-glycopeptides with improved specificity of detection in complex samples.7 Y-ions carrying the peptide backbone become the major fragments of the N-glycopeptides7 when the collision energy (CE) is lowered to approximately 50% of the optimal CE for peptide fragmentation. We optimized the CE for each N-glycoform of SHBG to maximize the Y-ion responses and the sensitivity of the PRM workflow. In the case of the O-glycoforms, the CE was optimized to maximize the yield of the Y0 ion and peptide fragments. However, the sensitivity of detection was not sufficient even with the optimized CID conditions to allow the reliable quantification of all the low-abundant glycoforms directly in serum because SHBG, in addition to its microheterogeneity, is a low-abundance protein (~40 ppm in serum). We therefore enriched the protein by affinity columns using antihuman SHBG monoclonal antibody 11F11.37 The affinity enriched SHBG is still a complex sample in which SHBG represents approximately 1% of the total protein content. However, the enrichment is sufficient and approximately 2 ng of SHBG (quantified by ELISA) allows the simultaneous detection of all the N- and O-glycoforms of SHBG except for the least abundant A2G2 glycoforms (which is detectable but below LOQin some samples).
The precursor masses and the targeted fragments are listed in Table S2. Because isotopically labeled standards of the glycopeptides are not available, we compared three methods of data normalization: (1) the integrated peak area was normalized to that of the internal peptide, (2) the integrated peak was normalized to the sum of all of the targeted peaks across all peptides, and (3) the integrated peak was normalized to the sum of all targeted peaks at the specific glycosite. To this end, the affinity isolated SHBG from a healthy control was digested and analyzed four times. The integrated peak area of each glycoform was normalized by the three different methods. Our results indicated that the highest reproducibility was achieved by normalizing each glycoform to the sum of all peaks targeted at a specific glycosite. Under these conditions, the average RSD across all glycoforms was 8%, which is comparable to a label-free proteomics quantification method (Figure S1). This data-normalization method was therefore selected for analysis.
A quality control (QC) serum sample was repeatedly used for enrichment and quantification of the SHBG glycoforms (by LC–MS PRM in duplicate) to check the reproducibility of the method. Table S3 summarizes the intra-and intersample reproducibility of the measurement of all glycoforms at the peptide LDVDQALNR. The A3G3S3F of peptide LDVDQALNR is detectable but below LOQin some samples; its intersample RSD was, therefore, not calculated. The average intersample RSD across all glycoforms is 13%, which shows that both affinity isolation and glycoform quantification are reproducible and are not affected by different background in various batches of isolated SHBG. Similar results were obtained for peptide SHEIWTHSCPQSPGNGTDASH. The results show that the reproducibility of quantification of the glycoforms is comparable to the reproducibility of the quantification of the unoccupied LDVDQALNR peptide with the exception of several low-abundance glycoforms, the intensities of which were close to the limit of detection (Table S3). Thus, our LC–MS PRM workflow with optimized “soft” CID achieves reliable quantification of the glycoforms of SHBG in a complex background, as documented in our comparison of its glycoforms in liver disease of various etiologies.
Elevated Serum SHBG in Liver Disease
We first examined the serum SHBG by ELISA in serum of cirrhotic patients with hepatitis B and C viral, alcoholic, and nonalcoholic steatohepatitis etiology as well as HCC patients. Our ELISA results indicate that the production of SHBG in cirrhotic patients significantly increases. Cirrhotic patients (grouped ALD, NASH, HBV, and HCV etiology) had SHBG concentrations that were, on average, 2-fold higher (p < 0.05) than healthy controls and similar to the HCC patients (p = 0.21; Figure S2A). This is consistent with previous reports on the elevation of SHBG in liver disease.15–18 We did not find significant difference among the groups of cirrhotic patients of various etiology; HBV etiology has an overall lower mean but high variability (Figure S2B).
N-Glycosylation Changes of SHBG in Liver Disease
The optimized workflow allowed the quantification of eight N-glycoforms of the peptide SHEIWTHSCPQSPGNGTDASH and seven N-glycoforms of the peptide LDVDQALNR across all the partially enriched samples. Fucosylation, sialylation, and branching status of the glycopeptides of SHBG in cirrhotic and HCC patients were examined. Total fucosylation (sum of all the fucosylated N-glycoforms at a specific peptide) on LDVDQALNR and SHEIWTHSCPQSPGNGTDASH was increased over 1.8-fold (p < 0.05) and 2-fold (p < 0.05), respectively, in both cirrhotic and HCC patients compared with healthy controls (Figure 1A,B). The observed increase in fucosylation was confirmed on all biantennary and triantennary glycoforms at both N-glycosylation sites (Table S4) by further analysis of the ratio of specific fucosylated glycoforms to their corresponding nonfucosylated form. The observed increase of fucosylation in liver cirrhosis is consistent with our results on fucosylation of other liver-secreted proteins.6,7
Figure 1.

Fucosylation and sialylation of SHBG in liver disease. (A, B) Total fucosylation change at the specified peptide. (C) Sialylation change on LDVDQALNR measured as the ratio of A2G2S2F to A2G2SF. (D) Sialylation change on SHEIWTHSCPQSPGNGTDASH measured as the ratio of A3G3S3 + A3G3S3F to A3G3S2 + A3G3S2F. H, healthy control; CIR, cirrhotic patients; HCC, hepatocellular carcinoma patients. Asterisks indicate p < 0.05 by one-way ANOVA with the Bonferroni procedure.
We observed an approximately 2-fold decrease in the sialylation of the fucosylated biantennary N-glycoform of LDVDQALNR (A2G2S2F/A2G2SF, p < 0.05) and the triantennary N-glycoforms of SHEIWTHSCPQSPGNGT-DASH in both cirrhotic and HCC patients compared with the healthy controls (Figure 1C,D). Further analysis of the individual glycoforms revealed that sialylation on both fucosylated (A3G3S3F/A3G3S2F) and nonfucosylated (A3G3S3/A3G3S2) triantennary N-glycoforms of SHEIWTHSCPQSPGNGTDASH was markedly decreased in the cirrhotic and HCC patients (Table S4). We did not observe differences between cirrhotic and HCC patients in the fucosylation or sialylation of the N-glycoforms (Table S4), which implies that liver cirrhosis might be the major contributor to the observed changes. Differences in the sialylation of the glycoforms in healthy and cirrhotic groups at the different glycosylation sites indicates that some of the glycosylation changes are site and glycan specific. A similar degree of branching was observed in the healthy control, cirrhotic, and HCC patients; this was examined as the ratio of the sum of triantennary to the sum of biantennary N-glycoforms (Table S4).
To further investigate whether the changes in fucosylation and sialylation observed in cirrhotic patients are etiology-dependent, we compared the groups of ALD, NASH, HBV, or HCV etiology. Overall, the impact of etiology is relatively minor compared to the change between the healthy and cirrhotic groups. At both N-glycosylation sites, in all the examined etiologies, the summation of all the detected fucosylated glycoforms increased significantly compared to that of the healthy controls (Table S5). Both bi- and triantennary glycoforms showed a clear trend of elevated fucosylation in all the examined etiologies and the increase in fucosylation varies by glycoform and glycosylation site (Table S5). The previously described decreases of sialylation on both N-glycosylation sites were confirmed in all examined etiologies (Table S5). Figure 2 shows the trends in fucosylation (A2G2S2 on LDVDQALNR, Figure 2A; A3G3S2 on SHEIWTHSCPQSPGNGTDASH, Figure 2B) and sialylation (A2G2S2F/A2G2SF on LDVDQALNR, Figure 2C and A3G3S3F/A3G3S2F on SHEIWTHSCPQSPGNGTDASH, Figure 2D). We did not find significant differences among the etiologies, which confirms the previously reported, rather uniform changes in the cirrhotic patients.6,7
Figure 2.

Glycoform-specific fucosylation and sialylation in liver cirrhosis of various etiologies. Comparison of changes in the groups of healthy controls (H) and cirrhosis of ALD, NASH, HBV, and HCV etiologies. (A) Fucosylation change on LDVDQALNR measured as the ratio of A2G2S2F to A2G2S2. (B) Fucosylation change on SHEIWTHSCPQSPGNGTDASH measured as the ratio of A3G3S2F to A3G3S2. (C) Sialylation change of LDVDQALNR measured as the ratio of A2G2S2F to A2G2SF. (D) Sialylation change on SHEIWTHSCPQSPGNGTDASH measured as the ratio of A3G3S3F to A3G3S2F; Asterisks indicate p < 0.05 by one-way ANOVA with the Bonferroni procedure.
Fucose in human N-glycans can be attached to the outer arms by an α−1,2 linkage to galactose (often terminal) or an α−1,3 or α−1,4 linkage to subterminal GlcNAc; it can be also attached by a α−1,6 linkage to the innermost GlcNAc (core fucosylation) based on the activity of specific fucosyltranserases.41 Linkage, especially the core versus outer-arm fucosylation, is a determinant of interactions and activities; it is, therefore, important to assign the fucose linkage. Changes of the linkage-resolved fucosylated glycans in the context of liver disease is an important topic of current research, and several studies quantifying core fucosylation were already published.42,43 Typically, lectin affinity42 or endoglycosidase F (or H) digestion43 were used to achieve quantification of the core fucose. We take advantage of the limited fragmentation of the glycans under soft CID conditions to identify Y-ions specific for core and outer arm linkage; this enables simultaneous quantification of both core and outer-arm fucose, as described below.
We treated the tryptic digest of SHBG with neuraminidase A to remove sialic acid residues with α−2–3,6,8,9 linkage from all the N-glycopeptides. This allowed us to focus on the fucose linkage (outer-arm versus core) of the A2G2F and A3G3F glycoforms of both N-glycopeptides of SHBG at higher sensitivity due to reduction of heterogeneity of the sialo-forms.44,45 We did not resolve the linkage of outer arm fucose (galactose versus subterminal GlcNAc) in this study, a topic of research reserved for future research. Figure 3A shows the MSMS spectrum of A2G2F of LDVDQALNR under optimized soft CID condition. The Y-ion with m/z 1224.03 is one of the major fragments of the N-glycan, which corresponds to the loss of one GlcNAc-Gal arm (selective fragmentation of the Man-GlcNAc bond). Both core and outer-arm fucosylation contribute to the formation of this fragment. Y-ion m/z 1151.01 is the characteristic fragment of outer arm fucosylated glycoforms because it results from the loss of a fucosylated GlcNAc-Gal arm of the N-glycan; the corresponding oxonium ion was detected at m/z 512.20. Rearrangement of fucoses among antennae during the fragmentation has been reported, which means that our fucose linkage assignment needs to be viewed with caution.46 In terms of core fucose, Wuhrer’s46 results and our own data (not published) indicate that the fucose rearrangement between the core and antennae is minimal. Thus, we assume in the current study that the characteristic outer-arm fucosylated glycopeptide fragment results from the outer-arm fucosylation. Fragment 1224.03 has a higher intensity than fragment 1151.01, suggesting that the fucosylated glycopeptide carries both core and outer-arm fucose. To prove this, we used specific outer arm fucosidases to further resolve the linkage isoforms. The desialylated glycopeptide A2G2F of LDVDQALNR was further treated with fucosidase α−1–3,4 and α−1–2 to completely remove the outer arm fucose.44 Based on the specific outer arm signal, the reaction completed with at least 95% efficiency, as shown in Figure 3C (Y-ion) and D (complementary oxonium ion). The fucosylated fragment (Y-ion) detected after the two outer-arm fucosidases (Figure 3B) represents the core-fucosylated glycopeptide. The results show that this glycopeptide carries a mixture of core-and outer-arm-fucosylated glycoforms; similar results were obtained for both peptides (data not shown), and relative quantities of the forms are discussed below.
Figure 3.

Resolution of linkage of the fucosylated glycopeptide LDVDQALNR. (A) MSMS spectrum of the fucosylated biantennary glycoform of LDVDQALNR. (B–D) extracted ion chromatograms (XIC) of the glycopeptide treated with neuraminidase A alone (blue) or neuraminidase A followed by α-1–3,4 and α-1–2 fucosidases (pink). (B) Fucosylated fragmentm/z 1224.03(2+). (C) Nonfucosylated fragment m/z 1151.01.03(2+). (D) Oxonium ion m/z 512.20 (1+) specific for outer-arm fucose. Blue square, GlcNAc; green circle, Man; yellow circle, Gal; red triangle, Fuc.
To determine the degree of core fucosylation, we evaluated the precursor ion intensities with (core fucosylation) and without (total fucosylation) fucosidase treatment. We estimate that the core fucosylated glycopeptide of LDVDQALNR represents 36 ± 3% for A2G2F and 5 ± 1% for A3G3F; core fucosylation represents 36 ± 6% of the A3G3F glycoform of SHEIWTHSCPQSPGNGTDASH. For the determination of the core fucosylation of A2G2F glycoform of SHEIWTHSCPQSPGNGTDASH we have to use calculation from the fragmentation spectra due to repeatedly incomplete outer-arm fucosidase digest (for reasons we could not determine). We estimate the percentage of core fucosylation in A2G2F of SHEIWTHSCPQSPGNGTDASH by subtracting the non fucosylated Y-ion (m/z 1188.15) from fucosylated Y-ion (m/z 1236.84) based on their molar contributions. The estimated core fucose is 72%, outer-arm fucose is 12%, and the remaining 16% is resistant to fucosidase α−1–2 and α−1–3,4 cleavage.
Our results indicate that all of the fucosylated glycoforms of SHBG represent a mixture ofcore and outer-arm fucose and that the degree of core fucosylation varies by glycoform and glycosylation site. We thus further investigated whether the degree of outer arm fucosylation changes in liver disease. Affinity-isolated serum SHBG from healthy and patient donors were digested with trypsin and α−2–3,6,8,9 neuraminidase A, as described above. The ratios of the nonfucosylated Y ion (outer arm specific) to the fucosylated Y-ion of each glycoform was compared among the healthy controls and patients. We do not observe difference in the degree of outer arm fucosylation between healthy controls and cirrhosis or HCC patient groups on the A2G2F and A3G3F of LDVDQALNR and A3G3F of SHEIWTHSCPQSPGNGTDASH (Table S6). Interestingly, there is a trend ofincreased outer arm fucosylation on A2G2F of SHEIWTHSCPQSPGNGTDASH in all patient groups (Table S6). The relative intensity of core (Figure 4A) and outer-arm fucosylation (Figure 4B) (calculated by the molar contribution of the outer arm specific fragments) increases in both cirrhosis [1.5-fold (P < 0.05) and 1.9-fold (P < 0.05), respectively] and HCC patients [1.6-fold (p < 0.05) and 1.9-fold (P < 0.05), respectively] compared with healthy controls. Cirrhosis and HCC patients do not differ in either core or outer-arm fucosylation. The core and outer-arm fucosylation increase to various degrees in all groups of the cirrhosis patients. The highest fold change of core and outer arm fucosylation is found in ALD patients [2.2-fold (P < 0.05) and 1.6-fold (p < 0.05), respectively]; the lowest fold change was detected in the group of cirrhotics with HCV etiology [1.5-fold (P < 0.05) and 1.4-fold (p < 0.05), respectively; Table S6]. The fold change of outer-arm fucosylation in all patient donors on A2G2F of SHEIWTHSCPQSPGNGTDASH is greater than that of core fucosylation, while similar fold changes of these two linkage isoforms are found on all other targeted glycoforms (Table S6). Thus, by resolving the linkage of fucosylation, our results reveal that on this particular glycoform, outer-arm fucosylation is more sensitive than core fucosylation when the response to liver damage is examined. Taken together, our results provide further evidence that the protein glycosylation is site-, glycan-, and linkage-specific; a reliable site-specific quantification method is important to reconstructing the picture of changes in protein glycosylation.
Figure 4.

(A) Core and (B) outer-arm fucosylation of the A2G2F glycoform of SHEIWTHSCPQSPGNGTDASH in liver disease. Serologic measurements in the following groups: H, healthy controls; CIR, cirrhotic patients; HCC, hepatocellular carcinoma patients. Asterisks indicate p < 0.05 by one-way ANOVA with the Bonferroni procedure. Blue square, GlcNAc; green circle, Man; yellow circle, Gal; red triangle, Fuc.
Detection of a Novel Glycoform of SHBG
The LC–MS PRM workflow allows the identification of unexpected glycoforms thanks to the predictable retention time of the glycoforms of the same peptide45 and to the availability of the MS/MS results. We found an unassigned Y-ion with m/z 1232.03 (2+) in the tandem mass spectra of the desialylated glycopeptide m/z 938.07 (3+), which corresponds to the precursor of LDVDQALNR glycopeptide with the glycan composition of HexNAc(4)Hex(6). The retention time of this glycoform is slightly shorter than the A2G2F glycoform of LDVDQALNR. We therefore examined the spectra of the SHBG glycopeptides acquired prior to the neuraminidase A digest and both mono- and di-sialylated forms of the HexNAc(4)Hex(6) glycoforms of both N-glycopeptides of SHBG were identified in the SHBG standard. However, their abundance is low (below our MS1 limit of quantification), which prevents accurate quantitative assessment and is likely the reason why they were not observed previously.39 Based on the fragments and retention time alignment, we propose that the strucure is a complex biantennary N-glycan with an extended arm (Figure 5A).47 The major fragment (loss of an arm at the Man-GlcNAc bond) is consistent with this assignment, and the fragments 1151.00 (2+) and 1069.97 (2+) represent the loss of GlcNAc-Gal-Gal and Man-GlcNAc-Gal-Gal, respectively. The corresponding complementary oxonium ions m/z 528.20 and 690.25 were detected in the low-mass region. The fragment (2+) results from the loss of the GlcNAc-Gal unit (its complementary oxonium ion 366.13 is not visible because we used the mass cutoff at 400 Da). Further confirmation of the structure will require more isolated material. We further examined the amount of this desialylated glycan in cirrhosis of different etiologies. As shown in Figure 5B, for both N-glycopeptides, the desialylated glycoforms increase in alcoholic cirrhosis but not in liver disease of other etiologies, which is one of the few examples of etiology-specific modifications in our study. Additional details of the analysis of this glycoform are listed in Table S6.
Figure 5.

(A) Identification and (B) quantification of the HexNAc(4)Hex(6) N-glycoform of SHBG in cirrhosis of different etiologies. (A) MS/MS spectrum and proposed structure of the HexNAc(4)Hex(6) glycoform of LDVDQALNR. (B) Serologic quantification of the glycoform at both Nglycopeptides of SHBG in healthy controls (H); cirrhosis of ALD, NASH, HBV, and HCV etiologies; and hepatocelular carcinoma (HCC). Asterisks indicate p < 0.05 by one-way ANOVA with the Bonferroni procedure. Blue square, GlcNAc; green circle, Man; yellow circle, Gal.
Increased Sialylation of the O-Glycan of SHBG in Liver Disease
In addition to N-glycoforms, we simultaneously quantified O-glycoforms of the peptide LRPVLPTQSAHDP-PAVHLSNGPGQEPIAVMTFDLTK. The major glycoforms of this peptide are the core 1 mono- (HexNAc-Hex-Neu5Ac) and di- (HexNAc-Hex-2Neu5Ac) sialylated structures.39 To quantify their changes, we determined the ratio of the di- to monosialylated O-glycopeptides, which increases significantly in cirrhotic patients compared to the healthy control (1.8-fold change, p < 0.05) and further increases in HCC patients (2-fold change compared to the cirrhotic group, p < 0.05) (Figure 6A). Analysis of this ratio in different etiology groups revealed that all the groups showed an increasing trend with NASH (2-fold change, p < 0.05) and HCV groups (2.4-fold change, p < 0.05) significantly elevated compared to the healthy control (Figure 6B). Increased sialylation has been described in many cancers;48,49 however, increased disialylation of the T antigen of the O-glycopeptide of SHBG in liver disease is reported, to our knowledge, for the first time. Taken together, our results suggest that liver cirrhosis of HCV etiology increases in the ratio of di- to monosialylated T antigen more than other etiologies and that a further increase accompanies the development of HCC.
Figure 6.

Increased α-2–6 sialylation of the T antigen on the O-glycopeptide of SHBG in liver disease. (A) Ratio of the HexNAc-Hex-2Neu5Ac to HexNAc-Hex-Neu5Ac in pooled serum samples of cirrhotic and HCC patients. (B) Ratio of the HexNAc-Hex-2Neu5Ac to HexNAc-Hex-Neu5Ac in healthy controls (H) and cirrhotic patients of ALD, NASH, HBV, and HCV etiologies. (C–E) XIC of the two glycoforms of peptide LRPVLPTQSAHDPPAVHLSNGPGQEPIAVMTFDLTK before (blue) and after (pink) α-2–3 neuraminidase. (C) HexNAc-Hex, (D) HexNAc-Hex-Neu5Ac, and (E) HexNAc-Hex-2Neu5Ac carrying glycopeptides. Asterisks indicate p < 0.05 by one-way ANOVA with the Bonferroni procedure. Yellow square, GalNAc; yellow circle, Gal; purple rhomboid, Neu5Ac. Pound signs indicate original peptide, and asterisks indicate auto deaminated peptide LRPVLPTQSAHDPPAVHLSDGPGQEPIAVMTFDLTK.
To determine the linkage of the sialylated glycans, we further treated tryptic digest of SHBG with α−2–3 neuraminidase (Figure 6). Without enzymatic desialylation, we observe only HexNAc-Hex-Neu5Ac and HexNAc-Hex-2Neu5Ac as described above (blue line in Figure 6D,E). The appearance of double peaks for each species is due to partial autodeamidation of the peptide backbone, which we account for in the quantitative result (the areas of both peaks were added in the quantitative analysis). When the same sample was treated with α−2–3 neuraminidase, the peak of HexNAc-Hex-2Neu5Ac (RT and 26.6 min, blue line in Figure 6E) disappeared, which indicates that one ofthe sialic acids is connected to the galactose through α−2–3 linkage (pink line in Figure 6E). The detection of the monosialylated glycoform in Figure 6D (RT 25.6 and 25.9 min, pink line) implies that this is the product of enzymatic desialylation ofthe HexNAc-Hex-2Neu5Ac with sialic acid likely linked to GalNAc through an α−2–6 linkage. The nonsialylated peaks (RT 24.8 and 25.2 min, pink line in Figure 6C) appeared after exoglycosidase treatment and come from the removal of α-2–3 sialic acid linked to galactose on HexNAc-Hex-Neu5Ac. The results suggest that the increase in HexNAc-Hex-2Neu5Ac is likely related to α−2–6 sialyation of the GalNAc. In addition, our results indicate that the relative intensity of HexNAc-Hex-Neu5Ac decreases from healthy control to cirrhosis and HCC patients, while that of HexNAc-Hex-2Neu5Ac increases in patient donors (data not shown), suggesting that the increased HexNAc-Hex-2Neu5Ac might result from further sialylation of HexNAc-Hex-Neu5Ac. Among the 6 α−2–6-sialyltransferases (ST6GalNAc I–VI), ST6GalNAc-I and ST6GalNAc-II have been shown to sialylate the T and Tn antigens.50–52 Studies by Marcos and his colleagues50 further demonstrate the primary role of ST6GalNAc-II involved in the sialylation of the T antigen. Thus, the observed elevation of α−2–6 sialylation in our study is likely related to the altered activity of ST6GalNAc-II. Alteration of sialylation is a hallmark of cancer, and hyper-sialylation, along with over-expression, up-regulation, or both, of sialyltransferase activity was described in many cancers.50,53,54 The up-regulation of ST6GalNAc-II is associated with shorter survival in human colorectal carcinomas55 and with the metastasis of breast cancer.56 In the current study, we observed an increase of disialylated T antigen of SHBG in the liver disease progression to HCC. These results suggest a potential prognostic role of sialyltransferase ST6GalNAc-II and disialylated T antigen in the development of HCC.
CONCLUSIONS
We have developed a sensitive LC–MS PRM method for the quantification of N- and O-glycopeptides of SHBG and applied the workflow to a serologic study of SHBG glycoforms in liver disease. We use an optimized “soft” fragmentation technique to extract informative Y-ions for the quantification of the N-glycopeptides. The method achieves the simultaneous quantification of 15 N-glycoforms of two peptides and 3 O-glycoforms of a peptide of this low-abundance (microgram per milliliter) serum protein in a limited amount of the liquid biopsy (25 μL of human serum). At the same time, we achieve partial resolution of linkage isoforms of the fucosylated glycoforms, identify a N-glycoform of SHBG that was not previously reported, and show its increase in cirrhosis of alcoholic etiology. The results show that both core and outer-arm fucosylation increase in liver cirrhosis; however, we do not observe further increase of the fucosylated N-glycoforms of SHBG in HCC. In contrast, the α−2–6 sialylated glycoform of the O-glycopeptide of SHBG increases in liver cirrhosis, and we observe a significant additional 2-fold increase of this glycoform in HCC. In summary, we report for the first time an LC–MS PRM workflow for the simultaneous quantification of the N- and O-glycoforms of SHBG. The workflow allows the quantification of the glycoforms in complex background and has general applicability to glycoforms of other proteins. The site-specific quantitative analysis achieves partial resolution of linkage isoforms with resolved core and outer-arm fucosylation based on specific fragmentation confirmed by exoglycosidase digests.
Supplementary Material
ACKNOWLEDGMENTS
We thank Dr. John G. Lewis, Steroid & Immunobiochemistry Laboratory of Canterbury Health Laboratories, Christchurch, New Zealand for generous gift of the anti-SHBG antibodies. We want to thank Professor Geoffrey L. Hammond, Canada Research Chair in Reproductive Health, Department of Cellular & Physiological Sciences, The University of British Columbia for insightful comments and discussions.
Funding
Research reported in this publication was supported by the Office Of The Director, National Institutes Of Health of the National Institutes of Health under award no. S10OD023557. The content is solely the responsibility of the authors and does not necessarily represent the official views of the National Institutes of Health. The authors further acknowledge the financial support by the National Institutes of Health grants UO1 CA168926 and RO1 CA135069 to R.G. and by CCSG grant no. P30 CA51008 to Lombardi Comprehensive Cancer Center, supporting the Proteomics and Metabolomics Shared Resource, Georgetown University Medical Center.
Footnotes
Supporting Information
The Supporting Information is available free of charge on the ACS Publications website at DOI: 10.1021/acs.jproteo-me.8b00201.
Tables showing MELD scores of patients with different liver diseases, parameters for the quantification of all of the known SHBG-specific glycopeptides, reproducibility of the measurements, glycosylation changes, and changes in the outer arm fucosylation, HexNAc(4)Hex(6) N-glycoform, and O-glycan sialylation in cirrhotic patients with different etiologies and HCC. Figures showing a comparison of the data-normalization methods, serum SHBG in liver diseases measured by ELISA, and the cleavage of outer-arm fucose on the fucosylated glyco-forms of SHEIWTHSCPQSPGNGTDASH. (PDF)
The authors declare no competing financial interest.
The mass spectrometry data have been deposited to the jPOST repository (https://repository.jpostdb.org/preview/4064853735b2d45564b54a).
REFERENCES
- 1.Ohtsubo K; Marth JD Glycosylation in cellular mechanisms of health and disease. Cell 2006, 126, 855–867. [DOI] [PubMed] [Google Scholar]
- 2.Helenius A; Aebi M Intracellular functions of N-linked glycans. Science 2001, 291, 2364–2369. [DOI] [PubMed] [Google Scholar]
- 3.Wang M; Sanda M; Comunale MA; Herrera H; Swindell C; Kono Y; Singal AG; Marrero J; Block T; Goldman R; Mehta A Changes in the Glycosylation of Kininogen and the Development of a Kininogen-Based Algorithm for the Early Detection of HCC. Cancer Epidemiol., Biomarkers Prev 2017, 26, 795–803. [DOI] [PMC free article] [PubMed] [Google Scholar]
- 4.Huang Y; Zhou S; Zhu J; Lubman DM; Mechref Y LC-MS/MS isomeric profiling ofpermethylated N-glycans derived from serum haptoglobin ofhepatocellular carcinoma (HCC) and cirrhotic patients. Electrophoresis 2017, 38, 2160–2167. [DOI] [PMC free article] [PubMed] [Google Scholar]
- 5.Hwang H; Lee JY; Lee HK; Park GW; Jeong HK; Moon MH; Kim JY; Yoo JS In-depth analysis of site-specific N-glycosylation in vitronectin from human plasma by tandem mass spectrometry with immunoprecipitation. Anal. Bioanal Chem 2014, 406, 7999–8011. [DOI] [PubMed] [Google Scholar]
- 6.Benicky J; Sanda M; Pompach P; Wu J; Goldman R Quantification of fucosylated hemopexin and complement factor H in plasma of patients with liver disease. Anal. Chem 2014, 86, 10716–10723. [DOI] [PMC free article] [PubMed] [Google Scholar]
- 7.Sanda M; Zhang L; Edwards NJ; Goldman R Site-specific analysis of changes in the glycosylation of proteins in liver cirrhosis using data-independent workflow with soft fragmentation. Anal. Bioanal. Chem 2017, 409, 619–627. [DOI] [PMC free article] [PubMed] [Google Scholar]
- 8.Comunale MA; Lowman M; Long RE; Krakover J; Philip R; Seeholzer S; Evans AA; Hann HW; Block TM; Mehta AS Proteomic analysis ofserum associated fucosylated glycoproteins in the development of primary hepatocellular carcinoma. J. Proteome. Res 2006, 5, 308–315. [DOI] [PubMed] [Google Scholar]
- 9.Yuan W; Sanda M; Wu J; Koomen J; Goldman R Quantitative analysis of immunoglobulin subclasses and subclass specific glycosylation by LC-MS-MRM in liver disease. J. Proteomics 116,24–33. [DOI] [PMC free article] [PubMed] [Google Scholar]
- 10.Mehta A; Norton P; Liang H; Comunale MA; Wang M; Rodemich-Betesh L; Koszycki A; Noda K; Miyoshi E; Block T Increased levels of tetra-antennary N-linked glycan but not core fucosylation are associated with hepatocellular carcinoma tissue. Cancer Epidemiol. Biomarkers Prev 2012, 21, 925–933. [DOI] [PMC free article] [PubMed] [Google Scholar]
- 11.Kizuka Y; Taniguchi N Enzymes for N-Glycan Branching and Their Genetic and Nongenetic Regulation in Cancer. Biomolecules 6 (2), 25DOI: 10.3390/biom6020025. [DOI] [PMC free article] [PubMed] [Google Scholar]
- 12.Mehta AS; Long RE; Comunale MA; Wang M; Rodemich L; Krakover J; Philip R; Marrero JA; Dwek RA; Block TM Increased levels of galactose-deficient anti-Gal immunoglobulin G in the sera of hepatitis C virus-infected individuals with fibrosis and cirrhosis. J. Virol 2008, 82, 1259–1270. [DOI] [PMC free article] [PubMed] [Google Scholar]
- 13.Morelle W; Flahaut C; Michalski JC; Louvet A; Mathurin P; Klein A Mass spectrometric approach for screening modifications of total serum N-glycome in human diseases: application to cirrhosis. Glycobiology 2006, 16, 281–293. [DOI] [PubMed] [Google Scholar]
- 14.Sanda M; Benicky J; Wu J; Wang Y; Makambi K; Ahn J; Smith CI; Zhao P; Zhang L; Goldman R Increased sialylation of site specific O-glycoforms ofhemopexin in liver disease. Clin. Proteomics 2016, 13, 24. [DOI] [PMC free article] [PubMed] [Google Scholar]
- 15.Thaler MA; Seifert-Klauss V; Luppa PB The biomarker sex hormone-binding globulin - from established applications to emerging trends in clinical medicine. Best. Pract. Res. Clin. Endocrinol. Metab 2015, 29, 749–760. [DOI] [PubMed] [Google Scholar]
- 16.Nguyen HV; Mollison LC; Taylor TW; Chubb SA; Yeap BB Chronic hepatitis C infection and sex hormone levels: effect of disease severity and recombinant interferon-alpha therapy. Intern. Med. J 2006, 36, 362–366. [DOI] [PubMed] [Google Scholar]
- 17.Becker U; Gluud C Sex, sex hormones and chronic liver diseases. Dig. Dis 1991, 9, 9–16. [DOI] [PubMed] [Google Scholar]
- 18.Kaymakoglu S; Okten A; Cakaloglu Y; Boztas G; Besisik F; Tascioglu C; Yalcin S Hypogonadism is not related to the etiology of liver cirrhosis. J. Gastroenterol 1995, 30, 745–750. [DOI] [PubMed] [Google Scholar]
- 19.Luppa PB; Thaler M; Schulte-Frohlinde E; Schreiegg A; Huber U; Metzger J Unchanged androgen-binding properties of sex hormone-binding globulin in male patients with liver cirrhosis. Clin. Chem. Lab. Med 2006, 44, 967–973. [DOI] [PubMed] [Google Scholar]
- 20.Raineri M; Catalano MG; Hammond GL; Avvakumov GV; Frairia R; Fortunati N O-Glycosylation of human sex hormone-binding globulin is essential for inhibition of estradiol-induced MCF-7 breast cancer cell proliferation. Mol. Cell. Endocrinol 2002, 189, 135–143. [DOI] [PubMed] [Google Scholar]
- 21.Hammond GL Potential functions of plasma steroid-binding proteins. Trends Endocrinol. Metab 1995, 6, 298–304. [DOI] [PubMed] [Google Scholar]
- 22.Terasaki T; Nowlin DM; Pardridge WM Differential binding of testosterone and estradiol to isoforms of sex hormone-binding globulin: selective alteration of estradiol binding in cirrhosis. J. Clin. Endocrinol. Metab 1988, 67, 639–643. [DOI] [PubMed] [Google Scholar]
- 23.Brenta G; Bedecarras P; Schnitman M; Gurfinkiel M; Damilano S; Campo S; Pisarev MA Characterization of sex hormone-binding globulin isoforms in hypothyroid women. Thyroid 2002, 12, 101–105. [DOI] [PubMed] [Google Scholar]
- 24.Cao L; Tolic N; Qu Y; Meng D; Zhao R; Zhang Q; Moore RJ; Zink EM; Lipton MS; Pasa-Tolic L; Wu S Characterization of intact N- and O-linked glycopeptides using higher energy collisional dissociation. Anal. Biochem 2014, 452, 96–102. [DOI] [PMC free article] [PubMed] [Google Scholar]
- 25.Thaysen-Andersen M; Packer NH Advances in LC-MS/MS-based glycoproteomics: getting closer to system-wide site-specific mapping of the N- and O-glycoproteome. Biochim. Biophys. Acta, Proteins Proteomics 2014, 1844, 1437–1452. [DOI] [PubMed] [Google Scholar]
- 26.Yang W; Shah P; Hu Y; Toghi Eshghi S; Sun S; Liu Y; Zhang H Comparison of Enrichment Methods for Intact N- and O- Linked Glycopeptides Using Strong Anion Exchange and Hydrophilic Interaction Liquid Chromatography. Anal. Chem 2017, 89, 11193–11197. [DOI] [PMC free article] [PubMed] [Google Scholar]
- 27.Liu Q; Xie Y; Deng C; Li Y One-step synthesis of carboxyl-functionalized metal-organic framework with binary ligands for highly selective enrichment of N-linked glycopeptides. Taianta 2017, 175, 477–482. [DOI] [PubMed] [Google Scholar]
- 28.Sanda M; Pompach P; Brnakova Z; Wu J; Makambi K; Goldman R Quantitative liquid chromatography-mass spectrometry-multiple reaction monitoring (LC-MS-MRM) analysis of site-specific glycoforms of haptoglobin in liver disease. Mol. Ceil. Proteomics 2013, 12, 1294–1305. [DOI] [PMC free article] [PubMed] [Google Scholar]
- 29.Miyamoto S; Stroble CD; Taylor S; Hong Q; Lebrilla CB; Leiserowitz GS; Kim K; Ruhaak LR Multiple Reaction Monitoring for the Quantitation of Serum Protein Glycosylation Profiles: Application to Ovarian Cancer. J. Proteome. Res 2018, 17, 222–233. [DOI] [PMC free article] [PubMed] [Google Scholar]
- 30.Huang J; Kailemia MJ; Goonatilleke E; Parker EA; Hong Q; Sabia R; Smilowitz JT; German JB; Lebrilla CB Quantitation of human milk proteins and their glycoforms using multiple reaction monitoring (MRM). Anal. Bioanal. Chem 2017, 409, 589–606. [DOI] [PMC free article] [PubMed] [Google Scholar]
- 31.Darebna P; Novak P; Kucera R; Topolcan O; Sanda M; Goldman R; Pompach P Changes in the expression of N- and O-glycopeptides in patients with colorectal cancer and hepatocellular carcinoma quantified by full-MS scan FT-ICR and multiple reaction monitoring. J. Proteomics 2017, 153, 44–52. [DOI] [PMC free article] [PubMed] [Google Scholar]
- 32.Yang N; Goonatilleke E; Park D; Song T; Fan G; Lebrilla CB Quantitation of Site-Specific Glycosylation in Manufactured Recombinant Monoclonal Antibody Drugs. Anal. Chem 2016, 88, 7091–7100. [DOI] [PMC free article] [PubMed] [Google Scholar]
- 33.Song E; Pyreddy S; Mechref Y Quantification of glycopeptides by multiple reaction monitoring liquid chromatography/tandem mass spectrometry. Rapid Commun. Mass Spectrom 2012, 26, 1941–1954. [DOI] [PMC free article] [PubMed] [Google Scholar]
- 34.Bourmaud A; Gallien S; Domon B Parallel reaction monitoring using quadrupole-Orbitrap mass spectrometer: Principle and applications. Proteomics 2016, 16, 2146–2159. [DOI] [PubMed] [Google Scholar]
- 35.Lesur A; Ancheva L; Kim YJ; Berchem G; van Oostrum J; Domon B Screening protein isoforms predictive for cancer using immunoaffinity capture and fast LC-MS in PRM mode. Proteomics: Clin. Appl 2015, 9, 695–705. [DOI] [PubMed] [Google Scholar]
- 36.Sanda M; Goldman R Data Independent Analysis of IgG Glycoforms in Samples of Unfractionated Human Plasma. Anal. Chem, 88, 10118–10125. [DOI] [PMC free article] [PubMed] [Google Scholar]
- 37.Lewis JG; Longley NJ; Elder PA Monoclonal antibodies to human sex hormone-binding globulin (SHBG): characterization and use in a simple enzyme-linked immunosorbent assay (ELISA) of SHBG in plasma. Steroids 1999, 64, 259–265. [DOI] [PubMed] [Google Scholar]
- 38.Rauniyar N Parallel Reaction Monitoring: A Targeted Experiment Performed Using High Resolution and High Mass Accuracy Mass Spectrometry. Int. J. Mol. Sci 2015, 16, 28566–28581. [DOI] [PMC free article] [PubMed] [Google Scholar]
- 39.Sumer-Bayraktar Z; Nguyen-Khuong T; Jayo R; Chen DD; Ali S; Packer NH; Thaysen-Andersen M Micro-and macroheterogeneity of N-glycosylation yields size and charge isoforms of human sex hormone binding globulin circulating in serum. Proteomics 12, 3315–3327. [DOI] [PubMed] [Google Scholar]
- 40.Goldman R; Sanda M Targeted methods for quantitative analysis ofprotein glycosylation. Proteomics: Clin.Appl 2015, 9,17–32. [DOI] [PMC free article] [PubMed] [Google Scholar]
- 41.Staudacher E; Altmann F; Wilson IBH; Marz L Fucose in N-glycans: from plant to man. Biochim. Biophys. Acta, Gen. Subj 1999, 1473, 216–236. [DOI] [PubMed] [Google Scholar]
- 42.Cao Q; Zhao Q; Qian X; Ying W Identification of Core-Fucosylated Glycoproteome in Human Plasma. Methods Mol. Biol, 1619, 127–137. [DOI] [PubMed] [Google Scholar]
- 43.Ma J; Sanda M; Wei R; Zhang L; Goldman R Quantitative analysis of core fucosylation of serum proteins in liver diseases by LC-MS-MRM. J. Proteomics 2018, DOI: 10.1016/j.jprot.2018.02.003. [DOI] [PMC free article] [PubMed] [Google Scholar]
- 44.Chandler KB; Brnakova Z; Sanda M; Wang S; Stalnaker SH; Bridger R; Zhao P; Wells L; Edwards NJ; Goldman R Site-specific glycan microheterogeneity of inter-alpha-trypsin inhibitor heavy chain H4. J. Proteome. Res 2014, 13, 3314–3329. [DOI] [PMC free article] [PubMed] [Google Scholar]
- 45.Kozlik P; Sanda M; Goldman R Nano reversed phase versus nano hydrophilic interaction liquid chromatography on a chip in the analysis of hemopexin glycopeptides. J. Chromatogr. A 2017, 1519, 152–155. [DOI] [PMC free article] [PubMed] [Google Scholar]
- 46.Wuhrer M; Koeleman CA; Hokke CH; Deelder AM Mass spectrometry of proton adducts of fucosylated N-glycans: fucose transfer between antennae gives rise to misleading fragments. Rapid Commun. Mass Spectrom 2006, 20, 1747–1754. [DOI] [PubMed] [Google Scholar]
- 47.Hoja-Lukowicz D; Link-Lenczowski P; Carpentieri A; Amoresano A; Pochec E; Artemenko KA; Bergquist J; Litynska A L1CAM from human melanoma carries a novel type ofN-glycan with Galbeta1–4Galbeta1-motif. Involvement of N-linked glycans in migratory and invasive behaviour of melanoma cells. Glycoconjugate J. 30,205–225. [DOI] [PMC free article] [PubMed] [Google Scholar]
- 48.Lu J; Gu J Significance of beta-Galactoside alpha2,6 Sialyltranferase 1 in Cancers. Molecules 2015, 20, 7509–7527. [DOI] [PMC free article] [PubMed] [Google Scholar]
- 49.Pearce OM; Laubli H Sialic acids in cancer biology and immunity. Glycobiology 2016, 26, 111–128. [DOI] [PubMed] [Google Scholar]
- 50.Marcos NT; Pinho S; Grandela C; Cruz A; Samyn-Petit B; Harduin-Lepers A; Almeida R; Silva F; Morais V; Costa J; Kihlberg J; Clausen H; Reis CA Role of the human ST6GalNAc-I and ST6GalNAc-II in the synthesis of the cancer-associated sialyl-Tn antigen. Cancer Res. 2004, 64, 7050–7057. [DOI] [PubMed] [Google Scholar]
- 51.Samyn-Petit B; Krzewinski-Recchi MA; Steelant WF; Delannoy P; Harduin-Lepers A Molecular cloning and functional expression of human ST6GalNAc II. Molecular expression in various human cultured cells. Biochim. Biophys. Acta, Gen. Subj 2000, 1474, 201–211. [DOI] [PubMed] [Google Scholar]
- 52.Ikehara Y; Kojima N; Kurosawa N; Kudo T; Kono M; Nishihara S; Issiki S; Morozumi K; Itzkowitz S; Tsuda T; Nishimura SI; Tsuji S; Narimatsu H Cloning and expression of a human gene encoding an N-acetylgalactosamine-alpha2,6-sialyltrans-ferase (ST6GalNAc I): a candidate for synthesis of cancer-associated sialyl-Tn antigens. Glycobiology 1999, 9, 1213–1224. [DOI] [PubMed] [Google Scholar]
- 53.Dall’Olio F; Chiricolo M Sialyltransferases in cancer. Glycoconjugate J. 2001, 18, 841–850. [DOI] [PubMed] [Google Scholar]
- 54.Bull C; Stoel MA; den Brok MH; Adema GJ Sialic acids sweeten a tumor’s life. Cancer Res. 2014, 74, 3199–3204. [DOI] [PubMed] [Google Scholar]
- 55.Schneider F; Kemmner W; Haensch W; Franke G; Gretschel S; Karsten U; Schlag PM Overexpression of sialyltransferase CMP-sialic acid:Galbeta1,3GalNAc-R alpha6-Sialyl-transferase is related to poor patient survival in human colorectal carcinomas. Cancer Res. 2001, 61, 4605–4611. [PubMed] [Google Scholar]
- 56.Ren D; Jia L; Li Y; Gong Y; Liu C; Zhang X; Wang N; Zhao Y ST6GalNAcII mediates the invasive properties of breast carcinoma through PI3K/Akt/NF-kappaB signaling pathway. IUBMB Life 2014, 66, 300–308. [DOI] [PubMed] [Google Scholar]
Associated Data
This section collects any data citations, data availability statements, or supplementary materials included in this article.