Abstract
Background
TCL-based immunotherapy has been applied in the field cancer therapy. However, it is un clear whether this therapy can be used to treat triple-negative breast cancer (TNBC), and different TNBC cells have distinct responses to this therapy.
Material/Methods
In the present work, we conducted 2 different TCL-based immunotherapies to treat TNBC and compared their anti-tumor effect on 4 TNBC cell lines: MDA-MB-231, MDA-MB-436, HCC1937, and HCC1187.
Results
Peripheral blood mononuclear cells (PBMC) activated by TCL and peripheral blood lymphocytes (PBL) stimulated with TCL-loaded DC demonstrated the ability to kill TNBC cells in vitro, but the killing efficiency of PBL was much higher than that of PBMC. In vivo, PBL stimulated with TCL-loaded DC can also stop the growth of TNBC tumors in mice. HCC1187 and MDA-MD-231 best respond to TCL-based immunotherapy both in vitro and in vivo. The response of HCC1937 was weaker, and that of MDA-MB-436 was lowest among the 4 cell lines. Total mRNA microarray analysis of TNBC cells showed that PDL-1 mRNA expression in HCC1937 and MDA-MD-436 cells was higher than in the other 2 TNBC cell lines, and that of MDA-MB-436 was higher than that of HCC1937. PD1 blocking can decrease the apoptosis rate. These results show that different contents of PDL-1 in TCL, by interacting with PD expression on lymphocytes, can induce different ratios of lymphocyte apoptosis, and then result in distinct response of the 4 TNBC cell lines to TCL-based immunotherapy.
Conclusions
TCL-based immunotherapy has discrepant anti-tumor efficiency in different TNBC cell lines by PDL-1/PD interaction, providing the theoretical basis of TCL-based immunotherapy in TNBC.
MeSH Keywords: Apoptosis; Immunotherapy; Immunotherapy, Active; Triple Negative Breast Neoplasms
Background
Based on immune cells, cytokines, antigens, and antibodies, anti-cancer immunotherapy can treat the disease of the tumor by inducing the body’s anti-tumor immune function [1]. This method has been applied to a variety of basic research and clinical treatment of cancers. Especially for cancers with less than ideal radiotherapy and chemotherapy response, it is more suitable to try to use immunotherapy [2,3]. Triple-negative breast cancer (TNBC) is a specific type of breast cancer that is negative for estrogen receptor (ER), progesterone receptor (PR), and human epidermal growth factor receptor (HER2). Currently, the main medical treatment of TNBC is still radiotherapy and chemotherapy [4]. However, due to the adverse effects of these treatments, immunotherapy has been tried to treat the disease. Nevertheless, due to lack of endocrine and anti-HER2 treatment targets, clinical routine breast cancer immunotherapy methods, such as HER2 antibodies, have had little success in treating breast cancer [5]. Other more reasonable immunotherapy methods should be applied to disease treatment.
Tumor cell lysate (TCL) is a physical or chemical method with tumor cell lysis to release a variety of antigenic substances, resulting in a mixture of tumor antigens and other proteins. Since this substance contains most of the tumor antigens and various protein factors in tumor cells, it can be used as an anti-cancer immunity to induce the body’s anti-cancer immune response [6]. At present, there are many anti-cancer immunotherapy methods based on TCL, whose main mechanism is to exert anti-cancer immunity by activating immune cells. Tumor-derived chaperone-rich cell lysate (CRCL) prepared via a free solution-isoelectric focusing (FS-IEF) technique was demonstrated to be therapeutic and prophylactic in mice against B-16 melanoma, leukemia, and lymphoma [7]. Alternatively, our previous studies have found that MHS65-TCL prepared by a combination of TCL and Mycobacterial heat-shock protein 65 can induce anti-lung cancer immune function in experimental animals through specific and nonspecific anti-tumor immunity [8]. In contrast to the direct use of certain components of TCL or TCL to induce anti-tumor effects in vivo, TCL-based immunotherapy is currently applied more often with TCL-loaded DC, and then DC or DC-activated T cells back into the body to directly exert an anti-tumor effect [9]. Although the study of TCL-based anti-tumor immunotherapy is more extensive, it is required to explore whether the method can be applied to the treatment of TNBC, as well as differences among different types of TNBC treatment.
There are 2 types of clinical pathological features of TNBC: basal-like and non-basal-like [10]. At present, many of the TNBC cell lines constructed and isolated by humans can be classified into the above pathological types. For example, HCC1937 cells commonly used in biomedical research belong to the basal cell type, and MDA-MB-231 cells and MDA-MB-436 cells belong to the non-basal-like cell type. It is noteworthy that there is an immunomodulatory cell, HCC1187, in TNBC cell lines, which belongs to the basal cell type. As there are many signaling pathways involved in immune function in this TNBC cell, it is unclear whether its response to immunotherapy is unique [11].
Different TNBC cell lines have unique biological backgrounds and have very different responses to immunotherapy. To investigate the therapeutic effect of TCL-based immunotherapy on TNBC and the differences in response to this treatment for different types of TNBC, we selected 4 different TNBC cell lines – HCC1937, HCC1187, MDA-MB-231, and MDA-MB-463 – for preparation of tumor cell lysates. The different cell lysate activation immunity cells and their immune differences induced by anti-TNBC were compared in vitro and in vivo, and the mechanism underlying these differences was explored.
Material and Methods
Animals and cell lines
Female nude mice were purchased from Beijing Vital River Laboratory Animal Technology Co., Ltd. (Beijing, China) and maintained in a microisolator cage under pathogen-free conditions. Mice were 6–8 weeks of age. Experimental manipulation of the mice was undertaken in accordance with the National Institute of Health Guide for the Care and Use of Laboratory Animals, with the approval of the Scientific Investigation Board of Science and Technology of Jiangsu Province. All the TNBC cell lines were purchased from ATCC (Manassas, VA, USA). HCC1187, MDA-MB-231 HCC1937, and MCF 10A were cultured in RPMI-1640 medium (Hyclone Biotechnology Co., Tianjin, China) supplemented with 10% fetal bovine serum (Invitrogen Life Technologies, Carlsbad, CA, USA), 100 U/ml penicillin, and 100 μg/ml streptomycin (Sigma-Aldrich, St. Louis, MO, USA). MDA-MB-436 cells were cultured in L15 medium containing 10% fetal bovine serum, penicillin, streptomycin, and 20 U/100 ml insulin. This study was approved by the Ethics Committee of Jinling Hospital (Nanjing, China).
TCL, MHSP65, and MHSP65 plus TCL (P65–TCL)
TCL was prepared with cultured HCC1187, MDA-MB-231, MDA-MB-436, orHCC1937 cell lines. Briefly, cells were lysed using a freeze-thaw cycle in 1× phosphate-buffered saline (1×PBS) solution at between −80˚C and 37˚C for 5 times. Then, the prepared TCL was stored in a −80˚C freezer until use. Each of the TCLs were detected under a microscope (Olympus Corporation, Tokyo, Japan) using trypan blue staining (Sigma-Aldrich, St. Louis, MO, USA) after the final cycle. Before using, TCL was directly mixed with Mycobacterial heat-shock protein 65 (MHSP65) (Prospecbio, Ness-Ziona, Israel) in vitro. TCL of the HCC1187 plus MHSP65, TCL of MDA-MB-231 plus MHSP65, TCL of HCC1937 plus MHSP65, or TCL of MDA-MB-436 plus MHSP65 are referred to as P65-1187TCL, P65-231TCL, P65-1937TCL, or P65-436TCL, respectively.
Human peripheral blood mononuclear cell (PBMC) or peripheral blood lymphocyte (PBL) isolation and culture
PBMCs were isolated from buffy coats of healthy donors’ blood by Ficoll density-gradient centrifugation. Briefly, we mixed the Ficoll-Paque PLUS thoroughly before using by inverting the bottom repeatedly. We added Ficoll (Solarbio Biotechnology Co., Beijing, China) to the tubes, with amounts depending on blood volume and tube size. To this mixture we added the ingredient in the next step. We diluted blood 2× with phosphate-buffered saline (PBS) plus 2% fetal bovine serum, then layered the diluted blood on the top of the Ficoll solution. Tubes were centrifuged at room temperature (15–25°C) for 30 min at 400×g. Then, we removed and discarded the upper plasma layer carefully using a clean pipette so as not to disturb the remaining plasma-Ficoll interface solution, which is where the PBMCs are found. A clean pipette was used to transfer PBMCs at the plasma-Ficoll interface into a clean centrifuge tube. We added at least 3× volumes of balanced salt solution to the PBMCs in the tube, then suspended the cells by drawing them in and out of a Pasteur pipette. Tubes were then centrifuged at 200×g for 10 min at room temperature. Suspended PBMCs were plated into 6-well plates. After 24 h, the suspended cells were used as PBL, and the adhering cells were used to induce dendritic cells (DC).
Q-PCR
Total RNA of HCC1187, MDA-MB-231, MDA-MB-436, HCC1937 cells, or PBMCs isolated from 5 different healthy donors were extracted using an RNA extraction kit (Tiangen Biotech Co. Ltd., Beijing, China) and reverse-transcribed to cDNA using a reverse transcription kit (Tiangen Biotech Co. Ltd., Beijing, China). Then, quantitative real-time PCR (Q-PCR) was conducted with the cDNA to evaluate mRNA expression of HLA-A2 in the cell line and PBMCs using a Q-PCR kit (Tiangen Biotech Co. Ltd, Beijing, China). Finally, the Q-PCR data were analyzed with Q-PCR equipment (ABI Step One, CA, USA).
Western blot analysis
Separated TCL prepared from HCC1187, MDA-MB-231, MDA-MB-436, and HCC1937 cells or PBMCs with SDS-PAGE. Then, the protein was transferred from the gel onto a PVDF membrane. This membrane was successively incubated with an anti-HLA-A2 mAb (Abcam Co., MA, USA) and an anti-rabbit polyclonal IgG-horseradish peroxidase antibody (LI-COR Co., NE, USA). To detect the protein, the membrane was scanned and analyzed using an Odyssey fluorescent scanning system (LI-COR Co., NE, USA).
Flow cytometric analysis
PBMC activated by TCL or PBL stimulated with TCL-loaded DC were collected, washed, and re-suspended in 1×PBS supplemented with 1% heat-inactivated fetal bovine serum. Thereafter, the cells were stained with fluorescein isothiocyanate-labeled anti-CD69 (QED Bioscience; San Diego, CA, USA) to detect the activation of PBMC or stained with PE-labeled anti-IFN-γ and fluorescein isothiocyanate-labeled anti-CD8 antibody (Kaiji Biotechnology Co., Nanjing, China) to analyze CTL. In some experiment, PBMC were cocultured with anti-PD antibody (Creative biolabs, NY, USA) to block the PD on the surface of PBMC before activated by TCL. And then, the PBMC was stained with PI and Annexin V (Kaiji Biotechnology Co., Nanjing, China) to evaluate PBMC apoptosis. All the stained cells was detected using FACSCalibur flow cytometry (BD Co., NJ, USA) and analyzed with Flowjo 10.0.
TCL-stimulated PBMC cytotoxicity assay
We cultured 2×10⁶/ml PBMCs from different donors in a medium with 1×PBS, 231TCL, 1187TCL, 1937TCL, or 436TCL for 48 h, to a final TCL concentration of 50 ug/ml. MHSP65 was 10 μg/ml. The PBMCs were used as effector cells. The effector cells were cultured with 5×10³ different TNBC cells per well in a 96-well plate at effector/target ratios of 50: 1 and 100: 1 at 37°C. At 24 h later, the cells in each well were stained with 20μl MTT for 4 h at 37°C and decolored by adding 150 μl DMSO per well for 20 min with shaking. Then, the OD value of each well was detected using spectrophotometer at 578 nm. The cytotoxicity was calculated based on the formula: [1-(OD value of experimental well-OD value of PBMC Control)/OD value of medium Control]×100%. The specific killing rate was calculated as: cytotoxicity of TCL group minus cytotoxicity of PBMC Control group.
DC preparation and activation
Adhering PBMC cells were cultured in an RPMI1640 medium containing 10% FBS, 100 U/ml penicillin, 100 μg/ml streptomycin, and 50 μM 2mercaptoethanol (Invitrogen Life Technologies), supplemented with 20 ng/ml murine granulocyte-macrophage colony-stimulating factor (GM-CSF) and IL-4 (Miltenyi Biotech) to induce mature DC. On days 3 and 6, the culture medium was replaced with fresh medium supplemented with GM-CSF. On day 7, DCs were cultured in the presence of 1×PBS, 231TCL, 1187TCL, 1937TCL, or 436TCL. The final TCL concentration was 50 ug/ml. MHSP65 was 10 μg/ml. On day 9, the DCs were stimulated with 1×PBS, 231TCL, 1187TCL, 1937TCL, or 436TCL 1 more time.
Cytotoxicity assay of the CTL stimulated with TCL loading DC
On day 10 of DC culture, DCs stimulated with TCL (TCL group) or 1×PBS (Control) were collected and cocultured with PBL for 48 h. The ratio of DC: PBL was 1: 50. Then, the PBLs were centrifuged, counted, and used as effector cells. We cultured 5×10³ different TNBC cells in 96-well plates as target cells. The cells were cocultured with in a 96-well plate at effector/target ratios of 50: 1 and 100: 1 at 37°C. After 24 h, the cytotoxicity of the spleen cells was calculated the same as in the PBMC cytotoxicity assay above. The specific killing rate was calculated as: cytotoxicity of TCL group minus cytotoxicity of Control group.
Immunization and tumor challenge
For different TNBC inoculations, the female nude mice were treated with 5×10⁵ MDA-MB-231 cells, 1×10⁷ MDA-MB-436 cells, 1×10⁶ HCC1187 cells, or 1×10⁷ HCC1937 cells in a volume of 0.2 ml serum-free medium s.c. near the right hind leg. To detected the anti-tumor effect of PBL stimulated by MDA-MB-231 TCL-loaded DC in vivo, 15 female nude mice were divided into 3 groups. The mice were immunized with 1×10⁷ PBL stimulated by 231TCL-loaded DC (Specific group), PBL stimulated by negative DC (Nonspecific group), or injected with 1×PBS s.c. (Control group) at the position near the point where MDA-MB-231 cells were inoculated on the same day tumor cells were implanted. Two different donors’ PBL that can kill MDA-MB-231 cells in vitro were detected. To detected the anti-tumor effect of PBL stimulated by 436TCL, 1187TCL, or 1937TCL-loaded DC in vivo, nude mice were immunized as above. But in different Specific groups, mice were immunized with PBL stimulated by 436 TCL-loaded DC, 1187TCL-loaded DC, or 1937TCL-loaded DC, respectively. One dose of TCL was prepared with 1×10⁶ MDA-MB-231 cells, MDA-MB-436 cells, HCC1187 cells, or HCC1937 cells plus 1 μg MHSP65. Tumor volume was measured every 3 or 4 days with a caliper. Tumors greater than 2 mm in diameter with progressive growth were recorded as positive. When the tumor volume reached 3000 mm3 or on the day after tumor implantation was over 30, the mice were killed and we separated tumors under the skin to take pictures. The tumor inhibition rate was calculated as: 1 minus the average tumor volume of Nonspecific (or Specific) group/average tumor volume of Control group. Specific inhibition rate was calculated as: tumor inhibition rate of Specific group minus tumor inhibition rate of Nonspecific group.
Analysis of human transcriptome array
Altered mRNA expression patterns of MDA-MB-231, HCC1187, HCC1937, or MDA-MB-436 cells were compared with the MCF 10A cell line using the Affymetrix Gene Chip Human Gene 2.0 ST Array. The data were summarized with Expression Console™ software (Affymetrix), and further analyzed using GeneSpring GX (Affymetrix) and Ingenuity Pathway Analysis (IPA; Ingenuity Systems) software.
Statistical analysis
Results are expressed as the mean ± standard deviation. One-way analysis of variance (ANOVA) was used to analyze experimental data first. When the variance was equal, the significance of differences between the 2 groups was analyzed. When the variance was unequal, the differences between 2 groups was analyzed by rank-sum test. Differences between more than 2 groups were analyzed using one-way analysis of variance (ANOVA) followed by the Newman-Keuls multiple-comparison post hoc test.
Tumor growth curves were plotted based on tumor size until the tumor volume reached 3000 mm3 or the day after tumor implantation was over 30. A P value of <0.05 was considered statistically significant. All statistical analyses were performed with SPSS 19.0 software.
Results
Detection of HLA-A2 expression in TNBC cell line and human PBMC
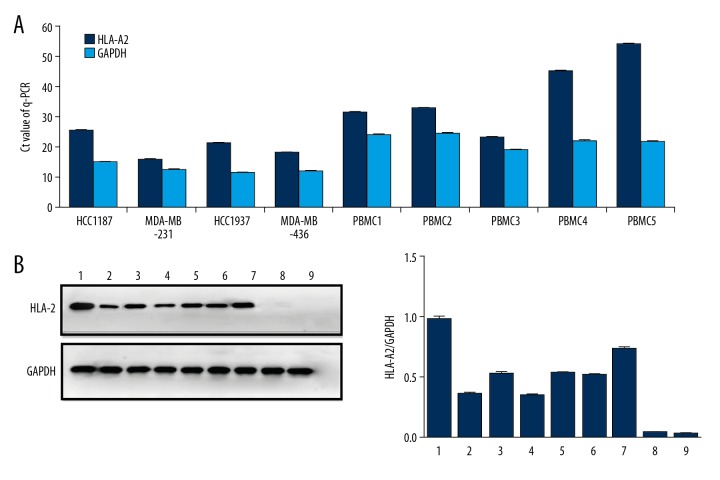
Numerous studies have found that tumor cell lines and immune cells that express human histocompatibility antigen A2 (HLA-A2) are more suitable for anti-tumor immunotherapy. According to the Q-PCR and Western blot assays in selected TNBC cell lines and donor’s PBMCs, we found that all TNBC cell lines were HLA-A2-positive. The difference in Ct values between HLA-A2 mRNA and corresponding GAPDH mRNA in each TNBC cell line was less than 16, indicating high expression of HLA-A2 in these TNBC cell lines (Figure 1A). This trend is in good agreement with the results of Western blot analysis (Figure 1B). For HLA-A2 in PBMC, the results of Q-PCR showed that the difference in Ct values between HLA-A2 mRNA and corresponding GAPDH mRNA in donors 1, 2, and 3 was less than 16, but higher than 16 in donors 4 and 5, which means that 3 of 5 donors’ PBMCs were HLA-A2-positive (Figure 1A), in agreement with the Western blot results (Figure 1B). HLA-A2-positive cell lines and PBMCs were used for subsequent experiments.
Figure 1.
HLA-A2 detection of PBMCs. (A) Reverse-transcription q-PCR was used to detect HLA-A2 expression on TNBC cell lines and PBMCs from different donors. Each histogram represents the mean Ct value of the PCR products. HLA-A2 genes exhibited high mRNA expression in the cells compared with GAPDH, except for PBMC 4 and PBMC 5. (B) Western blot analysis was performed to detect the protein expression levels of HLA-A2 or GAPDH in different cells with specific antibodies. Based on band intensity, HLA-A2 had high expression in all the cells, except for PBMC 4 and PBMC 5. 1: MDA-MB-231, 2: HCC937, 3: MDA-MB-436, 4: HCC1187, 5–9: PBMC 1–5.
TCL-stimulated PBMC displays anti-TNBC effect
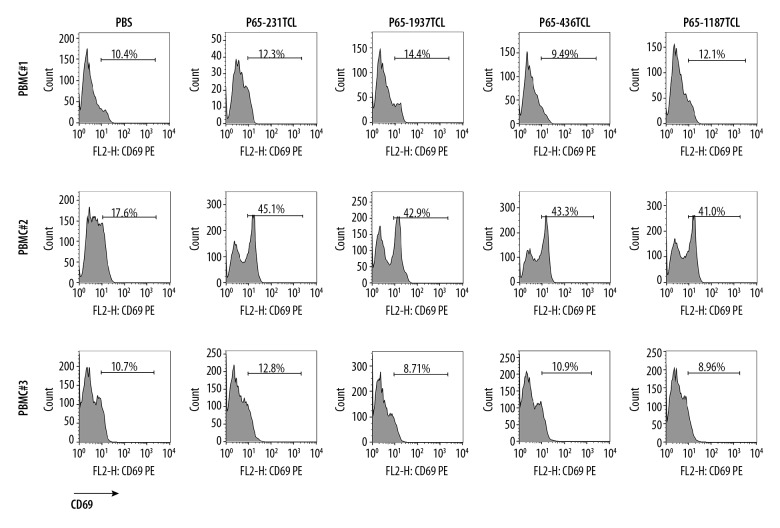
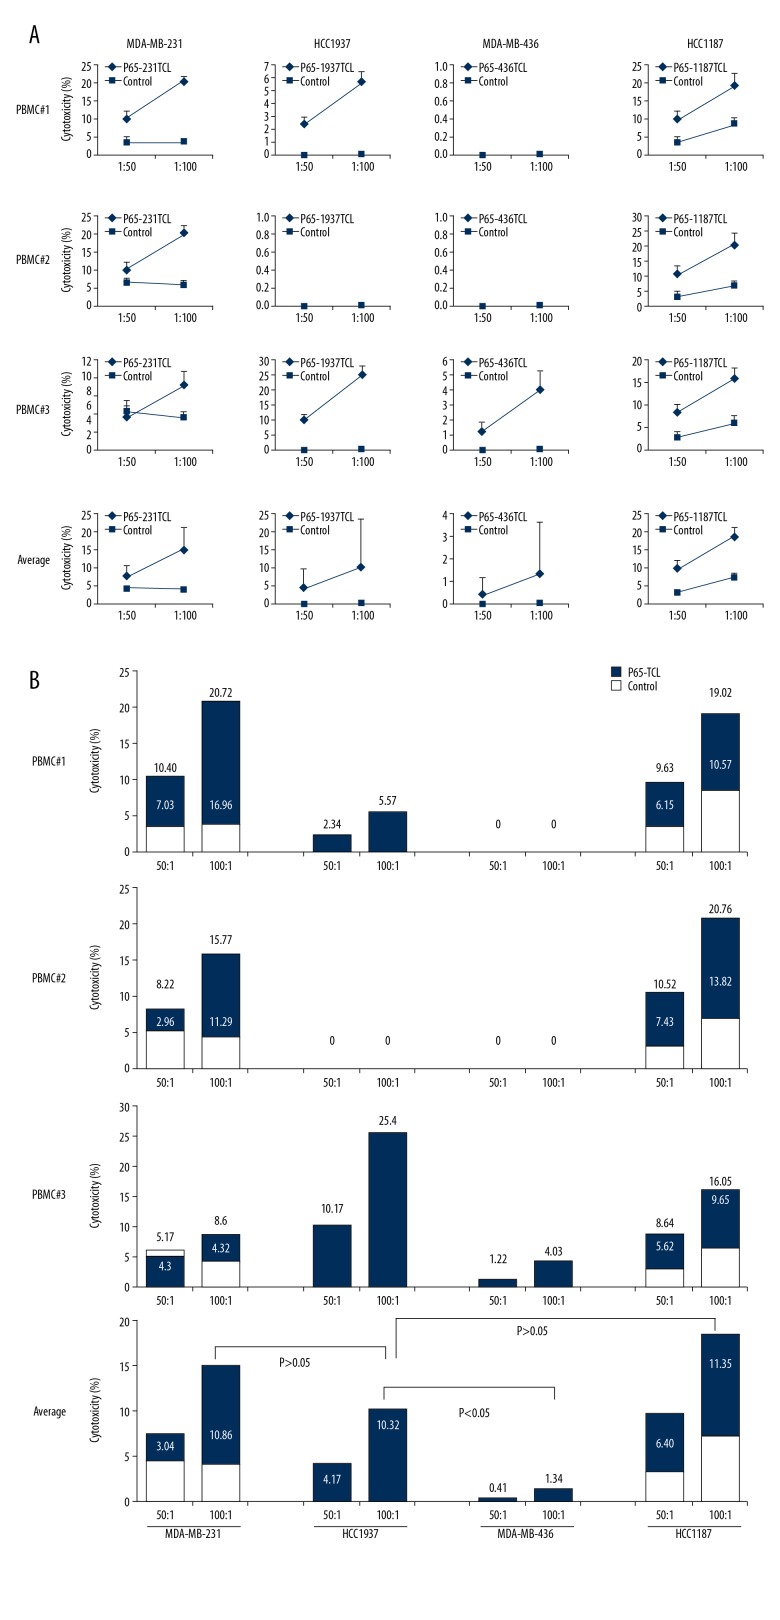
TCL and its components can be directly used as vaccines to induce anti-tumor effect in the body. In order to simulate the direct immunization of TCL to the body, TCL was directly interacted with PBMC in vitro, and then the activation of PBMC was detected. The cytotoxicity test was performed using the stimulated PBMCs. Compared with the Control group, PBMCs of donor2 had a significant upregulation of CD69 after TCL stimulation, of which the CD69 expression rate in the 231TCL stimulation group was 45.1%, in the 1187TCL stimulation group it was 41.0%, in the 1937TCL stimulation group it was 42.9%, and in the 436TCL stimulation group was 43.3% (Figure 2). CD69 expression in PBMCs from donor 1 and donor 3 did not show significant upregulation after TCL stimulation. After treating TCL-stimulated PBMCs with cancer cells, the average specific lethal rate (TCL group killing rate minus Control group killing rate) of 3 donor’s PBMCs to TNBC cells was 8.27%, 6.27%, and 12.45%, respectively, with a 100: 1 effect-target ratio (Figure 3A). In different TNBCs, the 3 donor’s PBMCs had an average specific killing rate (TCL group killing rate minus Control group killing rate) of 10.86% for MDA-MB-231, 11.35% for HCC1187, 10.32% for HCC1937, and 1.34% for MDA-MB-436 with a 100: 1 effect-target ratio (Figure 3B).
Figure 2.
CD69 detection of PBMC stimulated with TNBC TCL. PBMC were cultured for 48 h in medium containing P65-1187TCL, P65-231TCL, P65-1937TCL, P65-436TCL, or 1×PBS. The expression of CD69 in PBMCs was determined by flow cytometry. Number in each histogram represents the CD69 mean fluorescence intensity of the sample.
Figure 3.
PBMCs stimulated with TNBC TCL have ability to kill TNBC cells in vitro. TNBC cells killing assay. The PBMC from different donor were treated with different TNBC TCLs for 48 h as in Figure 2 and used as effectors. Corresponding TNBC cells were used as targets. (A) Killing curve of PBMC to TNBC cells; (B) Killing percentage in each assay. Numbers above column represent killing percentage of PBMC stimulated with TCL. Numbers in column represent specific killing percentage in PBMC stimulated with TCL (calculated as killing percentage of TCL group minus killing percentage of Control group).
PBL activated by TCL-loaded DC more effectively inhibits TNBC cell growth
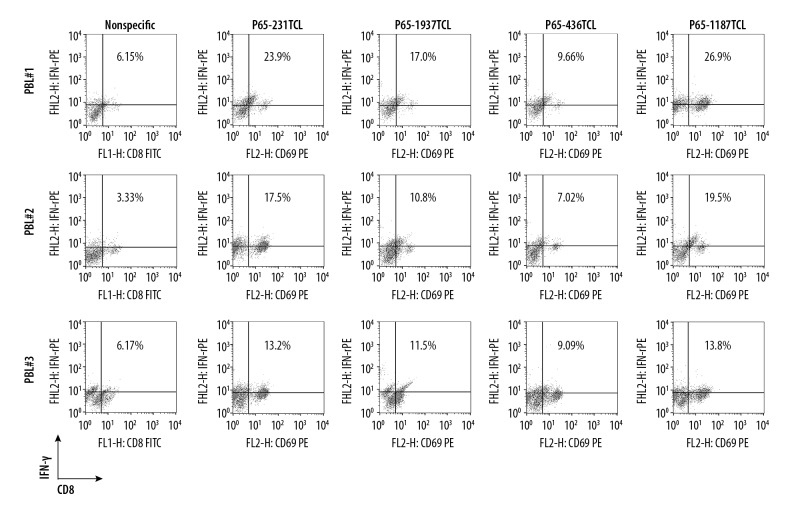
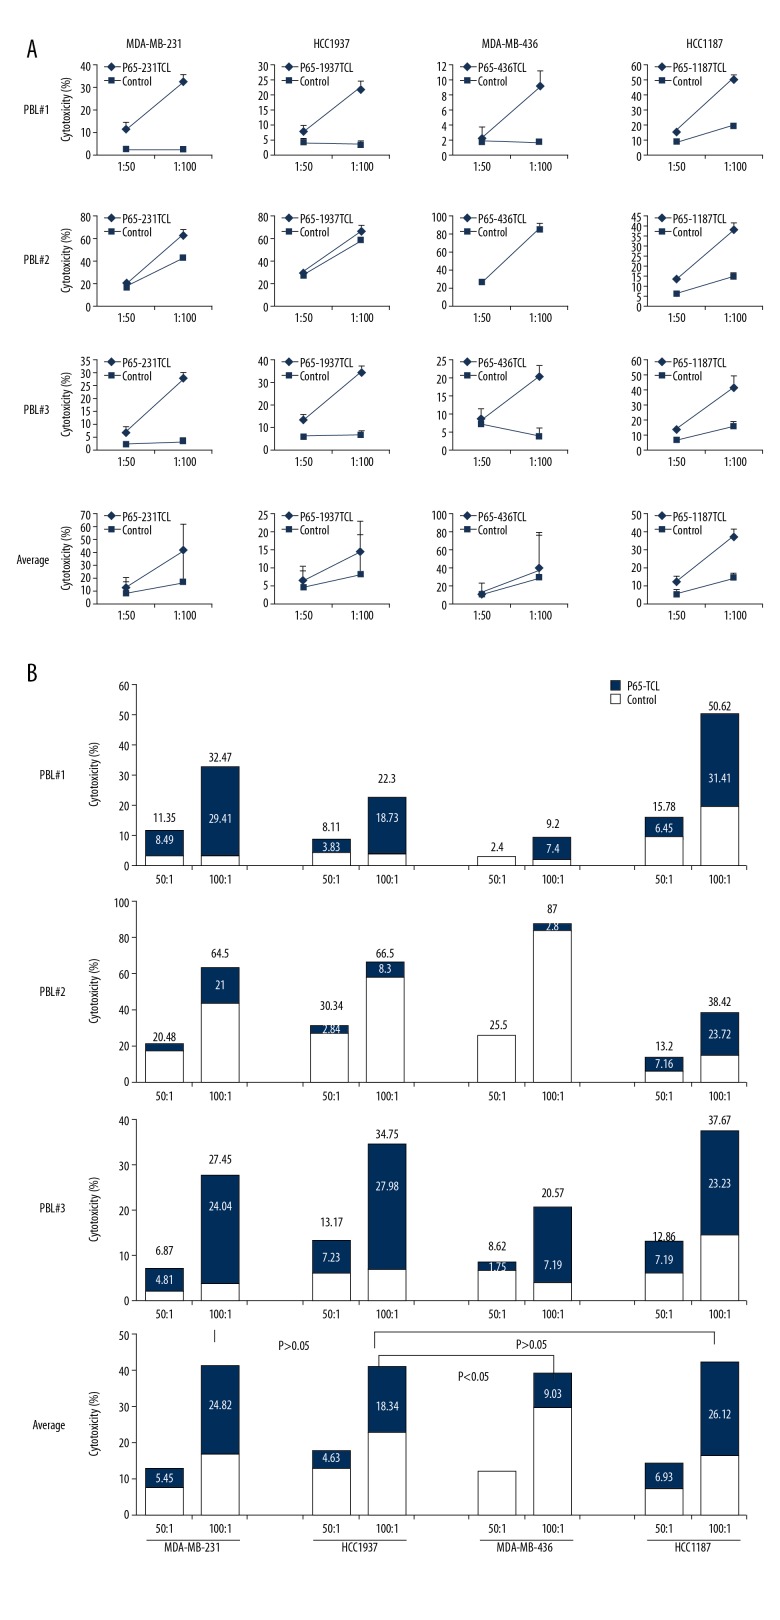
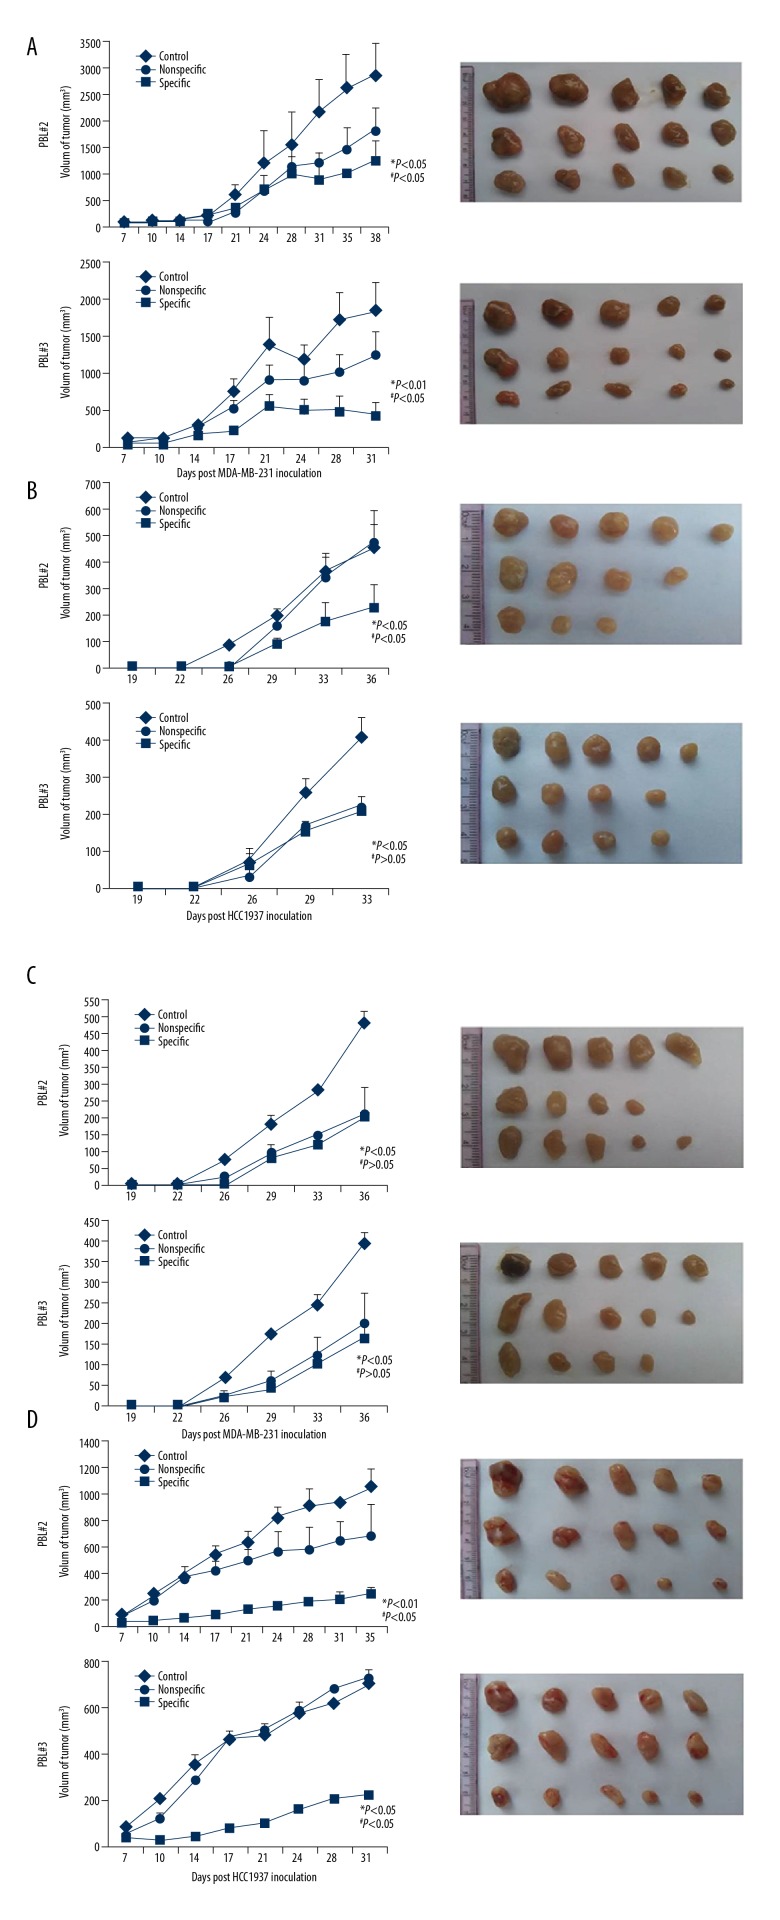
Based on TCL immunotherapy, DCs can be activated with TCL to induce the generation of CTL cells exerting anti-tumor effects. To simulate this immunotherapy approach, PBL was interacted in vitro with different TCL-loaded DCs. After 48 h, the proportion of CD8 + T cells secreting IFN-γ increased in the 3 donor’s PBLs, in which the average ratio of donor 1 was 19.36%, the average ratio of donor 2 was 13.71%, and the average ratio of donor 3 was 11.89%. In addition, the ability of different TCL-activated DCs to induce CTL is not the same. Among them, the average proportion of CD8+ T cells secreting IFN-γ in 231TCL-loaded DC-induced PBL was 18.2%, in the 1187TCL group it was 20.06%, in the 1937TCL group it was 13.1%, and in the 436TCL group it was 8.59% (Figure 4). Using DC-activated PBL, we further performed killing experiments. From different donors, the average specific lethal rate (TCL group killing rate minus Control group killing rate) of PBL by 3 donors to TNBC cells was 21.73%, 13.95%, and 23.03% with a 100: 1 effect-target ratio, respectively (Figure 5A). From different TNBC cell lines, the average specific killing rate (TCL group killing rate minus Control group killing rate) of the 3 donor’s PBL on MDA-MB-231 was 28.42%, on HCC1187 it was 26.12%, on HCC1937 it was 18.34%, and on MDA-MB-436 it was 9.03% (Figure 5B). These in vitro killing results were also verified by in vivo experiments. Among them, the average specific tumor inhibition rate of DC-activated PBL to MDA-MB-231 was 32.41%, to HCC1187 was 57.54%, to HCC1937 was 21.19%, and to MDA-MB-436 was 5.18% (Figure 6).
Figure 4.
DC loaded TNBC TCL can induce CTL emergence in PBL. Purified mouse DCs were cultured for 6 days with granulocytemacrophage colonystimulating factor and IL4 in a medium containing P65-1187TCL, P65-231TCL, P65-1937TCL, P65-436TCL, or 1×PBS. On day 7, DCs were cocultured with PBL from different donors. After 48 h, the PBL were stained with FITC-labeled anti-CD8 and PE-labeled anti-IFN-γ mAb to conduct flowcytometry. Numbers in each plot represent the percentage of CD8 and IFN-γ double-positive cells in PBL.
Figure 5.
Cytotoxicity of CTL to TNBC cells. Specific CTL killing assay: The splenocytes were stimulated with TCL for 48 h and CTL (CD8, IFN-γ double-positive PBL) prepared as in Figure 4 were used as effector cells. Corresponding TNBC cells were used as target cells. (A) Killing curve of PBMC to TNBC cells; (B) Killing percentage in each assay. Numbers above column represent killing percentage of PBL stimulated with TCL-loaded DC. Numbers in column represent specific killing percentage of CTL in PBL stimulated with TCL-loaded DC (calculated as killing percentage of TCL group minus killing percentage of Control group).
Figure 6.
Anti-TNBC effect of PBL activated by TNBC TCL-loaded DC in vivo. Nude mice were immunized with PBL activated by 1×PBS (Control), negative DC (nonspecific), or DC loaded with different TNBC TCL plus MHSP65 (specific) and transplanted with corresponding TNBC cells near the right hind leg. Tumor volume was measured every 2 days. In each individual experiment, when the tumor volume reached to 3000 mm3 or on the day after tumor implantation was over 30, mice were sacrificed and tumor (A) MDA-MB-231 growth curves were plotted. (B) HCC1937 growth curves and tumors from mice. (C) MDA-MB-436 growth curves and tumors from mice. (D) HCC1187 growth curves and tumors from mice. * versus Control (1×PBS); # versus Nonspecific.
Different TCLs initiate discrepant anti-TNBC immunity by PD/PDL-1 interaction
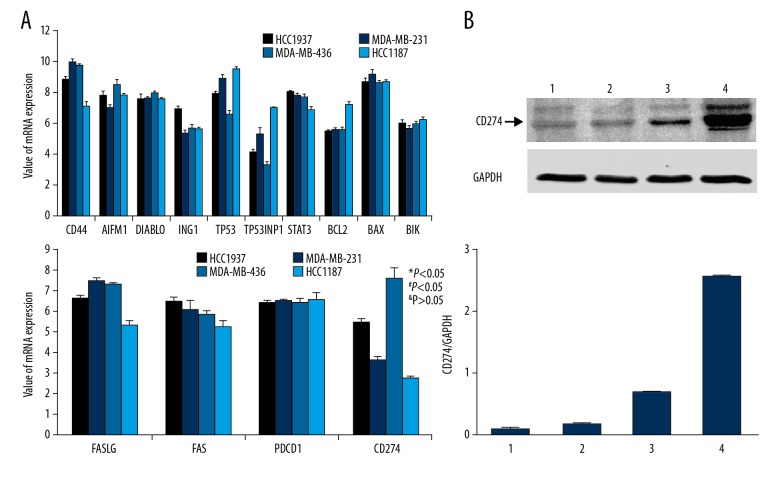
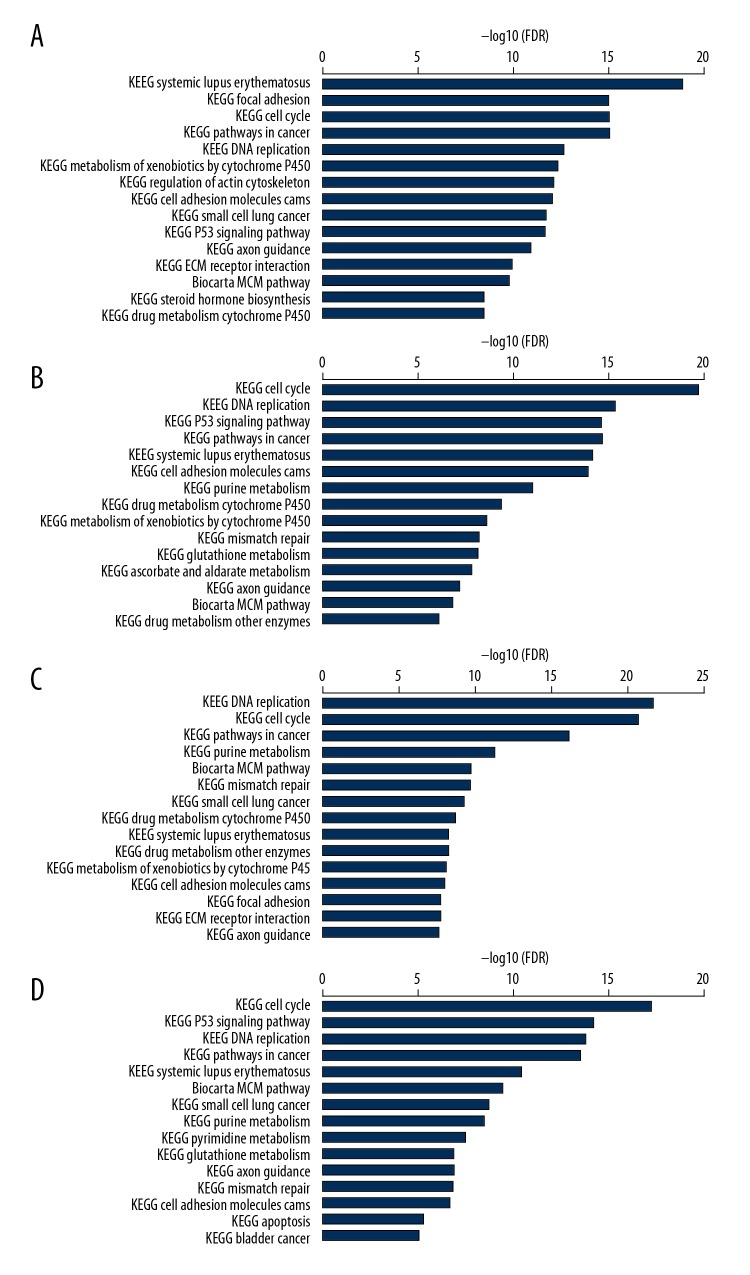
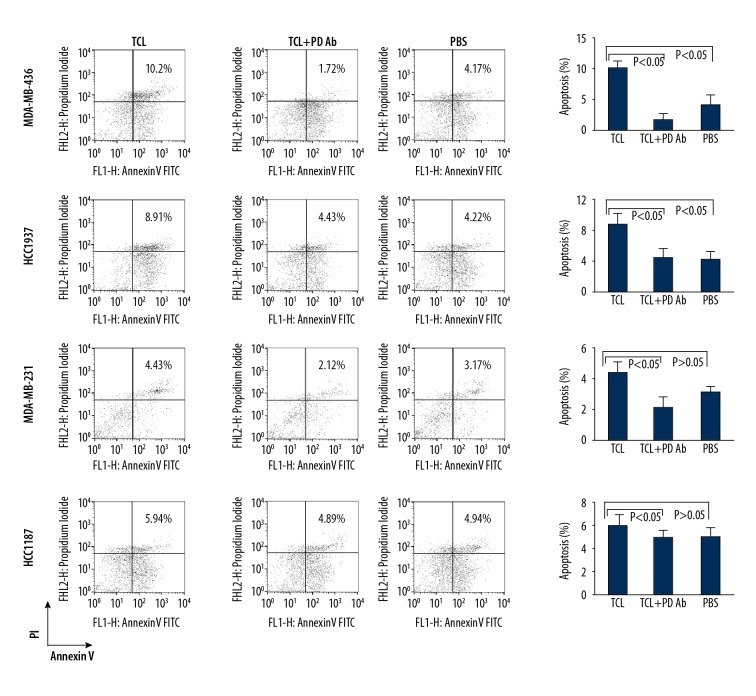
TNBC cell lines have different reactivity on TCL-based immunotherapeutic methods, which may be associated with some components of TCL-induced immune cell apoptosis. The results of all-microarray analysis of the 4 TNBC cell lines show that there are multiple mRNAs of cell apoptosis activator or inhibitors expressed in these cells. Among these mRNAs of protein factors, PDL-1 (CD274) mRNA was significantly varied in different cell lines. The expression of CD274 mRNA in HCC1937 cells was significantly higher than that in HCC1187 and MDA-MB-231 cells, while the expression of CD274 mRNA in MDA-MB-436 cells was significantly higher than that of HCC1937 cells (Figure 7A). These differences are also validated by Western blot results. The content of CD274 protein in MDA-MB-436TCL was the highest, the content of CD274 protein in HCC1937 TCL was the second, and the content of CD274 protein in HCC1187 and MDA-MB-231 cells was relatively low (Figure 7B). Moreover, the analysis of signal transduction pathways showed that the systemic lupus erythematosus pathway, which is closely related to the activation of antigen-presenting cells and B lymphocytes, had a significant change in HCC187 cells, while in MDA-MB-436 cells the apoptosis signaling pathways that were closely related to apoptosis were significantly changed (Figure 8). Moreover, when PD on PBMC was blocked with anti-PD antibody, which can reduce the PBMC apoptosis induced by TCL. The apoptosis percentage of PBMC cocultured with MDA-MB-231 TCL is 4.43%, with HCC1187 TCL is 5.94%, with HCC1937 TCL is 8.91%, with MDA-MB-436 TCL is 10.21%. However, the apoptosis induced by TCL of PBMC blocked with anti-PD antibody was 2.12%, 4.89%, 4.43%, and 1.72% in the MDA-MB-231, HCC1187, HCC1937, and MDA-MB-436 group, respectively (Figure 9). By comparing different groups of PBMC apoptosis detection, there is statistical different among TCL stimulation, PD blocking or PBS groups (P<0.05), but no different exist among different TNBC cells (P>0.05).
Figure 7.
Total mRNA microarray analysis of apoptosis association factor in TNBC cell and WB detection of CD274 (PDL-1). (A) Total mRNA microarray analysis (B) Western blot analysis of CD274 in TCL. 1: HCC1187; 2: MDA-MB-232; 3: HCC1937; 4: MDA-MB-436. * versus HCC1187; # versus MDA-MB-231; & versus HCC 1937.
Figure 8.
Total mRNA analysis of cell signal pathway in TNBC cell. Tumor cell lysate was prepared with MDA-MB-231, HCC1187, HCC1187, MDA-MB-436, or MCF-10A. Then, the mRNA of TNBC was extracted and mRNA of different cell signal pathways was analyzed by Ingenuity Pathway Analysis (A) HCC 1187; (B) MDA-MB-231; (C) HCC 1937; (D) MDA-MB-436.
Figure 9.
Apoptosis detection of PBMC induced by TNBC TCL through PD/PDL-1 interaction. PBMC were cultured for 48 h in medium containing 1187TCL, 231TCL, 1937TCL, and 436TCL, 1×PBS or each TNBC TCL plus anti-PD antibody. After 48 h, the apoptosis of PBMCs was determined by flow cytometry. Numbers in each plot represent the percentage of propidium iodide (PI) and annexin V double-positive cells. Representative data from 1 of 3 experiments is shown.
Discussion
Tumor cell lysates (TCLs) have been used in anti-tumor immunotherapy for their ability to activate anti-tumor immune cells in 2 possible ways: one is relatively simple, that is directly immunizing TCL to the body. The antigen and other protein components in TCL contact with the immunocytes to activate them and induce an anti-tumor immune effect. The other way is more complicated, starting with activation of dendritic cells by TCL, followed by activation of anti-tumor T lymphocytes by DC, inducing an anti-tumor effect.
At present, both of these TCL-based immunotherapy methods have been reported, but no direct comparison of the 2 methods has been conducted. In addition, cancers are often divided into a variety of pathological types, and specific cancer cell types for each pathological type are also different. Each cancer cell type has special reactivity to the same immunotherapy method, which needs to be explored for more specific clinical application of anti-tumor immunotherapy [12].
In this study, we selected 4 TNBC cell lines-MDA-MB-231, MDA-MB-436, HCC187, and HCC937 – to prepare tumor cell lysates. PBMCs were isolated from peripheral blood of healthy adults, and HLA-A2-positive PBMCs were selected as immune cells. After 48 h of direct interaction of different TCLs with PBMCs, we found that CD69 expression of PBMCs from group 2 was significantly upregulated compared to PBS controls, but there was no significant change in the expression of CD69 on PBMCs from other donors. In addition, subsequent PBMC in vitro killing assays showed that although PBMC CD69 expression was upregulated in donor 2, the in vitro killing efficacy of this PBMC did not differ from that of the remaining PBMCs. CD69 is considered a sign of early activation of immune cells, but the expression of CD69 also has a complex effect on immune cells [13,14]. In general, immune cell-activated CD69 expression appears to be upregulated, but the expression of CD69 makes immune cells more prone to apoptosis [15]. This biological property of CD69s can explain why PBMCs have no significant difference in their ability to kill tumor cells, and even the expression of CD69 varies. Although there is no difference in the killing effect of each PBMC activated by TCL on cancer cells, the same PBMC activated by different TNBC TCL has a unique ability to kill cancer cells. Taken together, our results show that 1187TCL and 231TCL had the strongest ability to activate PBMC, killing corresponding cancer cells, but t ability of 1937TCL is lower. The killing effect of PBMC stimulated by 436TCL is very low. Each TNBC cell line has its own biological background, and the composition of the lysate prepared with TNBC cells is also varied, thus leading to different reactivity for the same TCL-based immunotherapy.
To further validate the differences in the therapeutic effects of different TCL-based immunotherapies on TNBC, we isolated dendritic cells (DCs) from PBMCs of these donors and then loaded DCs with TCL. The DCs were used to activate PBL cells killing cancer cells. Similar to the PBMC killing effect, TCL-loaded DC-activated PBL has the effect of killing TNBC cells, and its killing efficiency is much higher than that of TCL-activated PBMCs. DC is the most competent antigen-presenting cell for uptake and processing of exogenous antigen proteins [16]. Although PBMCs also contain antigen-presenting cells, such as macrophages, monocytes, and B cells, the antigenic ability of these cells is relatively low [17]. Hence, T cells in PBMC are difficult to effectively activate and cannot efficiently kill cancer cells. In contrast, DC can better activate cytotoxic lymphocyte (CTL) cells in human PBL, which are lymphocytes with specific killing effects on cancer cells [18]. TCL contains a large number of antigenic proteins. DC presents these proteins to PBL and induce CD8+ T cells to transform into CTLs. Then, the CTL cells can specifically target TNBC cells that express these antigenic proteins for attack. This attack is more precise and efficient than with PBMC [19]. However, although generally strong, the killing efficiency of PBL to each TNBC cell is still very inconsistent. The trend of the difference is similar to that of PBMC killing, which has also been clearly demonstrated in vivo in animal experiments.
The treatment effects of TCL-based immunotherapy methods are different for every pathological type of TNBC, which is related to the specific composition of TCL. As TCL is prepared from lysis of tumor cells, in theory, it contains the entire tumor cells antigen and protein factors. Due to the different antigens and protein factors expressed by corresponding tumor cells, the prepared TCL composition greatly varied from the tumor cells. Therefore, the abilities of immune cells to activate and induce anti-tumor immunity for each TCL will inevitably be inconsistent. To determine the specific causes of these differences, we performed total mRNA microarray analysis of 4 TNBC cell lines and the results showed that many mRNA molecules were upregulated or downregulated in all 4 TNBC cell lines compared with normal breast cells in the Control group, and the expression patterns of mRNAs in several TNBC cell lines were also varied. Among the many mRNAs that express differences, we focused on analyzing the mRNAs, whose expression products are related to apoptosis and cell activation. Among these mRNAs, we found that expression of PDL-1 mRNA molecules are upregulated in HCC1937 and MDA-MB-436, but downregulated expression in HCC1187 and MDA-MB-231 cells. PDL-1 is a protein factor closely related to apoptosis, especially apoptosis of immune cells. Many studies have found that the occurrence of tumor immune escape can be induced by T lymphocyte apoptosis, which is attributed to the combination of PDL-1 expressed on tumor cells and PD on the surface of T lymphocytes [20]. In this study, PDL-1 in TCL directly contacted T lymphocytes in PBMCs and led to lymphocyte apoptosis. As the relative amounts of PDL-1 in HCC1187 and MDA-MB-231 are relatively low, the TCLs prepared from these 2 cell lines have a relatively weaker induction of apoptosis on T lymphocytes, and the ability of these 2 TCL-activated PBMCs to kill cancer cells is relatively strong. However, the relative content of PDL-1 in TCL of HCC1937 cells was higher than that of HCC1187 and MDA-MB-231 but lower than that of MDA-MB-436. Therefore, the ability of TCL in HCC1937 cells to induce T cell apoptosis and kill cancer cells was higher than that of HCC1187 and MDA-MB-231 TCL, and lower than MDA-MB-436 TCL (Figure 8). Similarly, MDA-MB-436 TCL-activated PBMCs have the weakest cytotoxicity. This speculation was proved by PD blocking of PBMC (Figure 9). Unlike TCL acting directly on PBMC, when we treated DCs with different TCL, PDL-1 in TCL was taken up and presented by DC, which combined with PD molecules on T lymphocytes, resulting in T lymphocyte apoptosis. The different levels of PDL-1 in corresponding TNBC TCLs result in differences in the cytotoxic effects of lymphocytes on cancer cells.
Conclusions
This study found that TCL-based immunotherapy can be applied to the treatment of TNBC, but certain pathological types of TNBC respond to this treatment in significantly different ways. A possible mechanism of this difference is related to PDL-1 in TCL interacting with PD on T lymphocytes and triggering T lymphocyte apoptosis.
Footnotes
Source of support: The present study was supported by the China Postdoctoral Science Foundation (grant no. 2016M603063), Postdoctoral Research Support Project of Jiangsu Province, China (grant no. 1601106B), and the Anhui Laboratory of Biological Macro-Molecules Research Foundation (grant no. 1306C083008). This work was also supported by the National Natural Science Foundation of China (no. 81773102 and no. 81470357), the Foundation for Clinical Medicine Science and Technology Special Project of Jiangsu Province, China (no. BL2014071 to X.G.)
Conflict of interest
None.
References
- 1.Helmy KY, Patel SA, Nahas GR, Rameshwar P. Cancer immunotherapy: Accomplishments to date and future promise. Ther Deliv. 2013;4:1307–20. doi: 10.4155/tde.13.88. [DOI] [PubMed] [Google Scholar]
- 2.Weir GM, Liwski RS, Mansour M. Immune modulation by chemotherapy or immunotherapy to enhance cancer vaccines. Cancers (Basel) 2011;3:3114–42. doi: 10.3390/cancers3033114. [DOI] [PMC free article] [PubMed] [Google Scholar]
- 3.Scheithauer H, Belka C, Lauber K, Gaipl US. Immunological aspects of radiotherapy. Radiat Oncol. 2014;9:185. doi: 10.1186/1748-717X-9-185. [DOI] [PMC free article] [PubMed] [Google Scholar]
- 4.Palma G, Frasci G, Chirico A, et al. Triple-negative breast cancer: Looking for the missing link between biology and treatments. Oncotarget. 2015;6:26560–74. doi: 10.18632/oncotarget.5306. [DOI] [PMC free article] [PubMed] [Google Scholar]
- 5.Chaudhary P, Thamake SI, Shetty P, Vishwanatha JK. Inhibition of triple-negative and Herceptin-resistant breast cancer cell proliferation and migration by Annexin A2 antibodies. Br J Cancer. 2014;111:2328–41. doi: 10.1038/bjc.2014.542. [DOI] [PMC free article] [PubMed] [Google Scholar]
- 6.Kawahara M, Takaku H. A tumor lysate is an effective vaccine antigen for the stimulation of CD4(+) T-cell function and subsequent induction of anti-tumor immunity mediated by CD8(+) T cells. Cancer Biol Ther. 2015;16:1616–25. doi: 10.1080/15384047.2015.1078027. [DOI] [PMC free article] [PubMed] [Google Scholar]
- 7.Yi Z, Michael WG, Emmanuel K. Chaperone-rich cell lysates, immune activation and tumor vaccination. Cancer Immunol Immunother. 2006;55:329–38. doi: 10.1007/s00262-005-0694-1. [DOI] [PMC free article] [PubMed] [Google Scholar]
- 8.Bohan D, Luguo S, Xiuli W, et al. Vaccination with TCL plus MHSP65 induces anti-lung cancer immunity in mice. Cancer Immunol Immunother. 2010;59:899–908. doi: 10.1007/s00262-010-0816-2. [DOI] [PMC free article] [PubMed] [Google Scholar]
- 9.Thomas BH, Michaela S, Peter K, et al. Heat-shock treatment of tumor lysate-pulsed DCs enhances their capacity to elicit anti-tumor T-cell responses against medullary thyroid carcinoma. J Clin Endocrin Metab. 2006;91:4571–77. doi: 10.1210/jc.2006-0971. [DOI] [PubMed] [Google Scholar]
- 10.Yamamoto Y, Ibusuki M, Nakano M, et al. Clinical significance of basal-like subtype in triple-negative breast cancer. Breast Cancer. 2009;16:260–67. doi: 10.1007/s12282-009-0150-8. [DOI] [PubMed] [Google Scholar]
- 11.Lehmann BD, Bauer JA, Chen X, et al. Identification of human triple-negative breast cancer subtypes and preclinical models forselection of targeted therapies. J Clin Invest. 2011;121:2750–67. doi: 10.1172/JCI45014. [DOI] [PMC free article] [PubMed] [Google Scholar]
- 12.Choi W, Porten S, Kim S, et al. Identification of distinct basal and luminal subtypes of muscle-invasive bladder cancer with different sensitivities to frontline chemotherapy. Cancer Cell. 2014;25:152–65. doi: 10.1016/j.ccr.2014.01.009. [DOI] [PMC free article] [PubMed] [Google Scholar]
- 13.David S, Manuel G, Francisco SM. CD69 is an immunoregulatory molecule induced following activation. Trends Immunol. 2005;26:136–40. doi: 10.1016/j.it.2004.12.006. [DOI] [PubMed] [Google Scholar]
- 14.Mervi P, Niina I, Jukka P, et al. Human in vivo-activated CD45R0+ CD4+ T cells are susceptible to spontaneous apoptosis that can be inhibited by the chemokine CXCL and IL-2, -6, -7, and -15. Eur J Immunol. 2004;34:2771–80. doi: 10.1002/eji.200324761. [DOI] [PubMed] [Google Scholar]
- 15.Dong B, Dai G, Xu L, et al. Tumor cell lysate induces the immunosuppression and apoptosis of mouse immunocytes. Mol Med Rep. 2014;10:2827–34. doi: 10.3892/mmr.2014.2606. [DOI] [PMC free article] [PubMed] [Google Scholar]
- 16.O’Keeffe M, Mok WH, Radford KJ. Human dendritic cell subsets and function in health and disease. Cell Mol Life Sci. 2015;72:4309–25. doi: 10.1007/s00018-015-2005-0. [DOI] [PMC free article] [PubMed] [Google Scholar]
- 17.Wilke CM, Kryczek I, Zou W. Antigen-presenting cell (APC) subsets in ovarian cancer. Int Rev Immunol. 2011;30:120–26. doi: 10.3109/08830185.2011.567362. [DOI] [PubMed] [Google Scholar]
- 18.Soruri A, Fayyazi A, Neumann C, et al. Ex vivo generation of human anti-melanoma autologous cytolytic T cells by dendritic cell/melanoma cell hybridomas. Cancer Immunol Immunother. 2001;50:307–14. doi: 10.1007/s002620100198. [DOI] [PMC free article] [PubMed] [Google Scholar]
- 19.Maher J, Davies ET. Targeting cytotoxic T lymphocytes for cancer immunotherapy. Br J Cancer. 2004;91:817–21. doi: 10.1038/sj.bjc.6602022. [DOI] [PMC free article] [PubMed] [Google Scholar]
- 20.Bardhan K, Anagnostou T, Boussiotis VA. The PD1: PD-L1/2 pathway from discovery to clinical implementation. Front Immunol. 2016;7:550. doi: 10.3389/fimmu.2016.00550. [DOI] [PMC free article] [PubMed] [Google Scholar]


