Abstract
We present a theory for modeling fluorescence-detected two-dimensional electronic spectroscopy of multichromophoric systems. The theory is tested by comparison of the predicted spectra of the light-harvesting complex LH2 with experimental data. A qualitative explanation of the strong cross-peaks as compared to conventional two-dimensional electronic spectra is given. The strong cross-peaks are attributed to the clean ground-state signal that is revealed when the annihilation of exciton pairs created on the same LH2 complex cancels oppositely signed signals from the doubly excited state. This annihilation process occurs much faster than the nonradiative relaxation. Furthermore, the line shape difference is attributed to slow dynamics, exciton delocalization within the bands, and intraband exciton–exciton annihilation. This is in line with existing theories presented for model systems. We further propose the use of time-resolved fluorescence-detected two-dimensional spectroscopy to study state-resolved exciton–exciton annihilation.
Introduction
Fluorescence-detected techniques for two-dimensional electronic spectroscopy (2DES)1−5 and two-dimensional infrared spectroscopy6 have been developed in recent years and are finding an increasing number of applications. A prime advantage of these methods is the sensitivity of the fluorescence measurement, which opens up the possibility for applications of two-dimensional spectroscopies in microscopy5,7 and potentially single-molecule measurements.8 Other two-dimensional spectroscopy methods with incoherent detection, such as two-dimensional nanoscopy9 relying on photoelectron microscopy for detection and current-detected two-dimensional spectroscopy,10 have been demonstrated and provide distinct advantages for different types of applications. Although a number of fluorescence-detected two-dimensional electronic spectroscopy (F-2DES) experiments1−5 and related theory4,11−13 have been reported, the understanding of the features in F-2DES spectra is still at an early stage. This is particularly true for multichromophoric systems, for which theory has only been developed for monomer and dimer systems.4,11−13 The aim of this paper is to develop a relatively simple theory framework to model the spectra of multichromophoric systems such as the Qy band of light-harvesting system 2 (LH2). Using this framework, we aim to understand the origin of the unexpected large cross-peaks reported in such experiments7,12,14 as well as the observed differences in line shapes.
In conventional 2DES,15,16 the system is first excited by a pair of pump pulses. Following a waiting time (T), the state of the system is then probed by a single probe pulse interrogating the effect of the pump pulses on the system. Typically, the spectra can be understood in terms of three types of signals. First a ground state bleach (GSB) signal originates from the fact that the pump pulses promote a fraction of the population to an excited state, reducing the sample absorption at their resonant frequency. Second, the population promoted to the excited state by the pump can be stimulated to emit by the probe, effectively resulting in reduced absorption at the excited frequency. Finally, the population in the excited state can be further promoted to a higher-lying excited state if such a state is present. This excited state absorption (ESA) leads to an increase in absorption at the frequency corresponding to the difference between the higher-lying and the single-excited states. When chromophores in the system are coupled, cross-peaks may arise as the excitation of one chromophore affects the possibility of exciting another chromophore. Dynamics on femto and picosecond timescales can be studied by varying the waiting time. This includes population transfer,17,18 oscillations originating from underdamped nuclear modes,19−21 electronic and vibronic coherences,19,22−24 and peak shape dynamics revealing the solvent motion.25,26
LH2 of purple bacteria consists of two rings of bacteriochlorophyll molecules.27−31 The individual bacteriochlorophyll molecules in the two rings absorb at different frequencies because of differences in the local binding sites.32−34 The high-frequency ring contains 8 to 12 bacteriochlorophyll molecules depending on the bacterial species, leading to the B800 band, named for its absorption at 800 nm. The low-frequency ring contains twice as many bacteriochlorophyll molecules as the high-frequency ring, and its absorption is red-shifted to 850 nm, resulting in the B850 absorption band. The energy transfer between these two bands is efficient despite weak coupling between chromophores in the two bands.35−40 Variations of this system exist in different bacteria and also depend on the growth conditions.41−48 In this study, we will consider a bacterial system with 27 bacteriochlorophylls, modelled after the wild-type, high-light LH2 from Rhodopseudomonas palustris.49
2DES spectra of LH2 complexes isolated from R. palustris recorded at room temperature have shown weak positive and negative regions at T = 0 fs on the lower and upper cross-peaks, respectively.50 Similar cross-peak features have been observed at room temperature in LH2 complexes isolated from another species of purple bacteria51,52 and in simulations using an excitonic model of a double-ring LH2.53 Furthermore, a clear ESA peak was observed above the B850 diagonal peak, resulting from the large degree of delocalization of the excitons because of the close packing of the B850 chromophores. In contrast, a weak ESA contribution is observed for the B800 band in which chromophores are more weakly coupled. The B850 diagonal peak is diagonally elongated at short times, with a strong negative region immediately above it and with a variation of the degree of elongation observed between different experiments. The B800 diagonal peak on the other hand is essentially round at short waiting times. Oppositely signed GSB (positive) and ESA (negative) signals in 2DES can lead to different amounts of cancellation in the cross-peaks and an overall positive or negative contribution in the two-dimensional spectrum, which does not necessarily indicate the absence of the less dominant signal. For example, in the abovementioned studies,51,52 a pulse polarization sequence was employed to isolate the excited-state dynamics, revealing a stronger contribution to the cross-peaks at early waiting times than seen with the all-parallel polarization sequence spectra at similar waiting times. Analogously, a study of LH2 isolated from Allochromatium vinosum, which contains 24 B850 bacteriochlorophyll molecules, shows that at T = 30 fs, the upper cross-peak interpreted as a dominantly GSB signal is completely cancelled out by the ESA signal.40 However, a lower GSB cross-peak is present at early times for electronic couplings as small as ∼20 cm–1.54
Apart from the abovementioned 2DES studies, early pump-probe studies of isolated LH2 complexes extracted from a number of species of purple bacteria show simultaneous bleaching of B800 and B850 bands at early waiting times after excitation of the B800 band. One- and two-color femtosecond pump-probe studies on LH2 complexes isolated from Rhodobacter sphaeroides and R. palustris at room temperature and 77 K revealed GSB signals at short pump-probe delays when probing the B800 and B850 bands upon B800 band excitation.55 Similarly, spectrally resolved pump-probe experiments have shown a simultaneous bleach of both the low-energy and high-energy bands of LH2 complexes isolated from R. palustris grown under four different light intensities.56 In a different species of purple bacteria, pump-probe spectra at 77 K show the simultaneous bleaching of both the B800 and the B850 bands at zero waiting time after excitation of either the carotenoids or the B800 band.57
Recent F-2DES experiments7,12,14 have reported early waiting time spectra of detergent-isolated LH2 exhibiting distinct positive cross-peaks, leading to the suggestion of unexpectedly large delocalization of the initial excitation.12 Furthermore, the B850 band was reported to be round at early times in these experiments. The presence of only positive signals in the F-2DES spectra puts it in stark contrast with the findings of conventional 2DES studies of LH2 complexes discussed above. For a simple dimer system, differences between F-2DES and 2DES are known to arise from the additional light matter interactions that take place in F-2DES,3 which lead to negative ESA pathways resulting in population on the doubly excited state as well as positive ESA pathways that yield population on the singly excited states. The overall contribution in the total F-2DES spectra depends on the relative quantum yields of the two kinds of ESA pathways. In the case of LH2, it has been suggested that the contributions of these pathways are almost equal, therefore canceling each other out and leaving a clean GSB signal in the cross-peak positions.12 As discussed above, such a GSB signal has been observed in the pump-probe studies and is seen as a weak cross-peak in conventional 2DES. Along these lines, recent theoretical works, based on a simplified dimer model, support the assertion that the presence of cross-peaks in the F-2DES experiment corresponds to GSB signals indicating a common ground state.11,13 Here, we will examine the origin of these effects by developing the theory for protein structure-based multichromophore simulations of F-2DES and 2DES spectra of the LH2 complex.
Methods
We employ the simplest possible Frenkel exciton Hamiltonian for a system with a collection of N chromophore sites of the form
| 1 |
Here, ϵi(t) is the fluctuating site energy of chromophore i, Jij(t) is the fluctuating coupling between two chromophores, and bi† and bi are the usual Paulionic creation and annihilation operators. The chromophores interact with the applied electric field E⃗(t) through the transition dipoles μ⃗i(t), which might fluctuate in time as well. In the Hamiltonian (eq 1) states with a different number of excitations are only coupled when an external field is present. When the external field is vanishing, the Hamiltonian is therefore block diagonal and the different blocks can be treated separately. We denote the block concerning the ground state, Hgg, the singly excited states, Hee, and the doubly excited states, Hff. We will consider interactions with an external electric field tuned to be resonant with the change of 1 excitation quantum. In this case, we need the transition dipoles between the ground state and the singly excited states μge and those between the singly and doubly excited states μef.
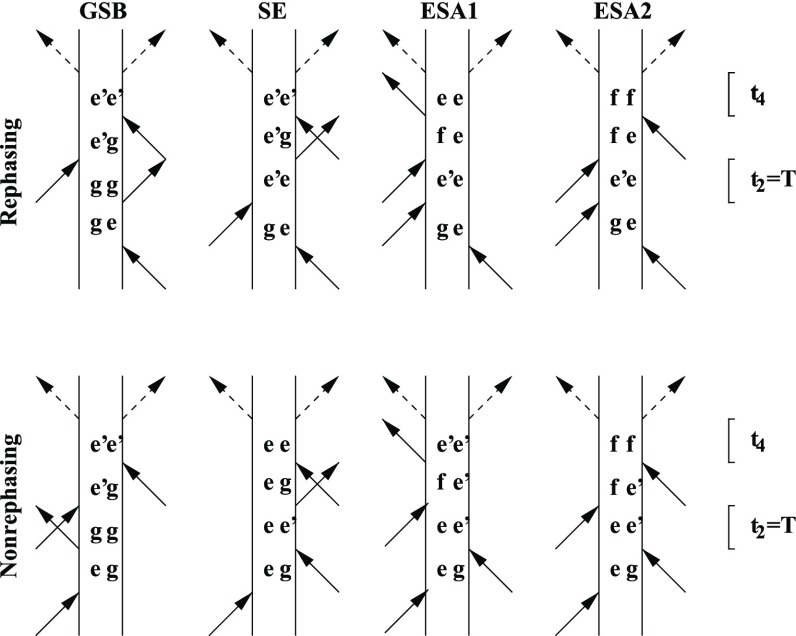
It is possible to combine the power of fluorescence spectroscopy with that of two-dimensional spectroscopy.3,4 If one applies four laser fields to the sample and then waits and measures the photons emitted, the signal will be determined by six light–matter interactions corresponding to the Feynman diagrams in Figure 1. The corresponding response functions can be written using the Feynman rules. In practice, we will only be interested in the frequencies of the coherence times between the first and second interactions, the waiting time between the second and third interactions, and the coherence time between the third and the fourth interactions. After the fourth interaction, the system will be left to relax, and it will typically reach one of the lowest energy levels before emission. Alternatively, the excitation may be lost in a nonradiative process. This means that we are really just interested in the so-called quantum yield, that is, the number of photons emitted from each diagram. In the GSB, stimulated emission (SE), and ESA1 diagrams the system is in the single excitation manifold after the fourth interaction. As the emission time is typically on the order of nanoseconds, we expect that the system will have fully relaxed before emitting a photon, and the quantum yield is in most cases identical for all populations. We can denote this quantum yield Q1. This number is unity if all excited states lead to the emission of a photon and is zero if all the energy is lost due to nonradiative relaxation processes. The system may be in a coherence between two different singly excited states after the fourth interaction, however, such coherence will die out much faster than emission can take place, enabling us to neglect such contributions to the signal. For the EA2 diagrams, the system is in the doubly excited manifold after the fourth interaction. Again, we can neglect any signal emitted due to coherent excitations. However, the system can formally emit two photons leading to a maximum quantum yield of 2. If the two excitations of the system relax independently of each other, we expect a quantum yield of Q2 = 2Q1. However, the relaxation pathways accessible to double excited states are typically much larger than for single excited ones, and Q2 may equal Q1 if exciton–exciton annihilation leaves one exciton behind. Alternatively, Q2 may be negligible if exciton–exciton annihilation destroys both excitons.
Figure 1.
Feynman diagrams associated with fluorescence detected two-dimensional spectroscopy. The top row shows the rephasing diagrams, and the bottom row shows the nonrephasing ones. The vertical lines represent the bra and ket states. g is the ground state, and e/e′ and f represent states in the first and second excitation manifold, respectively. The full arrows are interactions with the applied laser pulses, whereas the dashed arrows are deexcitations due to spontaneous emission. The second time delay (t2) is explicitly indicated by the interval T. The laser pulses interact at times τ0 to τ4 starting from the bottom in each diagram.
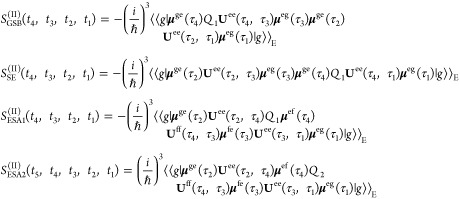
Using the assumptions outlined above, the response functions governing the two-dimensional fluorescence detected spectra are then given by
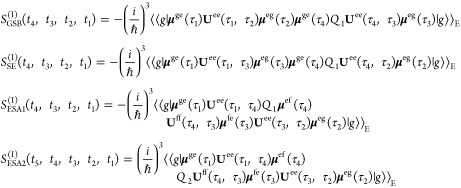 |
2 |
 |
3 |
Formally, the quantum yield factors in these expressions are matrices determined by
In the last equation, Ufe signifies that one of the excitations is lost either by emission through the first term, nonradiative processes, or exciton–exciton annihilation. The approximation discussed above essentially means that these matrices can be assumed to be diagonal and therefore reduced to a scalar quantity as all states have sufficient time to relax before emission of the photons. Assuming the impulsive limit,16 the F-2DES signal is obtained by Fourier-transforming the coherence times, t1 = τ2 – τ1 and t3 = τ4 – τ3, and integrating over the fluorescence detection time, t4 = τ5 – τ4. The waiting time T is then identical to the time delay t2 = τ3 – τ2. When the fluorescence lifetime is much longer than the relaxation dynamics within the system, Q1 and Q2 are, however, well-approximated as scalar constants as discussed above.3,4 In the present paper, we will consider only isotropic samples, with parallel polarization of all applied laser pulses. This implies an average over the different dipole components, as described elsewhere.58 The present scheme is equally applicable to calculate spectra, where the polarization of the first and second pulse pairs are perpendicular in the cross-polarization scheme.59 Such polarization schemes may be useful in studying exciton transport and highlighting coherent excitations.23,51,52
It may be helpful to compare the F-2DES response with the conventional 2DES spectra, which are given by the sum of a GSB contribution, an SE contribution, and an ESA contribution, with the opposite sign of the EA1 diagram. As the conventional 2DES spectrum does not involve the fluorescence detection process, it can be compared to setting the quantum yield factors equal to1. We introduce a short-hand notation with RGSB, RSE, and RESA denoting the conventional GSB, SE, and ESA signals. The two types of ESA signals in F-2DES are denoted RESA1 and RESA2. The conventional 2DES spectrum is then given by R2DES = RGSB + RSE + RESA. In a similar fashion, the F-2DES spectrum is given by
 |
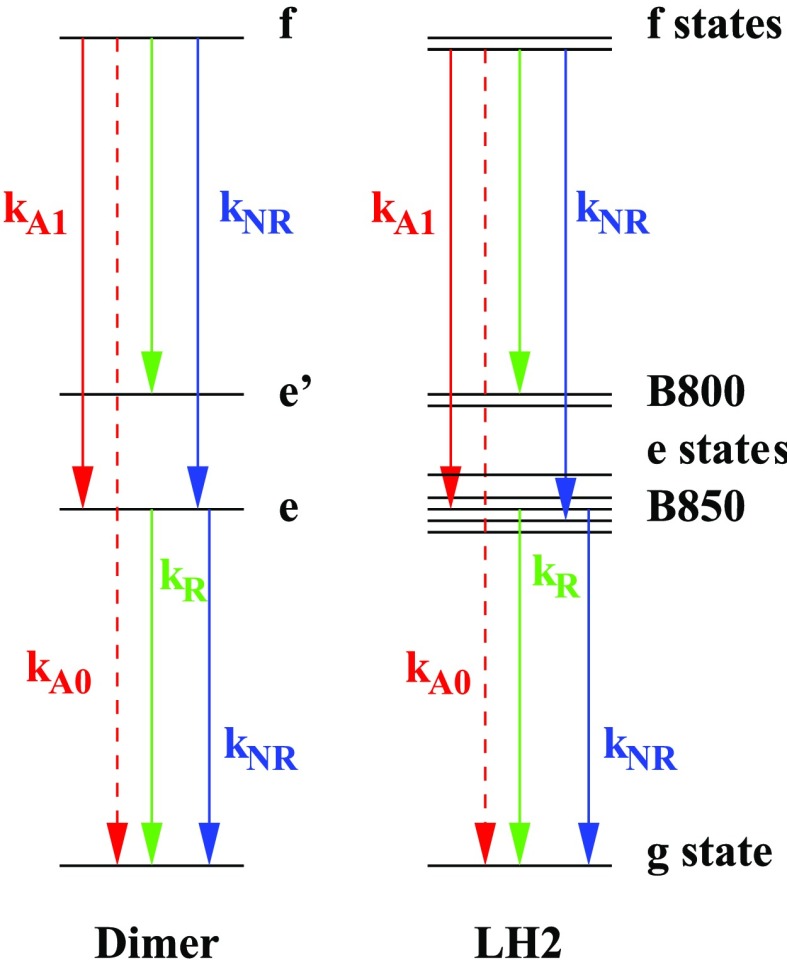
Here it was assumed that the ESA processes in F-2DES are approximated by the normal 2DES process multiplied by a quantum yield factor, that is, −RESA1 = Q1RESA and RESA2 = Q2RESA. For the ESA1 process, the signal contribution is of the opposite sign in F-2DES compared to 2DES. When a kinetic model is assumed with rates (illustrated in Figure 2) for exciton–exciton annihilation (kA0 and kA1), a radiative rate (kR), and a nonradiative rate (kNR) as derived in eq 18, the F-2DES signal can be expressed as
| 4 |
Figure 2.
Diagrams illustrating the simplified kinetic scheme used to describe the dynamics during the t4 time delay. For simplicity, it is assumed that the thermalization within the e and f manifolds is so fast compared to the rates of transfer between manifolds that one can use the thermal average rates between different excitation manifolds. The radiative rates are kR, the nonradiative rates are kNR, the exciton–exciton annihilation rate destroying both excitons is kA0, and the exciton–exciton annihilation rate leaving one exciton behind is kA1. For simplicity, it is assumed that the radiative rate between the f and e manifolds is identical to that between the e and g manifolds.
The signal can be understood as the sum of the normal 2DES spectrum weighted by the quantum yield, with an additional signal arising from the exciton–exciton annihilation occurring during t4. This term can be explained as the signal lost due to exciton–exciton annihilation during the detection process. The annihilation factor, A, is very similar to that derived in ref (11) with the only difference being that here we have included the potential that annihilation may remove both excitons. More complex models may be derived, when the rates depend significantly on the initially excited state. In this paper, we calculate the F-2DES and conventional 2DES spectra using the numerical integration of the Schrödinger equation approach60 using scalar values of Q1 and Q2.
The experiments reported here were performed using the experimental setup reported in ref (14). Briefly, a white light continuum is generated by focusing the 1 MHz 1040 nm output of a tunable repetition rate laser amplifier (Spectra Physics, Spirit 1040-16) into a 4 mm YAG crystal, followed by selecting a part of the white light continuum using a combination of OD4 650 nm long pass and OD4 875 nm short pass optical filters (Edmund). The resulting beam is collimated and routed into the experimental setup described in detail in ref (14). The collinear pulse train, precompressed to ∼15 fs using a SLM pulse shaper (MIIPS640P, Biophotonic Solutions), is reflected from a 875 nm dichroic mirror (Semrock) toward an air objective (Olympus LUCPlanFLN 40×, NA0.6) and is focused on the sample to a focal spot of full width at half-maximum (fwhm) ∼1.3 μm as determined by a fluorescence image of a 0.5 μm fluorescent bead (Fluoresbrite 763 Carboxylate Microspheres). The power per pulse incident at the sample is ∼1.3 μW such that the average excitation probability per LH2 ring is ∼0.22. In a Poisson distribution of the number of excitations per LH2 ring calculated with this average excitation probability, the probability of one excitation per LH2 ring is ∼18% and the probability of two excitations per LH2 ring is ∼2%. The sample cuvette (Starna, 48-Q-0.2) has a 200 μm path length, through which the sample was circulated using a peristaltic pump (Masterflex model 07516-00) at an average flow rate of ∼190 mL/min. This average flow rate corresponds to an average velocity of ∼1.98 μm/μs through the 8 mm × 0.2 mm cuvette cross-section. With this average flow velocity and ∼1.3 μm fwhm focal spot size, each LH2 ring should experience an average excitation by only one laser pulse. However, assuming a laminar flow profile, slower flow rates of LH2 complexes at the boundaries of the cuvette may still experience excitations from multiple pulses. The focus of the objective is adjusted and moved into the sample, such that it is kept between the two cuvette boundaries. The fluorescence is collected in the epi-fluorescence geometry and optically filtered using tunable OD6 887 long pass filters (Semrock) centered at 878 nm. It was ensured that the combination of excitation light, laser transmission through the 875 nm dichroic mirror, and the 887 long pass filter does not lead to any stray laser light at the APD detector (Hamamatsu C12703-01).
The reference frequency for each interferometer in the setup was centered at 825 nm. The time delay between the first and second pulse, t1, and the time delay between the third and fourth pulse, t3, was scanned from 0 to 120 fs in steps of 5 fs. The T delay, between the pump and probe arms, is fixed at T = 0 fs. The resulting signal at each t1, t3 combination is sent to the lock-in amplifier (HF2LI, Zurich Instruments) for phase-sensitive lock-in detection. The total time to collect 24 × 24 time points is ∼7 minutes per two-dimensional spectrum for a total of 20 lock-in acquisitions for each time point. The obtainable spectral resolution after Fourier transforming the 24 × 24 time grid is ∼139 cm–1 and is limited by the broad sample absorption spectrum at room temperature. In the data processing, the t1, t3 scan is truncated at 100 fs (where the signal falls to <5%) with a hyperbolic tangent filter and zero padded to have 64 points along each time dimension with the corresponding processed spectral resolution of ∼104 cm–1. As noted above, the spectral resolution is limited by the sample itself because the signal decays to <5% within ∼100 fs t1 or t3 time delay.
Aliquots of detergent-isolated LH2 complex from R. palustris (strain 2.1.6) grown under high-light conditions were stored at −80 °C. The details of bacterial growth conditions and LH2 protein isolation are described in.56 For the experiments, the aliquots were dissolved in 0.15% w/v DM detergent in a 20 mM Tris-HCl buffer (pH 8) at room temperature. The final optical density (OD) in a 1 mm pathlength cuvette at 804 nm was ∼0.09. The sample was stored at 4 °C for experiments on multiple days. For the sample flow rates and fluences used in the experiments, the OD of the sample before and after the experiment did not show any measurable degradation due to photobleaching of the sample.
Results
To simulate the F-2DES spectrum of the LH2 system, we begin with the crystal structure taken from the 1kzu protein database file.28 The transition-dipoles were taken to be 4.481 Debye and in the direction from the nitrogen atom in the bacteriochlorophyll molecules named NB in the protein database file to the nitrogen atom named ND and located on magnesium. The three-fold symmetry specified in the data file was used to construct the full 27 chromophore system. The B850 chromophores were given an average absorption frequency of 12 145 cm–1, whereas a 330 cm–1 higher frequency was assigned to the B800 chromophores. Both chromophore types were coupled to an overdamped Brownian oscillator bath with a 250 fs correlation time and 290 and 140 cm–1 disorder magnitudes for the B850 and B800 chromophores, respectively. These numbers were obtained starting with disorder values from the literature61 and adjusting them to match the experimental absorption spectrum. The correlation time was estimated from previous atomistic simulations.34 The excitonic couplings were determined using the dipole–dipole coupling model. We realize that it may be possible to parameterize a more accurate model for the given LH2 system, however, the model was deliberately kept simple to emphasize that the observed spectral features are not determined by model details. The largest coupling between B850 and B800 sites is +17 cm–1, the nearest neighbor coupling in the B800 ring is −13 cm–1, and the largest nearest neighbor coupling in the B850 ring is 205 cm–1. A 0.6 ns long Hamiltonian trajectory with 3 fs time steps was constructed, and the spectra were obtained by averaging the spectra over samples separated by 150 fs along the trajectory. The coherence times were varied from 0 to 189 fs in 3 fs steps. For the present simulation, the waiting time was kept fixed at 0 fs. A 300 fs exponential apodization function was used to suppress possible noise.
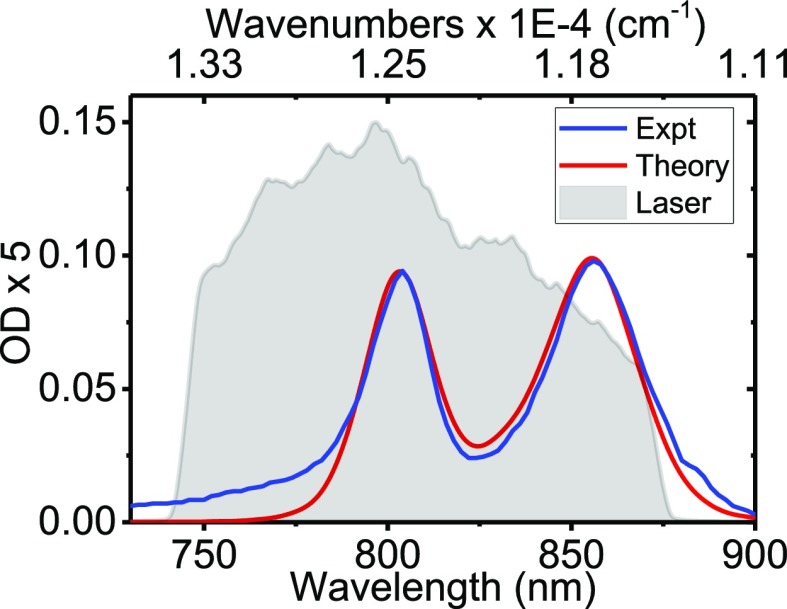
The simulated and experimental linear absorption spectra are presented in Figure 3. The main features and relative intensities of the two bands are well-reproduced. At 11 250 cm–1, a small feature is observed in the experiment but not in the theory. This is likely a transition to the k = 0 exciton state,62,63 which is optically forbidden for a perfectly symmetric ring with the dipoles lying in the plane of the ring. At the high-frequency side of the spectrum, a tail is observed in the experiment. This may originate from the vibronic features or charge-transfer states not included in the model.64 The spectrum of the laser pulses used in the F-2DES spectra is shown for comparison.
Figure 3.
Calculated and measured absorption spectrum of the LH2 complex at 300 K. The laser spectrum used for the F-2DES experiments is shown for comparison.
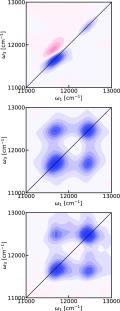
The simulated conventional 2DES spectrum at T = 0 fs is presented in Figure 4. The 2DES spectrum exhibits diagonal features from the B850 and B800 bands, which are clearly elongated in the diagonal direction. Furthermore, an ESA feature is observed above the diagonal B850 band. This feature is a signature of the degree of delocalization of the excitons on the 18 B850 chromophores. A comparable feature connected with the B800 feature is not visible. Clearly, no prominent cross-peaks are observed between the two diagonal bands, consistent with the observations of weak cross-peaks in earlier experimental and theoretical reports of the two-dimensional electronic spectra of LH2 systems at zero waiting time.34,50−53,65,66
Figure 4.
2DES spectra of LH2 at T = 0 fs with parallel polarization. Blue color indicates bleach signal, whereas red color indicates induced absorption. The contours change color for every 10% of the maximum intensity in the individual plot. Top: Simulated 2DES spectrum. Middle: Simulated F-2DES. Bottom: Experimental F-2DES spectrum.
For LH2, the exciton–exciton annihilation time is on the order of 1 ps,67 and the result of an annihilation event has been reported to be a single surviving exciton.67 Therefore, Q2 can be well-approximated to equal Q1 in this system. The F-2DES spectrum is therefore given by the sum of the GSB and SE contributions. The simulated and experimental F-2DES spectra are shown in Figure 4 (middle and bottom rows). It is evident that these spectra exhibit very similar features and that they both differ significantly from the conventional 2DES spectrum. Both spectra exhibit diagonal peaks, which are very round in contrast to the diagonally elongated peaks in the 2DES spectrum. In addition, the conventional 2DES spectrum shows a strong ESA feature immediately above the B850 diagonal peak. Given our assumption that Q2 = Q1, there is no ESA feature in the simulated F-2DES spectra, which shows a good qualitative agreement with the experimental spectrum. Still, in both experiment and theory, the B850 peak may have a slight elongation in the diagonal direction. Furthermore, the experimental as well as theoretical F-2DES spectra exhibit very clear cross-peak features.
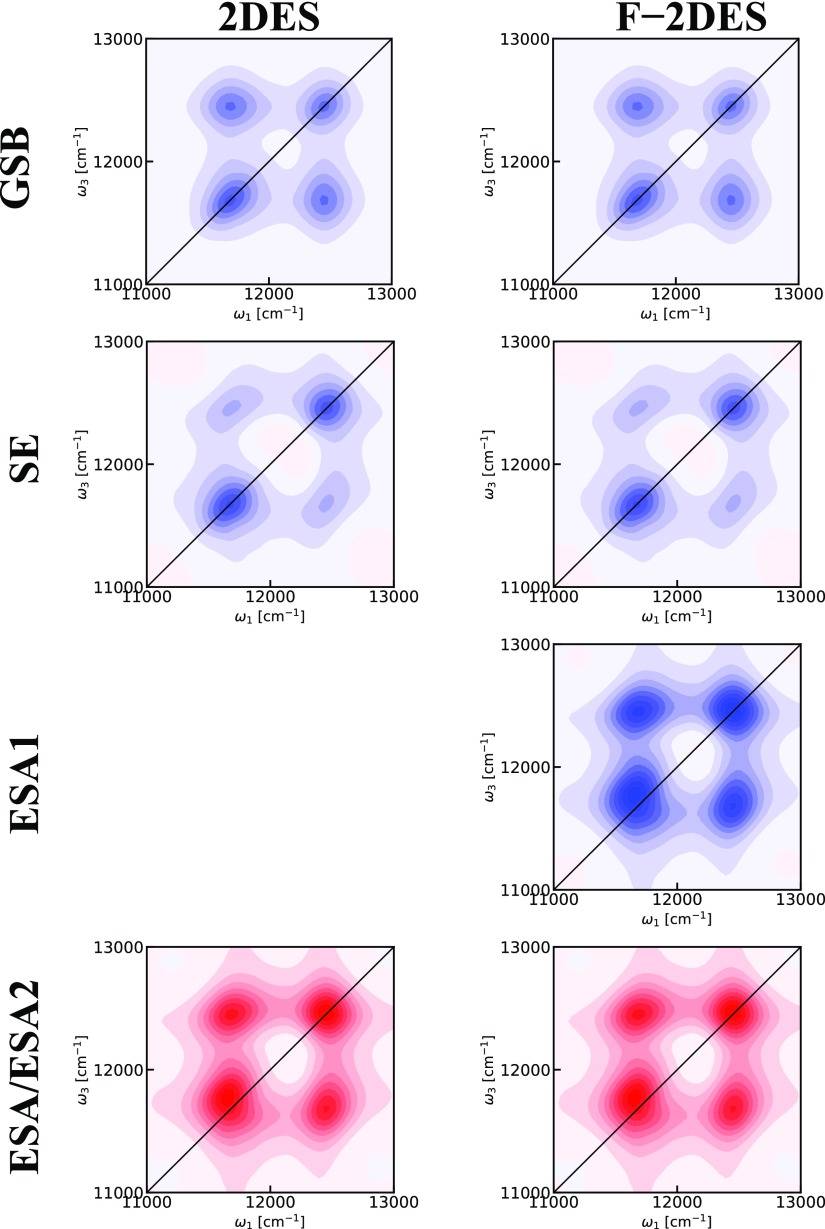
We analyze the origin of the spectral features in the F-2DES spectrum by comparing the GSB, SE, and ESA contributions in Figure 5. The GSB signal exhibits a mirror symmetry with respect to the diagonal and large cross-peaks, as expected from the related Feynman diagrams in Figure 1. The SE contribution also exhibits a diagonal mirror symmetry, but shows only weak cross-peaks. These cross-peaks arise from the rephasing diagram, where the system will be in a coherence between a B850 and B800 state during t2. These cross-peaks are, thus, expected to exhibit strongly damped beating at the difference frequency between the B850 and B800 states. In contrast, the ESA signal is not mirror symmetric across the diagonal. In particular, the B850 peak is skewed toward higher ω3 frequencies. This is responsible for the strong negative region immediately above the B850 diagonal peak in the conventional 2DES spectrum and is caused by the exciton delocalization among the B850 bacteriochlorophylls. The ESA cross-peaks are strong, which leads to the almost perfect cancellation of the cross-peaks in the conventional 2DES spectra. This analysis illustrates that the cross-peaks in the F-2DES originate predominantly from the GSB cross-peak contributions, with a minor SE component. This can be understood as occurring due to the exciton–exciton annihilation, efficiently reducing the total ESA contribution to the F-2DES spectrum, thereby revealing the clean GSB and SE signals. In contrast, in the conventional 2DES spectrum, the oppositely signed ESA contribution largely cancels the GSB and SE cross-peaks.
Figure 5.
Components contributing to the 2DES spectra of LH2 at T = 0 fs with parallel polarization. Blue color indicates bleach signal, whereas red color indicates induced absorption. The contours change color for every 10% of the maximum intensity of the ESA contributions. For 2DES spectra, the GSB, SE, and ESA signals contribute equally. For F-2DES spectra, the ESA1 signal contributes with a prefactor of 1 and the ESA2 signal contribution depends on the efficiency of exciton annihilation given by the factor Q2/Q1, which in Figure 4 is assumed to be 1 as well.
In contrast to the elongated diagonal line shapes observed in the 2DES spectra, round diagonal line shapes are seen in both simulated and experimental F-2DES spectra in Figure 4. In the 2DES spectra, the elongation in the B850 peak can at least partially be understood as arising from the interference between the oppositely signed GSB and ESA signals. However, in the B800 band, the chromophores are much more weakly coupled than in the B850 band, and the elongation is dominated by the inhomogeneous distribution of the chromophore site energies. As seen in the individual signal contributions in Figure 5, the round diagonal peak shapes in the F-2DES can be understood as arising due to intraband GSB and SE cross-peaks between different excitonic states sharing a common ground state. As the intraband annihilation of exciton pairs is very efficient, we also expect the mutual cancellation of ESA signals to contribute to the appearance of strong intraband cross-peaks. This highlights the fact that both the sensitivity to annihilation processes and the different ways in which the signal contributions combine underlie the differences between F-2DES and conventional 2DES spectra.
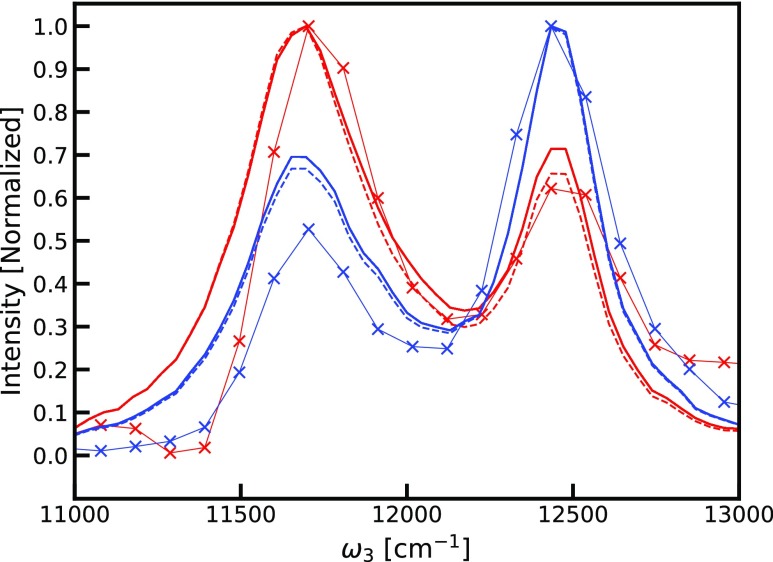
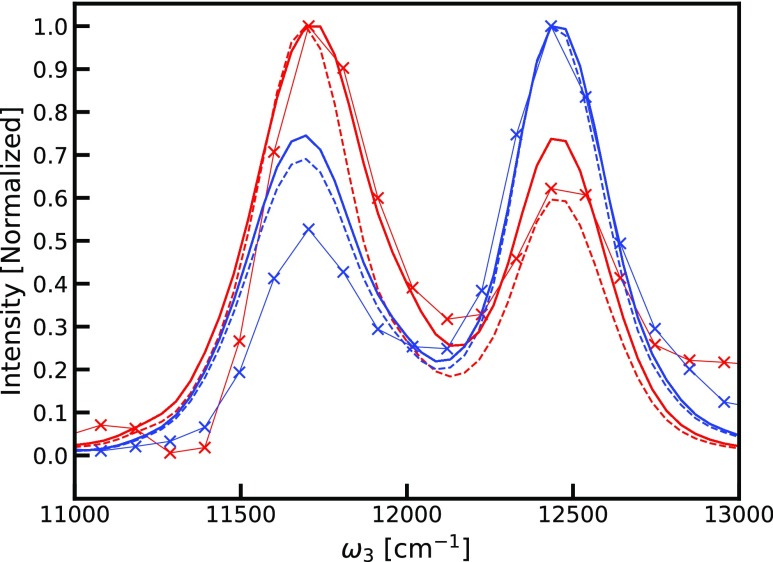
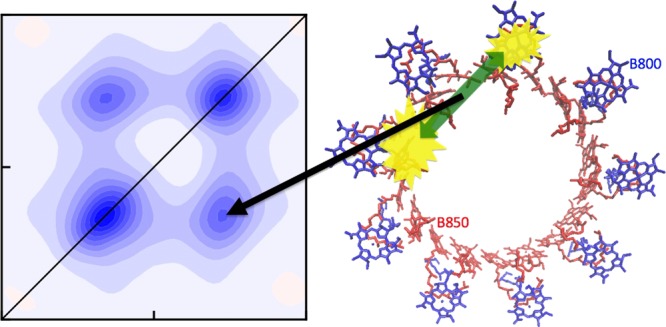
We further compare the simulation and experimental data using cuts through the peaks along the ω3 axis. The slices are normalized to the diagonal peak height in the individual slices shown in Figure 6. The relative cross-peak intensities in the experiment are ∼50–60% of the diagonal intensities, whereas in the simulations, the corresponding values are ∼65% (assuming A = 1). This discrepancy could arise due to overestimation of the annihilation factor. We, therefore, constructed the same plot for the highest value of the annihilation factor, A = 2, corresponding to the disappearance of both excitons upon annihilation. This increases the cross-peak intensities, in poorer agreement with the experiment. Other sources of this discrepancy may include laser pulse overlap effects, pulse spectrum, errors in the Hamiltonian used, and neglect of coupling with other states, including states with a charge-transfer character. Considering that the B850 diagonal peak is stronger than the B800 diagonal peak in the experiment, in contrast to the intensity relation in the absorption spectra, the pulse shape likely plays an important role. Still, the qualitative agreement is very good, and the simulations explain the enhancement of the cross-peaks as compared to conventional 2DES. Comparable slices through spectra calculated with all couplings between B850 and B800 chromophores set to zero are shown in Figure 7 (but keeping A = 1 and A = 2), indicating that the cross-peak intensity is only very weakly reflecting the excitonic coupling. Counterintuitively, the cross-peak amplitude actually increases slightly when the couplings are reduced. We note that the cross-peaks even exist for zero coupling when A is nonzero because a common ground state is assumed between the B800 and B850 rings. This is supported by reports of simultaneous bleaching of the two bands in spectrally resolved pump-probe measurements.55−57 Theoretically, if the coupling between the B850 and B800 bands is zero and they do not have a common ground state, there will be no cross-peaks and the annihilation factor would also become zero, as the annihilation rates will be zero. However, it is only through this indirect way that the excitonic couplings will be reflected in the cross-peak intensities. The A factor may still be significant as the annihilation rate may be high compared to the fluorescence rate even for very small couplings or in the presence of a common exciton acceptor state. This implies that cross-peaks may be present even when the direct coupling is almost vanishing, as long as excitons created in the involved states have a pathway to annihilate within the fluorescence lifetime. The key annihilation process responsible for the visibility of the GSB features is the process illustrated in the cartoon in Figure 8. The double-excited states created by the simultaneous excitation of an exciton in the B800 band and an exciton in B850 of the same LH2 complex have a very short lifetime as the two excitons are in close proximity and easily annihilate with each other. Because of the annihilation process, this state does not result in the fluorescence of two photons that would otherwise interfere with and cancel the GSB cross-peak signal between the two bands.
Figure 6.
Slices through the simulated (dashed line A = 1, solid line A = 2) and experimental (thin line with X symbols) F-2DES spectra through the peaks along fixed values of ω1 (red 11 700 cm–1, blue 12 430 cm–1).
Figure 7.
Slices through simulated spectra with the coupling between B850 and B800 chromophores set to zero (dashed line A = 1, solid line A = 2) and experimental (thin line with X symbols) F-2DES spectra through the peaks along fixed values of ω1 (red 11 700 cm–1, blue 12 430 cm–1).
Figure 8.
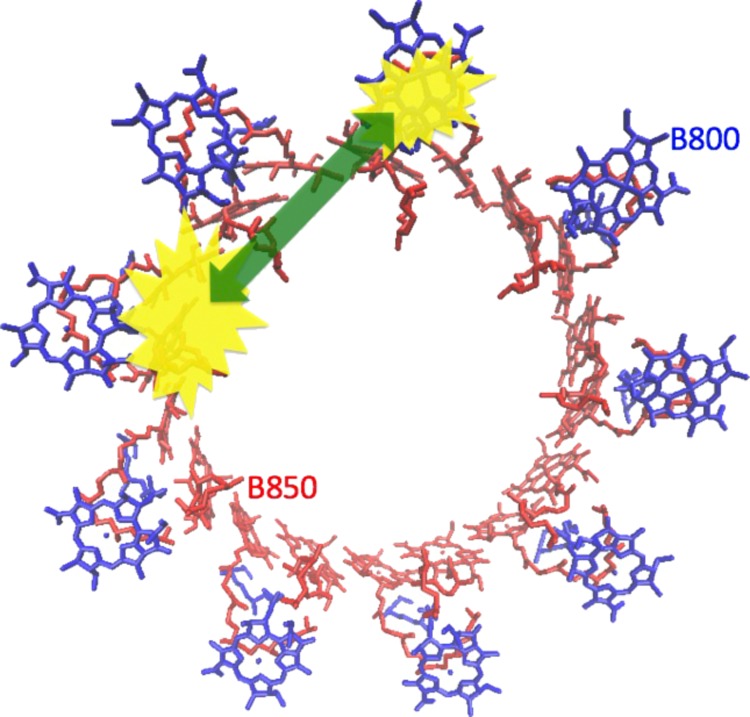
Cartoon illustration of the LH2 system (B850 chromophores in red and B800 chromophores in blue) with a double exciton state consisting of one exciton (yellow) in each band. The green arrow illustrates the annihilation process leading to a short lifetime of the state and efficiently quenching the fluorescence. In reality, the excitations in the B850 band are delocalized over many chromophores.
For LH2, the fluorescence quantum yield has been
reported to be
∼10%, whereas the fluorescence and radiative lifetimes have
been reported to be 986 ps and 10 ns, respectively.68 A typical exciton–exciton annihilation time transforming
two singlet excitons to one is 0.59 ps.67 Using these input parameters in the equation for the annihilation
factor  (assuming kA0 to be 0) yields 0.9987, justifying the use of A = 1 above.
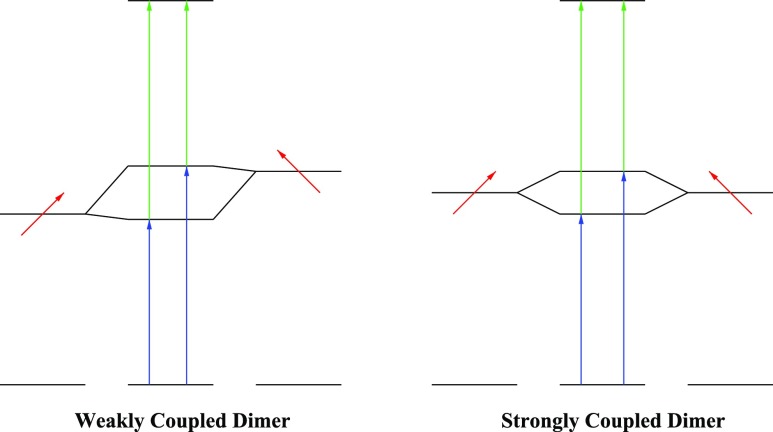
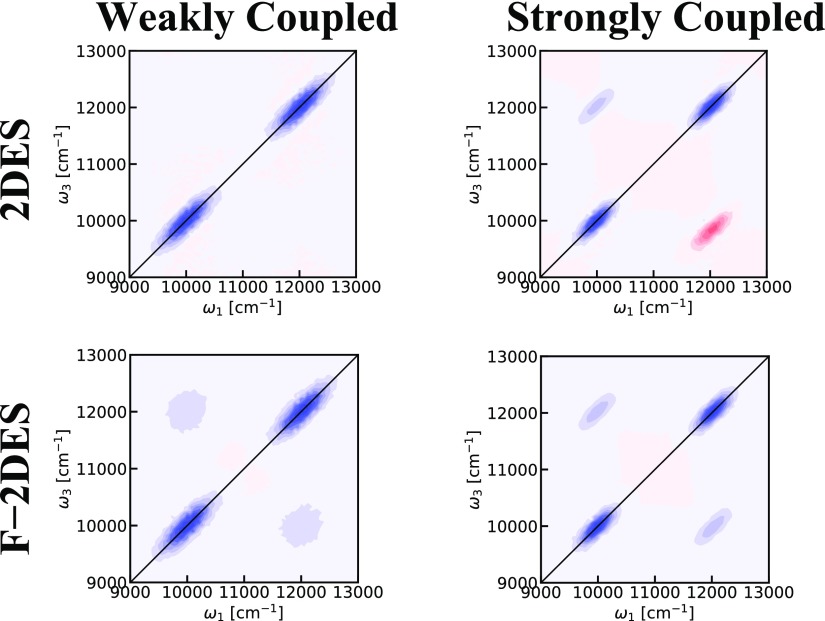
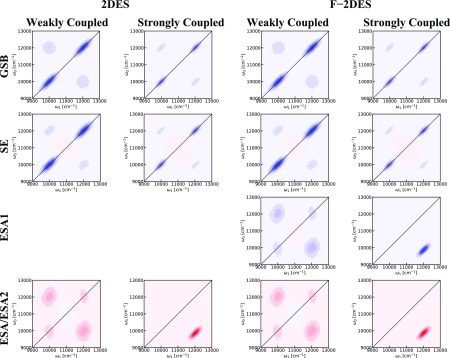
To investigate the effect of coherent delocalization, we simulated two dimer systems with different coupling strengths. The energy diagrams of the two systems are illustrated in Figure 9. For the weakly coupled system, the two site energies were set to 10 000 and 12 000 cm–1, whereas the coupling was set to 200 cm–1. Each site was coupled with an independent overdamped Brownian oscillator with a correlation time of 200 fs and a coupling strength of 300 cm–1. For the strongly coupled system, the site energies were set to 11 000 cm–1 and the coupling to 1000 cm–1. In both systems, the transition dipoles were chosen to be perpendicular to suppress effects of intensity borrowing. Dimer results for more general choices of angles can be found in ref (11). The results are shown in Figures 10 and 11, where it has been assumed that A = 1 for the F-2DES spectra. The total 2DES spectra in Figure 10 show that for the weakly coupled system, similar to the cross-peaks in the LH2 2DES spectrum, no significant cross-peaks are seen. In contrast, the total 2DES spectrum for the strongly coupled dimer shows distinct T = 0 fs cross-peaks. Furthermore, for the strongly coupled case, an ESA peak is observed below the diagonal, consistent with the positive value of the coupling and the geometry of the system.69 Both for weak and strong couplings, the peaks on the diagonal are diagonally elongated. The diagonal elongation in the strong coupling case is smaller due to exchange narrowing. Similar elongated diagonal features are also seen for the F-2DES spectra in Figure 10. However, in the case of F-2DES spectra, cross-peaks are seen for both weak and strong coupling cases. For the weak coupling case, the cross-peaks are round, reflecting the fact that the two involved eigenstates are dominated by the individual site energies, which were chosen to be uncorrelated. In the strong coupling case, the cross-peaks are diagonally elongated because in this case, the eigen energies, to a good approximation, are given by the average of the monomer energies plus or minus the coupling. The elongation of the diagonal peaks in these dimer simulations illustrates the point that these peaks have a single-state origin, and there are no cross-peaks between states within the band. This is in contrast to what is seen in LH2 and indicates that it is crucial to involve all levels in the simulations. These observations also suggest that a comparison of 2DES and F-2DES spectra may be helpful in revealing the multistate origin of bands. In Figure 11, the decomposition of the two-dimensional spectra into GSB, SE, and ESA is shown, illustrating the origin of the different peaks. As for LH2, this decomposition highlights the fact that the F-2DES cross-peaks originate from the lack of interference of GSB and SE pathways with the ESA pathways because of the mutual cancellation of ESA pathways. As this interference is predominantly determined by the exciton–exciton annihilation rate compared to the nonradiative decay rate, F-2DES may be particularly well-suited to detect weak couplings between chromophores separated by large distances, resulting in exciton annihilation, which can manifest as unobscured ground-state signals. F-2DES may be less suited for detection of T = 0 fs ESA signals. Additionally, in F-2DES, the T = 0 fs SE signals may be covered by strong GSB signals.
Figure 9.
Energy diagrams for the employed dimer models. Left: Weakly coupled dimer. Right: Strongly coupled dimer. The black lines indicate the energy levels of the individual chromophores coupled to form the composite dimer energy levels in the middle. The red arrows indicate the directions of the transition dipole moments of the monomers, and the vertical blue and green arrows indicate the transitions in the dimer systems.
Figure 10.
Two-dimensional spectra of model dimers at T = 0 fs. The contours change color for every 10% of the maximum intensity in the individual plot. Left: Weakly coupled dimer. Right: Strongly coupled dimer. Top: Conventional 2DES. Bottom: F-2DES spectra.
Figure 11.
Two leftmost columns are the components of the conventional two-dimensional spectra of model dimers at T = 0 fs. The contours change color for every 10% of the maximum intensity for the most intense component (EA for strong coupling and SE for weak coupling.). The two rightmost columns are the components of the fluorescence-detected two-dimensional spectra of model dimers at T = 0 fs plotted in the same way as the two leftmost columns.
Time-Resolved F-2DES Spectra
In the F-2DES simulations of LH2 presented above, we have considered exciton–exciton annihilation processes that may occur within a single LH2 complex. For in vivo studies, where excitons created on neighboring complexes may diffuse throughout the membrane, additional annihilation routes must also be considered. The desire to resolve different exciton–exciton annihilation processes and obtain additional information about the system evolution prior to fluorescence emission (during t4) motivates11 the use of time-resolved fluorescence-detected two-dimensional electronic spectroscopy (TRF-2DES). Experimentally, this can be achieved by gating the fluorescence detection.70−72 In the ideal case of short gating pulses, the TRF-2DES spectrum is determined by the time-dependent quantum yield factors with a given fixed value of delay, t4. Assuming the kinetic model given in the Appendix, the resulting expressions for the TRF-2DES are
 |
The time-dependent annihilation factor A(t) determines the ESA contribution, and from the definition above, it can be written as
 |
5 |
It should be emphasized that one can expect the simple kinetic picture illustrated in Figure 2 to break down when one looks at short t4 delays, where thermal equilibration within the bands has not had time to occur. This may allow the extraction of different relaxation rates from the different involved states from the experimental data when monitoring the different behavior of the cross-peaks between different states as a function of the fluorescence time t4. This will also require a more elaborate kinetic model than the one used here as well as significantly more complex simulations, as separate spectra need to be simulated for each possible state present at time t4. Furthermore, the TRF-2DES spectra may contain signals from coherences present at very early t4 times. TRF-2DES is thus well-suited to study state-resolved exciton–exciton annihilation and may provide a powerful tool for studying exciton–exciton annihilation and exciton diffusion in a wide range of systems.11,73−78
Conclusions
In this paper, we demonstrated a method for simulating the F-2DES spectra of multichromophoric systems. The method is based on the numerical integration of the Schrödinger approach60 and can be expected to be well-suited for the study of dynamics including line shape changes due to solvent fluctuations. The method was applied to the LH2 system for which measured spectra have been reported.7,12,14 The calculated LH2 spectra reproduced the experimental ones qualitatively well. In particular, the large intensity of the cross-peaks between the two excitonic bands was well-reproduced. These cross-peaks can be understood as arising from the efficient exciton–exciton annihilation of exciton pairs created on the same LH2 complex by the perturbative excitation. This causes cancellation of the ESA signal to reveal a clean GSB signal between the B800 and B850 bands. Our simulations show that the ground-state cross-peaks are only weakly dependent on the excitonic coupling, as long as a common ground state is assumed. Furthermore, the round line shapes observed experimentally were well-reproduced, whereas the diagonally elongated B850 peak observed in conventional 2DES was reproduced with the same Hamiltonian as well. This reflects the fact that the two excitons in the same band efficiently annihilate, no matter what their frequency difference is. The round shape, thus, reflects the fact that both bands consist of multiple exciton states that can be simultaneously excited. The results were further supported by simple dimer models demonstrating that the fluorescence-detected technique highlights different information than the conventional method. F-2DES may be particularly well-suited for detecting weak long-range interactions resulting in exciton annihilation. In addition, comparative studies of 2DES and F-2DES spectra promise insight into the single or multistate structure of absorption bands in multichromophoric systems. Finally, we suggest the development of TRF-2DES to study state-resolved exciton–exciton annihilation and exciton diffusion.
Acknowledgments
The authors are grateful to T. Pullerits, O. Kühn, and P. Maly for fruitful discussions. V.T., Y.A.M., and J.P.O. acknowledge the AFOSR Biophysics program for support of this research under grant FA9550-15-1-0210. R.J.C. and A.T.G. gratefully acknowledge support from the Photosynthetic Antenna Research Center, an Energy Frontier Research Center funded by the U.S. Department of Energy, Office of Science, Office of Basic Energy Sciences under Award Number DE-SC 0001035.
Appendix
A Kinetic Model for Q-Factors
Following a single excitation, the exciton population will decay according to the differential equation when a simple kinetic behavior is assumed
| 6 |
where [e1] is the exciton population, kR is the radiative rate, and kNR is the nonradiative rate. The solution to the equation is
| 7 |
where [e1](0) is the initial number of single excitons created. The resulting fluorescence signal is proportional to the transition dipole magnitude squared, which is also proportional to the radiative rate. At any given time t, after the excitation, the number of photons emitted is therefore
| 8 |
The total fraction of the single excitons emitted as photons is the well-known quantum yield Q1 = kR/kR + kNR obtained by integrating the above equation from time zero to infinity.
When two excitons are simultaneously brought onto the system, the concentration of biexcitons is given by [f](0). These have several decay paths resulting in two interesting differential equations. First, the biexcitons will disappear according to the equation
| 9 |
The term kA0 results from exciton annihilation where both excitons are lost, whereas the term kA1 results from exciton annihilation where one of the excitons is left after the annihilation event. The factor of 2 arises as either of the two excitons may radiate or be quenched. In general, these rates may depend on the nature of the different excitons, but we assume the rates to be identical here. The biexciton population as a function of time is
| 10 |
The photon emission from the biexciton states is
| 11 |
After the emission, a single exciton state is left. We denote the population of these as [e2](t) as these excitons are first created from the biexcitons either by an annihilation process, radiative decay, or nonradiative decay and then they decay either radiatively or non-radiatively. It is, thus, governed by the differential equation
| 12 |
The solution to this equation is
| 13 |
The photon emission is then given by
| 14 |
The quantum yield from the biexcitons is given by the sum of the quantum yield from each of these processes.
| 15 |
When the exciton annihilation is very slow, this reduces to Q2,2 = Q1. For the single excitons, the yield is
| 16 |
This again reduces to Q1 when the exciton annihilation is very slow. The total value is
| 17 |
It is useful to express the term A = 2 – Q2/Q1, which relates to the cross-peak intensity in weakly coupled systems
| 18 |
The authors declare no competing financial interest.
After this paper was published ASAP on January 3, 2019, corrections were made to the order of the authors and to Figure 2. The corrected version was reposted January 8, 2019.
References
- Tian P.; Keusters D.; Suzaki Y.; Warren W. Femtosecond Phase-Coherent Two-Dimensional Spectroscopy. Science 2003, 300, 1553–1555. 10.1126/science.1083433. [DOI] [PubMed] [Google Scholar]
- Tekavec P. F.; Lott G. A.; Marcus A. H. Fluorescence-detected two-dimensional electronic coherence spectroscopy by acousto-optic phase modulation. J. Chem. Phys. 2007, 127, 214307. 10.1063/1.2800560. [DOI] [PubMed] [Google Scholar]
- Lott G. A.; Perdomo-Ortiz A.; Utterback J. K.; Widom J. R.; Aspuru-Guzik A.; Marcus A. H. Conformation of self-assembled porphyrin dimers in liposome vesicles by phase-modulation 2D fluorescence spectroscopy. Proc. Natl. Acad. Sci. 2011, 108, 16521–16526. 10.1073/pnas.1017308108. [DOI] [PMC free article] [PubMed] [Google Scholar]
- Widom J. R.; Lee W.; Perdomo-Ortiz A.; Rappoport D.; Molinski T. F.; Aspuru-Guzik A.; Marcus A. H. Temperature-Dependent Conformations of a Membrane Supported Zinc Porphyrin Tweezer by 2D Fluorescence Spectroscopy. J. Phys. Chem. A 2013, 117, 6171–6184. 10.1021/jp400394z. [DOI] [PMC free article] [PubMed] [Google Scholar]
- Draeger S.; Roeding S.; Brixner T. Rapid-scan coherent 2D fluorescence spectroscopy. Opt. Express 2017, 25, 3259–3267. 10.1364/oe.25.003259. [DOI] [PubMed] [Google Scholar]
- Mastron J. N.; Tokmakoff A. Two-Photon-Excited Fluorescence-Encoded Infrared Spectroscopy. J. Phys. Chem. A 2016, 120, 9178–9187. 10.1021/acs.jpca.6b09158. [DOI] [PubMed] [Google Scholar]
- Tiwari V.; Matutes Y. A.; Gardiner A. T.; Jansen T. L. C.; Cogdell R. J.; Ogilvie J. P. Spatially-resolved fluorescence-detected two-dimensional electronic spectroscopy probes varying excitonic structure in photosynthetic bacteria. Nat. Commun. 2018, 9, 4219. 10.1038/s41467-018-06619-x. [DOI] [PMC free article] [PubMed] [Google Scholar]
- Brinks D.; Hildner R.; van Dijk E. M. H. P.; Stefani F. D.; Nieder J. B.; Hernando J.; van Hulst N. F. Ultrafast dynamics of single molecules. Chem. Soc. Rev. 2014, 43, 2476–2491. 10.1039/c3cs60269a. [DOI] [PubMed] [Google Scholar]
- Aeschlimann M.; Brixner T.; Fischer A.; Kramer C.; Melchior P.; Pfeiffer W.; Schneider C.; Struber C.; Tuchscherer P.; Voronine D. V. Coherent Two-Dimensional Nanoscopy. Science 2011, 333, 1723–1726. 10.1126/science.1209206. [DOI] [PubMed] [Google Scholar]
- Bakulin A. A.; Rao A.; Pavelyev V. G.; van Loosdrecht P. H. M.; Pshenichnikov M. S.; Niedzialek D.; Cornil J.; Beljonne D.; Friend R. H. The Role of Driving Energy and Delocalized States for Charge Separation in Organic Semiconductors. Science 2012, 335, 1340–1344. 10.1126/science.1217745. [DOI] [PubMed] [Google Scholar]
- Malý P.; Mančal T. Signatures of Exciton Delocalization and Exciton-Exciton Annihilation in Fluorescence-Detected Two-Dimensional Coherent Spectroscopy. J. Phys. Chem. Lett. 2018, 9, 5654–5659. 10.1021/acs.jpclett.8b02271. [DOI] [PubMed] [Google Scholar]
- Karki K. J.; Chen J.; Sakurai A.; Shi Q.; Gardiner A. T.; Kühn O.; Cogdell R. J.; Pullerits T.. Unexpectedly large delocalization of the initial excitation in photosynthetic light harvesting. 2018. arXiv:1804.04840. [DOI] [PMC free article] [PubMed] [Google Scholar]
- Schröter M.; Pullerits T.; Kühn O. Using fluorescence detected two-dimensional spectroscopy to investigate initial exciton delocalization between coupled chromophores. J. Chem. Phys. 2018, 149, 114107. 10.1063/1.5046645. [DOI] [PubMed] [Google Scholar]
- Tiwari V.; Matutes Y. A.; Konar A.; Yu Z.; Ptaszek M.; Bocian D. F.; Holten D.; Kirmaier C.; Ogilvie J. P. Strongly coupled bacteriochlorin dyad studied using phase-modulated fluorescence-detected two-dimensional electronic spectroscopy. Opt. Express 2018, 26, 22327–22341. 10.1364/oe.26.022327. [DOI] [PubMed] [Google Scholar]
- Hybl J. D.; Albrecht A. W.; Gallagher Faeder S. M.; Jonas D. M. Two-Dimensional Electronic Spectroscopy. Chem. Phys. Lett. 1998, 297, 307–313. 10.1016/s0009-2614(98)01140-3. [DOI] [Google Scholar]
- Cho M.Two-Dimensional Optical Spectroscopy; CRC Press: Boca Raton, 2009. [Google Scholar]
- Brixner T.; Stenger J.; Vaswani H. M.; Cho M.; Blankenship R. E.; Fleming G. R. Two-dimensional spectroscopy of electronic couplings in photosynthesis. Nature 2005, 434, 625–628. 10.1038/nature03429. [DOI] [PubMed] [Google Scholar]
- Thyrhaug E.; Žídek K.; Dostál J.; Bína D.; Zigmantas D. Exciton Structure and Energy Transfer in the Fenna-Matthews-Olson Complex. J. Phys. Chem. Lett. 2016, 7, 1653–1660. 10.1021/acs.jpclett.6b00534. [DOI] [PubMed] [Google Scholar]
- Butkus V.; Zigmantas D.; Valkunas L.; Abramavicius D. Vibrational vs. electronic coherences in 2D spectrum of molecular systems. Chem. Phys. Lett. 2012, 545, 40–43. 10.1016/j.cplett.2012.07.014. [DOI] [Google Scholar]
- Fuller F. D.; Pan J.; Gelzinis A.; Butkus V.; Senlik S. S.; Wilcox D. E.; Yocum C. F.; Valkunas L.; Abramavicius D.; Ogilvie J. P. Vibronic coherence in oxygenic photosynthesis. Nat. Chem. 2014, 6, 706–711. 10.1038/nchem.2005. [DOI] [PubMed] [Google Scholar]
- Tempelaar R.; Jansen T. L. C.; Knoester J. Vibrational Beatings Conceal Evidence of Electronic Coherence in the FMO Light-Harvesting Complex. J. Phys. Chem. B 2014, 118, 12865–12872. 10.1021/jp510074q. [DOI] [PubMed] [Google Scholar]
- Dijkstra A. G.; la Cour Jansen T.; Knoester J. Localization and coherent dynamics of excitons in the two-dimensional optical spectrum of molecular J-aggregates. J. Chem. Phys. 2008, 128, 164511. 10.1063/1.2897753. [DOI] [PubMed] [Google Scholar]
- Thyrhaug E.; Tempelaar R.; Alcocer M. J. P.; Žídek K.; Bína D.; Knoester J.; Jansen T. L. C.; Zigmantas D. Identification and characterization of diverse coherences in the Fenna-Matthews-Olson complex. Nat. Chem. 2018, 10, 780–786. 10.1038/s41557-018-0060-5. [DOI] [PubMed] [Google Scholar]
- Halpin A.; Johnson P. J. M.; Tempelaar R.; Murphy R. S.; Knoester J.; Jansen T. L. C.; Miller R. J. D. Two-Dimensional Spectroscopy of a Molecular Dimer Unveils the Effects of Vibronic Coupling on Exciton Coherences. Nat. Chem. 2014, 6, 196–201. 10.1038/nchem.1834. [DOI] [PubMed] [Google Scholar]
- Roberts S. T.; Loparo J. J.; Tokmakoff A. Characterization of Spectral Diffusion from Two-Dimensional Line Shapes. J. Chem. Phys. 2006, 125, 084502. 10.1063/1.2232271. [DOI] [PubMed] [Google Scholar]
- Lazonder K.; Pshenichnikov M. S.; Wiersma D. A. Easy interpretation of optical two-dimensional correlation spectra. Opt. Lett. 2006, 31, 3354–3356. 10.1364/ol.31.003354. [DOI] [PubMed] [Google Scholar]
- Koepke J.; Hu X.; Muenke C.; Schulten K.; Michel H. The Crystal Structure of the Light-Harvesting Complex II (B800-850) from Rhodospirillum Molischianum. Structure 1996, 4, 581–597. 10.1016/s0969-2126(96)00063-9. [DOI] [PubMed] [Google Scholar]
- Prince S. M.; Papiz M. Z.; Freer A. A.; McDermott G.; Hawthornthwaite-Lawless A. M.; Cogdell R. J.; Isaacs N. W. Apoprotein structure in the LH2 complex from Rhodopseudomonas acidophila strain 10050: modular assembly and protein pigment interactions. J. Mol. Biol. 1997, 268, 412–423. 10.1006/jmbi.1997.0966. [DOI] [PubMed] [Google Scholar]
- Papiz M. Z.; Prince S. M.; Howard T.; Cogdell R. J.; Isaacs N. W. The Structure and Thermal Motion of the B800-850 LH2 Complex from Rps.acidophila at 2.0Å Resolution and 100K: New Structural Features and Functionally Relevant Motions. J. Mol. Biol. 2003, 326, 1523–1538. 10.1016/s0022-2836(03)00024-x. [DOI] [PubMed] [Google Scholar]
- Cogdell R. J.; Isaacs N. W.; Freer A. A.; Howard T. D.; Gardiner A. T.; Prince S. M.; Papiz M. Z. The Structural Basis of Light-Harvesting in Purple Bacteria. FEBS Lett. 2003, 555, 35–39. 10.1016/s0014-5793(03)01102-5. [DOI] [PubMed] [Google Scholar]
- McDermott G.; Prince S. M.; Freer A. A.; Hawthornthwaite-Lawless A. M.; Papiz M. Z.; Cogdell R. J.; Isaacs N. W. Crystal Structure of an Integral Membrane Light-Harvesting Complex from Photosynthetic Bacteria. Nature 1995, 374, 517–521. 10.1038/374517a0. [DOI] [Google Scholar]
- Koolhaas M. H. C.; Frese R. N.; Fowler G. J. S.; Bibby T. S.; Georgakopoulou S.; van der Zwan G.; Hunter C. N.; van Grondelle R. Identification of the Upper Exciton Component of the B850 Bacteriochlorophylls of the LH2 Antenna Complex, Using a B800-Free Mutant ofRhodobactersphaeroides. Biochem 1998, 37, 4693–4698. 10.1021/bi973036l. [DOI] [PubMed] [Google Scholar]
- Sauer K.; Cogdell R. J.; Prince S. M.; Freer A.; Isaacs N. W.; Scheer H. Structure-Based Calculations of the Optical Spectra of the LH2 Bacteriochlorophyll-Protein Complex from Rhodopseudomonas Acidophila. Photochem. Photobiol. 1996, 64, 564–576. 10.1111/j.1751-1097.1996.tb03106.x. [DOI] [Google Scholar]
- van der Vegte C. P.; Prajapati J. D.; Kleinekathöfer U.; Knoester J.; Jansen T. L. C. Atomistic Modeling of Two-Dimensional Electronic Spectra and Excited-State Dynamics for a Light Harvesting 2 Complex. J. Phys. Chem. B 2015, 119, 1302–1313. 10.1021/jp509247p. [DOI] [PubMed] [Google Scholar]
- Hess S.; Feldchtein F.; Babin A.; Nurgaleev I.; Pullerits T.; Sergeev A.; Sundström V. Femtosecond energy transfer within the LH2 peripheral antenna of the photosynthetic purple bacteria Rhodobacter sphaeroides and Rhodopseudomonas palustris LL. Chem. Phys. Lett. 1993, 216, 247–257. 10.1016/0009-2614(93)90090-n. [DOI] [Google Scholar]
- Pullerits T.; Hess S.; Herek J. L.; Sundström V. Temperature Dependence of Excitation Transfer in LH2 ofRhodobacter sphaeroides. J. Phys. Chem. B 1997, 101, 10560–10567. 10.1021/jp9720956. [DOI] [Google Scholar]
- Krueger B. P.; Scholes G. D.; Fleming G. R. Calculation of couplings and energy-transfer pathways between the pigments of LH2 by the ab initio transition density cube method. J. Phys. Chem. B 1998, 102, 5378–5386. 10.1021/jp9811171. [DOI] [Google Scholar]
- Mukai K.; Abe S.; Sumi H. Theory of Rapid Excitation-Energy Transfer from B800 to Optically-Forbidden Exciton States of B850 in the Antenna System LH2 of Photosynthetic Purple Bacteria. J. Phys. Chem. B 1999, 103, 6096–6102. 10.1021/jp984469g. [DOI] [Google Scholar]
- Zigmantas D.; Read E. L.; Mancal T.; Brixner T.; Gardiner A. T.; Cogdell R. J.; Fleming G. R. Two-dimensional electronic spectroscopy of the B800-B820 light-harvesting complex. Proc. Nat. Acad. Sci. 2006, 103, 12672–12677. 10.1073/pnas.0602961103. [DOI] [PMC free article] [PubMed] [Google Scholar]
- Schröter M.; Alcocer M. J. P.; Cogdell R. J.; Kühn O.; Zigmantas D. Origin of the Two Bands in the B800 Ring and Their Involvement in the Energy Transfer Network of Allochromatium vinosum. J. Phys. Chem. Lett. 2018, 9, 1340–1345. 10.1021/acs.jpclett.8b00438. [DOI] [PubMed] [Google Scholar]
- Fowler G. J. S.; Hunter C. N. The Synthesis and Assembly of Functional High and Low Light LH2 Antenna Complexes fromRhodopseudomonas palustrisinRhodobacter sphaeroides. J. Bio. Chem. 1996, 271, 13356–13361. 10.1074/jbc.271.23.13356. [DOI] [PubMed] [Google Scholar]
- Brotosudarmo T. H. P.; Kunz R.; Böhm P.; Gardiner A. T.; Moulisová V.; Cogdell R. J.; Köhler J. Single-Molecule Spectroscopy Reveals that Individual Low-Light LH2 Complexes from Rhodopseudomonas palustris 2.1.6. Have a Heterogeneous Polypeptide Composition. Biophys. J. 2009, 97, 1491–1500. 10.1016/j.bpj.2009.06.034. [DOI] [PMC free article] [PubMed] [Google Scholar]
- Carey A.-M.; Hacking K.; Picken N.; Honkanen S.; Kelly S.; Niedzwiedzki D. M.; Blankenship R. E.; Shimizu Y.; Wang-Otomo Z.-Y.; Cogdell R. J. Characterisation of the LH2 spectral variants produced by the photosynthetic purple sulphur bacterium Allochromatium vinosum. Biochim. Biophys. Acta, Bioenerg. 2014, 1837, 1849–1860. 10.1016/j.bbabio.2014.07.022. [DOI] [PubMed] [Google Scholar]
- McLuskey K.; Prince S. M.; Cogdell R. J.; Isaacs N. W. The Crystallographic Structure of the B800-820 LH3 Light-Harvesting Complex from the Purple Bacteria Rhodopseudomonas Acidophila Strain 7050. Biochem 2001, 40, 8783–8789. 10.1021/bi010309a. [DOI] [PubMed] [Google Scholar]
- Deinum G.; Otte S. C. M.; Gardiner A. T.; Aartsma T. J.; Cogdell R. J.; Amesz J. Antenna organization of Rhodopseudomonas acidophila: a study of the excitation migration. Biochim. Biophys. Acta, Bioenerg. 1991, 1060, 125–131. 10.1016/s0005-2728(05)80127-6. [DOI] [Google Scholar]
- Niedzwiedzki D. M.; Gardiner A. T.; Blankenship R. E.; Cogdell R. J. Energy transfer in purple bacterial photosynthetic units from cells grown in various light intensities. Photosynth. Res. 2018, 137, 389–402. 10.1007/s11120-018-0512-1. [DOI] [PubMed] [Google Scholar]
- Gardiner A. T.; Niedzwiedzki D. M.; Cogdell R. J. Adaptation of Rhodopseudomonas acidophila strain 7050 to growth at different light intensities: what are the benefits to changing the type of LH2?. Faraday Discuss. 2018, 207, 471–489. 10.1039/c7fd00191f. [DOI] [PubMed] [Google Scholar]
- Southall J.; Henry S. L.; Gardiner A. T.; Roszak A. W.; Mullen W.; Carey A.-M.; Kelly S. M.; de Percin Northumberland C. O.; Cogdell R. J. Characterisation of a pucBA deletion mutant from Rhodopseudomonas palustris lacking all but the pucBAd genes. Photosynth. Res. 2017, 135, 9–21. 10.1007/s11120-017-0386-7. [DOI] [PMC free article] [PubMed] [Google Scholar]
- Brotosudarmo T. H. P.; Collins A. M.; Gall A.; Roszak A. W.; Gardiner A. T.; Blankenship R. E.; Cogdell R. J. The light intensity under which cells are grown controls the type of peripheral light-harvesting complexes that are assembled in a purple photosynthetic bacterium. Biochem. J. 2011, 440, 51–61. 10.1042/bj20110575. [DOI] [PubMed] [Google Scholar]
- Ferretti M.; Hendrikx R.; Romero E.; Southall J.; Cogdell R. J.; Novoderezhkin V. I.; Scholes G. D.; van Grondelle R. Dark States in the Light-Harvesting complex 2 Revealed by Two-dimensional Electronic Spectroscopy. Sci. Rep. 2016, 6, 20834. 10.1038/srep20834. [DOI] [PMC free article] [PubMed] [Google Scholar]
- Fidler A. F.; Singh V. P.; Long P. D.; Dahlberg P. D.; Engel G. S. Probing energy transfer events in the light harvesting complex 2 (LH2) of Rhodobacter sphaeroides with two-dimensional spectroscopy. J. Chem. Phys. 2013, 139, 155101. 10.1063/1.4824637. [DOI] [PMC free article] [PubMed] [Google Scholar]
- Fidler A. F.; Singh V. P.; Long P. D.; Dahlberg P. D.; Engel G. S. Time Scales of Coherent Dynamics in the Light-Harvesting Complex 2 (LH2) of Rhodobacter sphaeroides. J. Phys. Chem. Lett. 2013, 4, 1404–1409. 10.1021/jz400438m. [DOI] [PMC free article] [PubMed] [Google Scholar]
- Rancova O.; Abramavicius D. Static and Dynamic Disorder in Bacterial Light-Harvesting Complex LH2: A 2DES Simulation Study. J. Phys. Chem. B 2014, 118, 7533–7540. 10.1021/jp5043156. [DOI] [PubMed] [Google Scholar]
- Kell A.; Khmelnitskiy A.; Jassas M.; Jankowiak R. Dichotomous Disorder versus Excitonic Splitting of the B800 Band of Allochromatium vinosum. J. Phys. Chem. Lett. 2018, 9, 4125–4129. 10.1021/acs.jpclett.8b01584. [DOI] [PubMed] [Google Scholar]
- Hess S.; Chachisvilis M.; Timpmann K.; Jones M. R.; Fowler G. J.; Hunter C. N.; Sundstrom V. Temporally and spectrally resolved subpicosecond energy transfer within the peripheral antenna complex (LH2) and from LH2 to the core antenna complex in photosynthetic purple bacteria. Proc. Nat. Acad. Sci. 1995, 92, 12333–12337. 10.1073/pnas.92.26.12333. [DOI] [PMC free article] [PubMed] [Google Scholar]
- Moulisová V.; Luer L.; Hoseinkhani S.; Brotosudarmo T. H. P.; Collins A. M.; Lanzani G.; Blankenship R. E.; Cogdell R. J. Low Light Adaptation: Energy Transfer Processes in Different Types of Light Harvesting Complexes from Rhodopseudomonas palustris. Biophys. J. 2009, 97, 3019–3028. 10.1016/j.bpj.2009.09.023. [DOI] [PMC free article] [PubMed] [Google Scholar]
- Niedzwiedzki D. M.; Bina D.; Picken N.; Honkanen S.; Blankenship R. E.; Holten D.; Cogdell R. J. Spectroscopic studies of two spectral variants of light-harvesting complex 2 (LH2) from the photosynthetic purple sulfur bacterium Allochromatium vinosum. Biochim. Biophys. Acta, Bioenerg. 2012, 1817, 1576–1587. 10.1016/j.bbabio.2012.05.009. [DOI] [PubMed] [Google Scholar]
- Hochstrasser R. M. Two-Dimensional IR-Spectroscopy: Polarization Anisotropy Effects. Chem. Phys. 2001, 266, 273–284. 10.1016/s0301-0104(01)00232-4. [DOI] [Google Scholar]
- Zanni M. T.; Ge N.-H.; Kim Y. S.; Hochstrasser R. M. Two-dimensional IR spectroscopy can be designed to eliminate the diagonal peaks and expose only the crosspeaks needed for structure determination. Proc. Natl. Acad. Sci. U.S.A. 2001, 98, 11265–11270. 10.1073/pnas.201412998. [DOI] [PMC free article] [PubMed] [Google Scholar]
- Liang C.; Jansen T. L. C. An Efficient N3-Scaling Propagation Scheme for Simulating Two-Dimensional Infrared and Visible Spectra. J. Chem. Theory Comput. 2012, 8, 1706–1713. 10.1021/ct300045c. [DOI] [PubMed] [Google Scholar]
- Novoderezhkin V.; Wendling M.; van Grondelle R. Intra- and Interband Transfers in the B800–B850 Antenna ofRhodospirillummolischianum: Redfield Theory Modeling of Polarized Pump–Probe Kinetics. J. Phys. Chem. B 2003, 107, 11534–11548. 10.1021/jp035432l. [DOI] [Google Scholar]
- Matsushita M.; Ketelaars M.; van Oijen A. M.; Köhler J.; Aartsma T. J.; Schmidt J. Spectroscopy on the B850 Band of Individual Light-Harvesting 2 Complexes of Rhodopseudomonas acidophila II. Exciton States of an Elliptically Deformed Ring Aggregate. Biophys. J. 2001, 80, 1604–1614. 10.1016/s0006-3495(01)76133-4. [DOI] [PMC free article] [PubMed] [Google Scholar]
- Wu H.-M.; Reddy N. R. S.; Small G. J. Direct Observation and Hole Burning of the Lowest Exciton Level (B870) of the LH2 Antenna Complex ofRhodopseudomonas acidophila(Strain 10050). J. Phys. Chem. B 1997, 101, 651–656. 10.1021/jp962766k. [DOI] [Google Scholar]
- Nottoli M.; Jurinovich S.; Cupellini L.; Gardiner A. T.; Cogdell R.; Mennucci B. The role of charge-transfer states in the spectral tuning of antenna complexes of purple bacteria. Photosynth. Res. 2018, 137, 215–226. 10.1007/s11120-018-0492-1. [DOI] [PubMed] [Google Scholar]
- Harel E.; Engel G. S. Quantum coherence spectroscopy reveals complex dynamics in bacterial light-harvesting complex 2 (LH2). Proc. Nat. Acad. Sci. 2012, 109, 706–711. 10.1073/pnas.1110312109. [DOI] [PMC free article] [PubMed] [Google Scholar]
- Rancova O.; Sulskus J.; Abramavicius D. Insight into the Structure of Photosynthetic LH2 Aggregate from Spectroscopy Simulations. J. Phys. Chem. B 2012, 116, 7803–7814. 10.1021/jp302817p. [DOI] [PubMed] [Google Scholar]
- Trinkunas G.; Herek J. L.; Polívka T.; Sundström V.; Pullerits T. Exciton Delocalization Probed by Excitation Annihilation in the Light-Harvesting Antenna LH2. Phys. Rev. Lett. 2001, 86, 4167–4170. 10.1103/physrevlett.86.4167. [DOI] [PubMed] [Google Scholar]
- Monshouwer R.; Abrahamsson M.; van Mourik F.; van Grondelle R. Superradiance and Exciton Delocalization in Bacterial Photosynthetic Light-Harvesting Systems. J. Phys. Chem. B 1997, 101, 7241–7248. 10.1021/jp963377t. [DOI] [Google Scholar]
- van der Vegte C. P.; Dijkstra A. G.; Knoester J.; Jansen T. L. C. Calculating Two-Dimensional Spectra with the Mixed Quantum-Classical Ehrenfest Method. J. Phys. Chem. A 2013, 117, 5970–5980. 10.1021/jp311668r. [DOI] [PubMed] [Google Scholar]
- Cannizzo A.; van Mourik F.; Gawelda W.; Zgrablic G.; Bressler C.; Chergui M. Broadband Femtosecond Fluorescence Spectroscopy of [Ru(bpy)3]2+. Angew. Chem. 2006, 118, 3246–3248. 10.1002/ange.200600125. [DOI] [PubMed] [Google Scholar]
- Mukamel S.Principles of Nonlinear Optical Spectroscopy; Oxford University Press: New York, 1995. [Google Scholar]
- Gelin M. F.; Pisliakov A. V.; Egorova D.; Domcke W. A simple model for the calculation of nonlinear optical response functions and femtosecond time-resolved spectra. J. Chem. Phys. 2003, 118, 5287–5301. 10.1063/1.1547751. [DOI] [Google Scholar]
- Sundström V.; Gillbro T.; Gadonas R. A.; Piskarskas A. Annihilation of singlet excitons in J aggregates of pseudoisocyanine (PIC) studied by pico- and subpicosecond spectroscopy. J. Chem. Phys. 1988, 89, 2754–2762. 10.1063/1.455027. [DOI] [Google Scholar]
- Malyshev V. A.; Glaeske H.; Feller K.-H. Exciton-exciton annihilation in linear molecular aggregates at low temperature. Chem. Phys. Lett. 1999, 305, 117–122. 10.1016/s0009-2614(99)00369-3. [DOI] [Google Scholar]
- Nguyen T.-Q.; Martini I. B.; Liu J.; Schwartz B. J. Controlling Interchain Interactions in Conjugated Polymers: The Effects of Chain Morphology on Exciton–Exciton Annihilation and Aggregation in MEH–PPV Films. J. Phys. Chem. B 2000, 104, 237–255. 10.1021/jp993190c. [DOI] [Google Scholar]
- Brüggemann B.; May V. Exciton exciton annihilation dynamics in chromophore complexes. II. Intensity dependent transient absorption of the LH2 antenna system. J. Chem. Phys. 2004, 120, 2325–2336. 10.1063/1.1637585. [DOI] [PubMed] [Google Scholar]
- Shaw P. E.; Ruseckas A.; Samuel I. D. W. Exciton Diffusion Measurements in Poly(3-hexylthiophene). Adv. Mater. 2008, 20, 3516–3520. 10.1002/adma.200800982. [DOI] [Google Scholar]
- Tempelaar R.; Jansen T. L. C.; Knoester J. Exciton-Exciton Annihilation Is Coherently Suppressed in H-Aggregates, but Not in J-Aggregates. J. Phys. Chem. Lett. 2017, 8, 6113–6117. 10.1021/acs.jpclett.7b02745. [DOI] [PMC free article] [PubMed] [Google Scholar]


