Abstract
The development of new therapeutic strategies to control or reverse hepatic fibrosis requires thorough knowledge about its molecular and cellular basis. It is known that the heptapeptide angiotensin-(1–7) [ang-(1–7)] can reduce hepatic fibrosis and steatosis in vivo; therefore, it is important to uncover the mechanisms regulating its activity and cellular model of investigation. Ang-(1–7) is a peptide of the renin-angiotensin system (RAS), and here we investigated its modulatory effect on the expression pattern of microRNAs (miRNAs) in hepatic stellate cells (HSCs) LX-2, which transdifferentiate into fibrogenic and proliferative cells. We compared the miRNA profiles between quiesced, activated and ang-(1–7)-treated activated HSCs to identify miRNAs that may regulate their transdifferentiation. Thirteen miRNAs were pointed, and cellular and molecular analyses identified miRNA-1914-5p as a molecule that contributes to the effects of ang-(1–7) on lipid metabolism and on the pro-fibrotic environment control. In our cellular model, we also analyzed the regulators of fatty acid metabolism. Specifically, miRNA-1914-5p regulates the expression of malonyl-CoA decarboxylase (MLYCD) and phosphatidic acid phosphohydrolase (PAP or Lipin-1). Additionally, Lipin-1 was closely correlated with mRNA expression of peroxisome proliferator-activated receptors (PPAR)-α and −γ, which also contribute to lipid homeostasis and to the reduction of TGF-β1 expression. These findings provide a novel link between RAS and lipid metabolism in controlling HSCs activation.
Keywords: Angiotensin-(1–7), HSC fibrogenesis, Lipid metabolism, MicroRNA, Transdifferentiation
1. Introduction
Hepatic fibrosis and its end stage, cirrhosis, were reported to have caused the death of more than one million people in 2010, and the numbers continue to increase (Mokdad et al., 2014). However, no effective therapy is available. Alcohol abuse and hepatitis B and C are the major causes of hepatic injuries that contribute to the development of fibrosis (Lida-Ueno et al., 2017), which is frequently associated with an increased production of extracellular matrix (ECM) (Friedman et al., 1985; Kocabayoglu and Friedman, 2013;Lee and Friedman, 2010). In addition, nonalcoholic fatty liver diseases are rapidly rising as a potential cause of death (Ahmed, 2015; Le et al., 2017; Nayak et al., 2010; Pappachan et al., 2017).
In the liver, hepatic stellate cells (HSCs) play a major role in promoting liver fibrosis. These mesenchymal, perisinusoidal cells contribute to the liver homeostasis, and they respond to liver injury by transdifferentiating from a quiescent to an activated state (Friedman, 2008). In the healthy liver, HSCs have a star-like morphology and store large amounts of vitamin A, as retinyl esters, and triglycerides in the cytoplasmic lipid droplets (LD) (Ito and Shibasaki, 1968; Molenaar et al., 2017). However, in liver injuries, HSCs lose their intracellular lipid droplets, change their morphology from stellate to myofibroblast-like, and produce increased ECM components (Friedman et al., 1985; Kocabayoglu and Friedman, 2013; Lee and Friedman, 2010). The link between changes in lipid metabolism in HSCs and the development of hepatic fibrosis is not well understood (Lee et al., 2010; Pirazzi et al., 2014; Shirakami et al., 2012). Recently, autophagic degradation of LD has been linked to the transdiferentiation of HSCs by contributing with the energy source (Hernández-Gea et al., 2012). Clarifying the regulation of lipid metabolism in HSCs transdifferentiation could lead to the development of new therapeutic strategies for liver fibrosis.
The heptapeptide angiotensin-(1–7) [ang-(1–7)] can modulate liver fibrosis (Cai et al., 2016; Moreira de Macêdo et al., 2014; Pereira et al., 2007; Simões et al., 2017); however, its mechanisms of action are not known. Ang-(1–7) is a peptide hormone of the renin-angiotensin system (RAS), initially described as an important regulator of the cardiovascular system (Ferreira et al., 2001; Loot et al., 2002). More recently, a study demonstrated that the heptapeptide protects the liver against steatosis by modulating hepatic lipid metabolism and interrupting fibrosis (Cao et al., 2016; Simões et al., 2017). In addition, other studies describe the effect of the ang-(1–7) in hepatic metabolism, but the molecular details regarding the contribution of the heptapeptide to lipid metabolism and fibrogenesis in HSCs have not been clarified.
In the present study, we investigated the mechanistic effect of the ang-(1–7) heptapeptide on the lipid metabolism of activated HSCs to clarify its contribution to cell phenotypic transdifferentiation and reversion. For this, we studied the expression pattern of microRNAs (miRNAs) in LX-2 cells, a widely used immortalized human stellate cell line (Xu et al., 2005) and we have uncovered miRNA-1914-5p as a novel molecule that contributes to the regulation of cellular fatty acid (FA) metabolism and with the controlling of the pro-fibrotic environment in this cell type.
miRNAs are small (21–25 nt) non-coding RNAs that modulate gene expression by binding to the 3′-untranslated region (UTR) of target mRNAs, decreasing protein synthesis (Ambros, 2003; Bartel, 2004; Bartel, 2009). Several studies have demonstrated that changes on miRNA expression are correlated with the physiological or pathological states of the cells (Szabo and Bala, 2013), having provided new biomarkers for the characterization of diseases and support drug development strategies (Hsu et al., 2017; Imamura et al., 2017; Wang et al., 2017). Therefore, we investigated the modulatory effect of the miR-1914-5p in LX-2, pointing its relevance in the cellular metabolism transdifferentiation.
2. Materials and methods
2.1. Cell culture
The LX-2 human HSC cell line (Xu et al., 2005) was maintained in Dulbecco’s Modified Eagle Medium (DMEM) supplemented with 2% (quiesced culture) or 10% (activated culture) fetal bovine serum (FBS) plus antibiotics under 37 °C and 5% CO2. For experiments, cells were seeded at 3.2 × 10³ cells/cm2 and, when required, the heptapeptide (Bachem Americas Inc, USA) was added to the activated cultures at a final concentration of 10−7 M (Su et al., 2006; Verano-Braga et al., 2012). The media containing or not the peptide was renewed every 24 h until the cultures reached ∼90% confluency.
2.2. Phase-contrast microscopy
LX-2 cells were fixed in 3.7% formaldehyde solution containing 1% calcium chloride and lipid droplets were stained with 0.7% Oil Red O and hematoxylin counterstained. The images were acquired on an Olympus BX51 microscopy and a DP71 CCD camera (Tokyo, Japan). The LDs were quantified using the Image J platform (Rasband, 1997). One hundred randomly selected cells were analyzed in each independent group.
2.3. Total RNA isolation, miRNA profiling and data analysis
Total RNA from different groups of LX-2 cultures was isolated, profiled and analyzed according to Silva et al. (2016). The global analyses of the microRNA arrays identified the upregulated and the downregulated miRNAs in LX-2 cells cultivated under different conditions and for the heat map construction, using the GenEx software (Tata Biocenter Team, 2014), only clustering of miRNAs with significantly different expression (p < 0.05) between samples were considered.
2.4. Real time PCR
The miRCURY LNA™ PCR array results were validated by real-time PCR using ExiLENT SYBR® Green master mix (Exiquon, Denmark) and a specific set of miRCURY LNA™ primers for human-miR-15a-5p, miR-165p, miR-30c-5p, miR-30e-3p, miR-139-3p, miR-196b-3p, miR-323a-3p, miR-380-5p, miR-491-5p, miR-769-3p, miR-1179, miR-1254 and miR1914-5p. In addition, qPCRs were also performed to verify the mRNA expression of different genes in LX-2 groups using 2 −ΔΔCT analysis and specific primers sets. Relevant sequences to the present study are presented in Table 1. The qPCR reactions were performed as described in Silva et al. (2016) and values were plotted relative to the normal control values.
Table 1.
Primer sequences used in qPCR assays.
| GENE SYMBOL | Primer sequence |
|---|---|
| ACC1 | 5′- TGTAAGAGCTCATTTTGGAGGA; 5′- GAATCGAGAGTGCTGGTTCAG |
| ACC2 | 5′- GCAGCTGATGACCAACTTCA; 5′- TCCGGGTAGACTCACGAGAT |
| ACLY | 5′- CATCCGGAGGTAGATGTGCT; 5′- CGGATCTGGGCATAGTTCAT |
| ACSL4 | 5′- ATGGATGATTGCAGCACAGA; 5′- CTGCTTCTTTGCCAAGTGTG |
| β-actin | 5′- CGGGACCTGACTGACTAC; 5′- CTCCTTAATGTCACGCAC |
| COL1A1 | 5′- GTGCTCCTGGTATTGCTGGT; 5′- ACCAGGTTCACCGCTGTTAC |
| CTGF | 5′- TGCCTGCCATTACAACTGTC; 5′- CATGCCATGTCTCCGTACAT |
| DGAT1 | 5′- GCCTTCTTCCACGAGTACCT; 5′- AGTGGGATCTGAGCCATCA |
| DGAT2 | 5′- TGAGTCTCTGAGCTCCATGC; 5′- AACCAGGTCAGCTCCATGAC |
| FASN | 5′- TCCTGCTGACCAAGAAGTCC; 5′- CTTGCTCCTTGAAGCCATCT |
| LIPIN-1 | 5- CCATCAGCCAGTCTTTCACA; 5′- CAGGGTTGCAGACACTCAAG |
| MLYCD | 5′- GACATCTCCAGCAACATCCA; 5′- CTGGGTCAAGCTGATGGAAT |
| PDGF-B | 5′- CTGTCCAGGTGAGAAAGATCG; 5′- ATGCCAGGTGGTCTTCCA |
| PPAR-α | 5′- GGCCTCAGGCTATCATTACG; 5′- ACCAGCTTGAGTCGAATCGT |
| PPAR-γ | 5′- GCTTCATGACAAGGGAGTTTC 5′- AACTCAAACTTGGGCTCCATAAAG |
| α-SMA | 5′- AATCCTGACCCTGAAGTACC 5′- TAGAAAGAGTGGTGCCAGAT |
| TGF-β1 | 5′- CCCTGGACACCAACTATTGC; 5′- GTCCTTGCGGAAGTCAATGT |
| TGF-β2 | 5′- CCCTGGACACCTGCTATTCC; 5′- GTCCTTGCGCTAGTCAATAC |
2.5. Selection of miRNA for functional validation
MicroRNAs pointed by statistical analysis were evaluated by Kyoto Encyclopedia of Genes and Genomes (KEGG) pathway using the DIANA-microT-CDS online tool (Paraskevopoulou et al., 2013; Reczko et al., 2012). The analysis revealed thirty-four cellular signaling pathways that were possibly correlated with HSC transdifferention (p < 0.01). Next, based on miRBase (Griffiths-Jones et al., 2006), miRDB (Wong and Wang, 2015) online databases, literature search at PubMed and Web of Science, and the statistical analyses, the fatty acid biosynthesis pathway and the miR-1914-5p were selected for further assays.
2.6. Cellular transfections
For miRNA and small interfering RNA (siRNA) transfections, 6 × 10⁴ LX-2 cells were plated on a 24-well plate and incubated overnight under regular growth conditions. Next, miR-1914-5p mimic or inhibitor (mirVana™miRNAs, Thermo Fisher Scientific, USA) and MLYCD-siRNA and ACSL4-siRNA or their Non-targeting Pool (OnTarget Plus siRNA – Smart Pools – Dharmacon/GE Health Care, USA) were transfected into cells, according to Silva et al. (2016). At 48 h after transfection, cells were collected for further investigation.
2.7. Enzyme-linked immunosorbent assay (ELISA)
Cell culture supernatants were used in the TGF-β 1 immunoassays. The secreted Transforming Growth Factor-β1 (TGF-β1, Thermo Fisher Scientific, USA) were measured using 50 μL of the supernatants and ELISA kit, as directed by the manufacturer, using a microplate reader (Packard Instrument Company Inc., USA).
2.8. Fourier transform infrared spectroscopy analysis
Fourier transform infrared (FTIR) spectroscopy spectra were obtained using universal attenuated total reflectance (UART-FITR). For the assays, 1 ×10⁶ LX-2 dried cells from each independent group were used. The samples were analyzed in a Spectrum Spotlight 400 FT-IR (PerkinElmer, USA) and the spectra were recorded between the regions 4000 cm−1 and 450 cm−1 at 20 °C. Thirty two scans were taken with resolution of 4 cm−1 and digital data were processed with Spectrum 5.2 software (PerkinElmer, USA). The spectra were normalized to amide I band (and A1651) and the baseline-corrected spectrum was considered to determine the variations. The protocol was adapted from Stuart (2004).
2.9. Fatty acid oxidation and citrate synthase activity in hepatic stellate cells
Fatty acid oxidation was determined by the incubation of 2.4 × 10⁶ cells in Krebs Ringer solution in the presence of 0.4 μCi/ mL [1-14C] palmitate (Perkin Elmer, USA). The reactions were processed at 37 °C for 1 h and they were terminated by the addition of 0.25 mL of H2SO4 (5N). Radioactivity of the generated 14CO2 was determined by liquid scintillation counting using 4 mL of Uniscint BD (National Diagnostics, USA) (Massao Hirabara et al., 2003).
For the citrate synthase (CS) activity measurement, LX-2, 5 × 10⁶ cells/mL were frozen under liquid nitrogen and thawed two times to disrupt the mitochondria and release the citrate synthase (Siu et al., 2003). The homogenate was centrifuged at 12000 × g at 4 °C for 10 min and the supernatant containing the proteins collected and the concentration was determined by Bradford assay (Bio-Rad, USA). Ten μg of protein was added to the reaction mixture containing triethanolamine-HCl buffer 0.1 M, pH 8.0, 0.3 mM acetyl-CoA, 0.5 mM oxaloacetate, 0.25% Triton X-100 and 0.1 mM 5,5′-Dithiobis-2-nitrobenzoic acid (DTNB). Citrate synthase activity was determined according to Srere (1969).
2.10. Western blot
Western blot assays were performed, visualized and analyzed according to Da Silva et al. (2016), using anti-actin α-smooth muscle (α-SMA, Sigma-Aldrich, USA) or anti-ACC1 monoclonal antibodies, and anti-MLYCD (ABCAM, UK), anti-ACSL4 and anti-Lipin-1 (Thermo Fisher Scientific, USA) or anti-β-actin (Cell Signaling, USA) polyclonal antibodies, followed by 2 h of incubation with horseradish peroxidase-conjugated secondary antibodies (Cayman Chemical, USA).
2.11. Dual-luciferase reporter assay
The initial 226 pb of 3′-UTR of MLYCD, containing the putative binding site for the miR-1914-5p (seed sequence 5′-GCACAGG), or a mutated seed sequence (5′-GAGCCAG) were amplified by PCR and cloned in the pGL3-Control vector (Promega, USA). These vectors were co-transfected with miR-1914-5p mimic or inhibitor into LX-2 cells using Lipofectamine® RNAiMAX Transfection Reagent (Thermo Fisher Scientific, USA). The Renilla luciferase reporter plasmid (pRL-TK) was used as the internal control for transfection efficiency. The assays were measured in a TD20/20 luminometer (Turner Designs).
2.12. Graphs and statistical analyses
Multiple data are presented as mean ± standard deviations (SD) from at least 3 independent experiments and analyses. Graphs and statistical analyses were generated using Graph Pad Prism® 5 software. The differences between the cellular groups were calculated using oneway analysis of variance (ANOVA), followed by Dunnett’s test. Significance was set at p < 0.05.
3. Results
3.1. Modulatory activity of angiotensin-(1–7) in LX-2 hepatic stellate cells and miRNA signatures
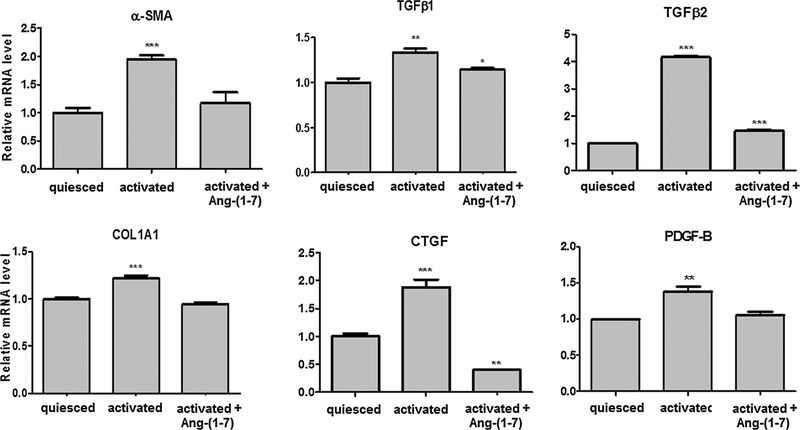
The transcriptional level of classical pro-fibrotic genes alpha-smooth muscle actin (α-SMA), transforming growth factor β (TGF-β)1, TGF-β2, collagen alpha-1 chain precursor (COL1A1), connective-tissue growth factor (CTGF) and platelet derived growth factor (PDGF-B) were evaluated in different groups of LX-2. Fig. 1 shows the results. In activated cells (10% FBS), the heptapeptide decreased the mRNA expression of the investigated genes to nearly quiesced cell (2% FBS) levels, suggesting a positive effect of the heptapeptide in the activation reversion of this HSC.
Fig. 1.
Pro-fibrotic markers expression in LX-2 cells cultivated under different conditions. Transcriptional level of fibrotic markers was evaluated in different groups of LX-2 cells by qRT-PCR. The graphs represent the mean values of at least three independent experiments (p < 0.05).
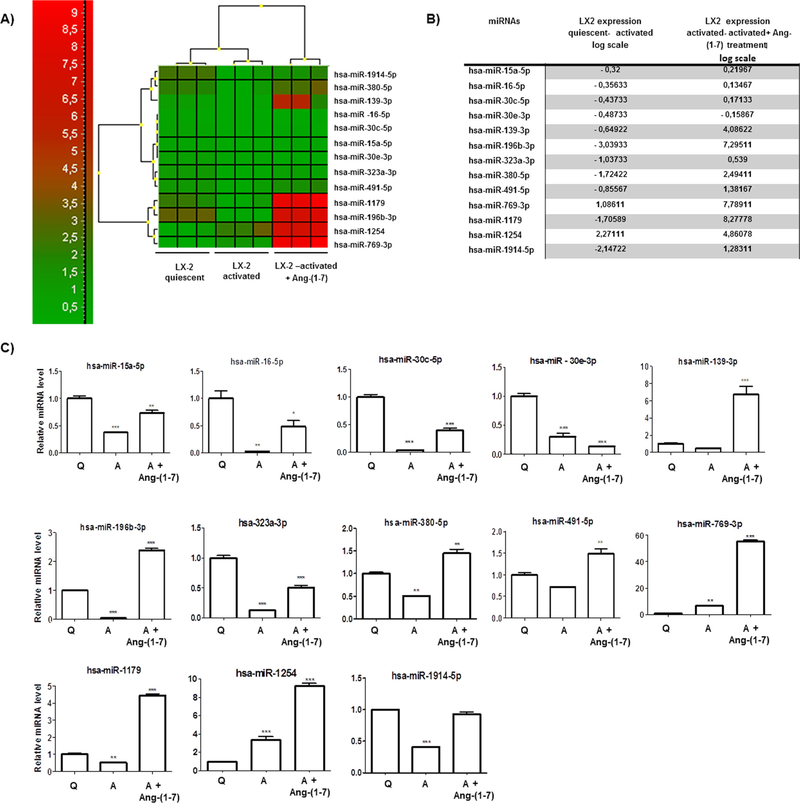
Next, miRCURY LNA™ PCR array analyses pointed 13 miRNAs differentially expressed among quiesced, activated and activated plus ang(1–7) treatment (p < 0.05). Fig. 2A illustrates the heatmap for the microarray data from groups of LX-2 cells. Three main clusters of miRNA expression presented interconnections between them. Fig. 2B lists the identified miRNAs and the differences between the groups in log scale. The analyses revealed higher miRNA expression levels for miR-139-3p, miR-196b-3p, miR-380-5p, miR-491-5p, miR-769-3p, miR-1179, and miR-1254 in ang-(1–7)-treated group. On the other hand, lower miRNA levels were observed in 11 out of the 13 investigated miRNAs in activated LX-2 cultures. To validate these results, qRT-PCR miRNAs assays were performed and the results were consistent with those found in PCR array (Fig. 2C).
Fig. 2.
miRNA expression profiles of LX-2 cells cultivated under different conditions. (A) Heatmap of the 13 miRNAs differentially expressed between LX-2 groups. Each column represents an individual cellular group and each row represents an individual miRNA. Colors of the heatmap represent the Z-score: higher – red, lower – green. The heatmap was packed using GeneEX (Exiquon, Denmark) software and significance was set at p < 0.05. (B) List of miRNAs differentially expressed between LX-2 groups, value: p < 0.05. (C) Relative miRNA expression in logarithmic scale by qRT-PCR confirms the results found in miRNA PCR arrays. The graphs present values from the average from three independent experiments, and the error bars represent the standard deviation of the mean. ANOVA testing showed significant differences between the LX-2 groups. The significance level was set at p < 0.05. Figure legend (Q = quiesced; A = activated). (For interpretation of the references to colour in this figure legend, the reader is referred to the web version of this article.)
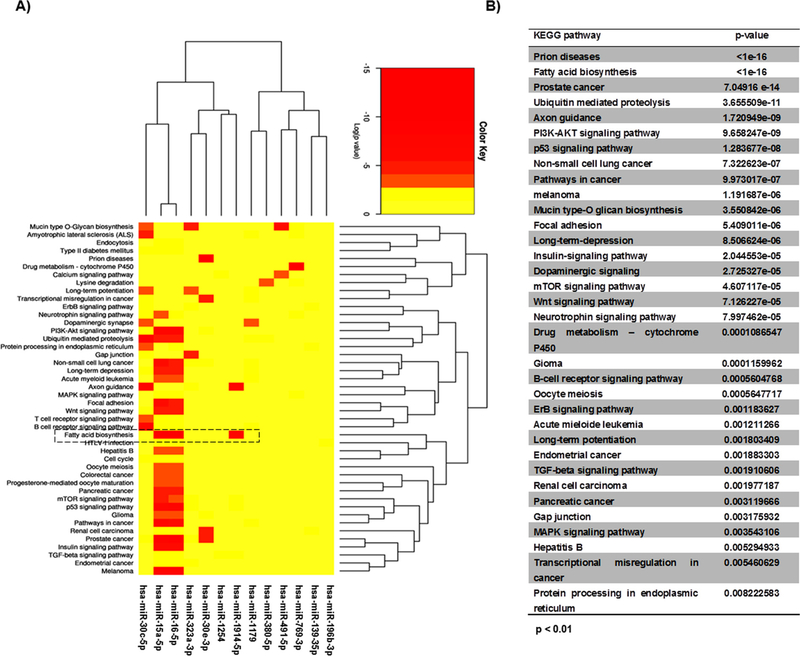
To investigate functional activities of the selected miRNAs in LX-2 phenotype reversion, DIANA-microT-CDS algorithm (Paraskevopoulou et al., 2013) was used and 34 KEGG molecular pathways were pointed (*p < 0.01) (Fig. 3A and B). The statistical analyses (p values) of the KEGG pathways and their connection with the HSC transdifferentiation, pointed the miR-1914-5p for further investigation. This miRNA was pointed to be correlated with the fatty acid biosynthesis. miR-15a-5p and 16-5p were not functionally investigated because their activities were not as restricted as those of miR-1914-5p.
Fig. 3.
KEGG cellular signaling of LX-2 cultivated under different conditions. (A) Heatmap of the 13 miRNAs differentially expressed in LX-2 groups and KEGG cellular signaling using DIANA-microT-CDS algorithm (p < 0.01). Colors of the heatmap represent the Z-score: higher – red, lower – yellow. (B) KEGG cellular signaling of the 13 miRNAs. (For interpretation of the references to colour in this figure legend, the reader is referred to the web version of this article.)
3.2. Modulatory effects of miRNA-1914-5p on pro-fibrotic markers and lipid droplets in LX-2 cells
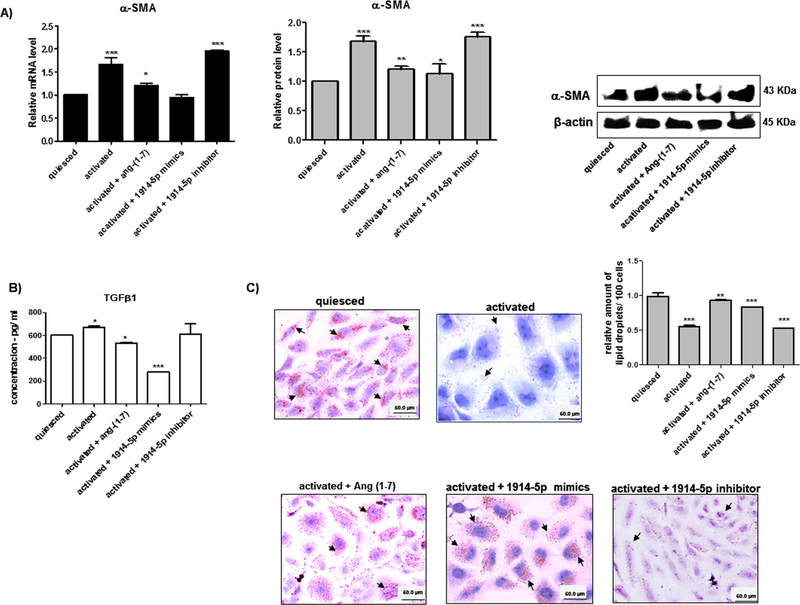
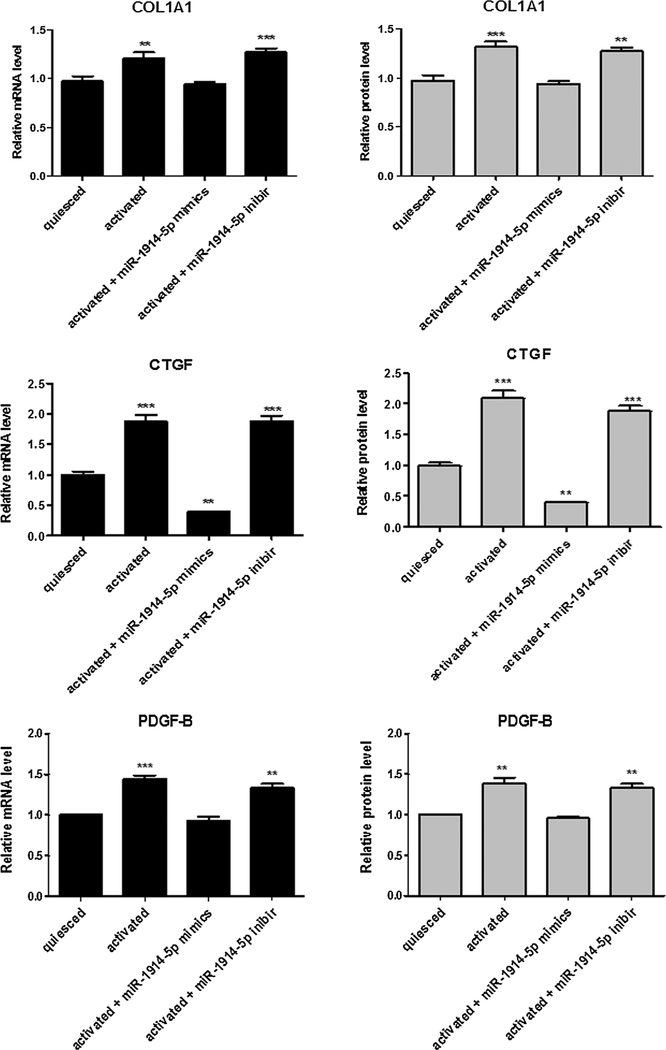
Activated LX-2 cells transfected with miR-1914-5p mimic or inhibitor were used to evaluate the expression level of pro-fibrotic markers. In activated LX-2 cells high levels of α-SMA gene transcript and protein were found; on the other hand, reduced levels nearly comparable to quiesced were observed for miR-1914-5p mimic and in ang(1–7)-treated cells as well. The α-SMA transcripts and protein levels of activated cells transfected with miR-1914-5p inhibitor remained unaltered (Fig. 4A). Considering TGF-β1 production, it presents a 12% higher level in activated cells than in quiesced cells. In addition, when compared the cytokine production level in activated cells to the amount found in ang-(1–7) treated-cells and miR-1914-5p-mimic transfected cells,∼21% and ∼58% reduction was found in TGF-β1 levels respectively (Fig. 4B). Moreover, to confirm the modulatory effect of the miR-1914-5p in the pro-fibrotic processes in LX-2, classical molecular markers of fibrogenesis were verified. The Fig. A1 shows mRNA and protein expression levels of COL1A1, CTGF and PDGF-B. In addition, the presence of lipid droplets was analyzed through Oil Red O staining in each individual LX-2 group (Fig. 4C). Reduced numbers of LDs were found in activated LX-2 cells when compared to the average number found in quiesced LX-2, heptapeptide-treated and in miR-1914-5p-transfected cells. Combined the results confirm the modulatory effect of the peptide and the miR-mimics-1914-5p in the investigated HSC lipid metabolism, contributing to the pro-fibrotic environment control.
Fig. 4.
Functional activities of miR-1914-5p in LX-2 fibrotic markers and lipid droplets. (A) α-SMA mRNA and protein levels from groups of LX-2 cells. The protein was examined and quantified by western blot. β-actin was used as the loading control. (B) TGF-β1 production from LX-2 groups was measured using ELISA. (C) Lipid droplets from LX-2 cultures were stained by Oil Red O and the detected droplets were quantified. The graphs and images present mean values of the average from at least three independent experiments. ANOVA testing showed significant differences (p < 0.05) in the assays. (For interpretation of the references to colour in this figure legend, the reader is referred to the web version of this article.)
3.3. Effects of angiotensin-(1–7) and miRNA-1914-5p in cellular fatty acid metabolism in the HSC LX-2
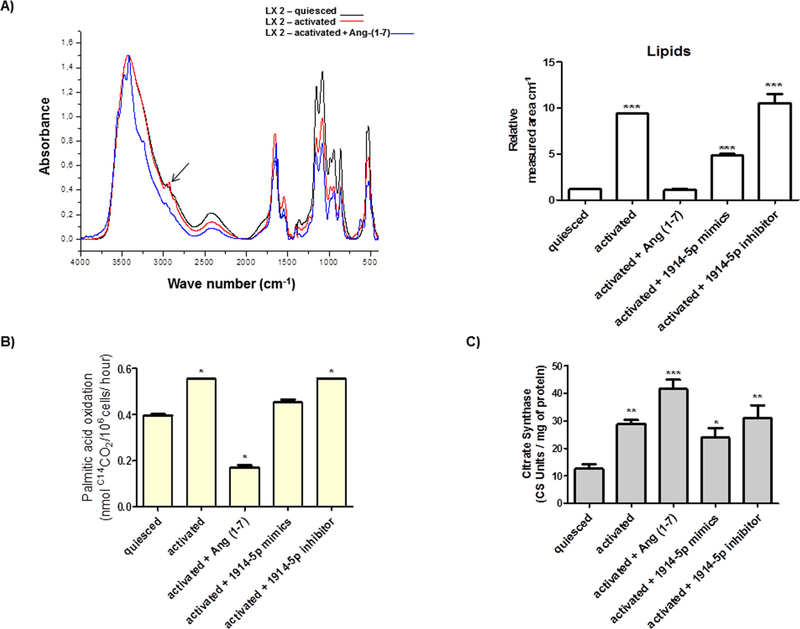
To study the effects of the heptapeptide and the miR-1914-5p in LX2 lipid metabolism, the total amount of lipids in LX-2 cells was measured by UART-FITR. The total lipids were identified by major assigned bands between the regions 3000–2850 cm−1 (Hamilton and Cast, 1999). The results were summarized as relative measured area (Fig. 5A), and demonstrated increase amount of lipids in activated LX-2 cells, compared to the level found in quiesced culture (∼8-fold increase). This result is supported by the fact that more lipids (albuminlinked) were available in the media containing 10% FBS, which was probably incorporated by the cells, facilitating cellular activation and pro-fibrotic metabolism. However, the ang-(1–7) treatment and the miRNA-mimic transfection reduced the total amount of lipids in activated cells, and the miRNA-inhibitor did not change the lipid pattern found in activated HSCs.
Fig. 5.
Cellular fatty acid metabolism in LX-2 groups. (A) UART-FITR spectra from regions 4000–450 cm−1 from LX-2 groups containing major assigned bands for lipids (regions 3000–2850 cm−1 – arrow), which were relative quantified. (B) Fatty acid oxidation in LX-2 cells. (C) Citrate synthase measurement. Graphs represent the mean values of at least three independent experiments. ANOVA testing showed significant differences (p < 0.05).
Next, palmitate oxidation was investigated in LX-2. Increased oxidation level was found in activated cells in comparison with the quiesced cells (Fig. 5B). The heptapeptide treatment markedly decreased fatty acid oxidation in activated LX-2 and a 25% reduction in palmitic acid oxidation was observed in activated cells transfected with miR-1914-5p-mimic. No significant changes in palmitate oxidation were verified in activated cells transfected with miR-1914-5p-inhibitor. Moreover, citrate synthase activity increased in activated cells, and greater amounts were found in activated cells treated with ang-(1–7), when compared to the quiesced culture (Fig. 5C), suggesting high mitochondrial density, probably correlated with the need for enhanced energy production to support cellular maintenance, once a decreased level of palmitic acid oxidation was observed in such cellular groups (Fig. 5B). miR-1914-5p mimic or inhibitor did not altered the citrate synthase content in activated cells, suggesting that this miRNA is not involved in the increase of mitochondrial density.
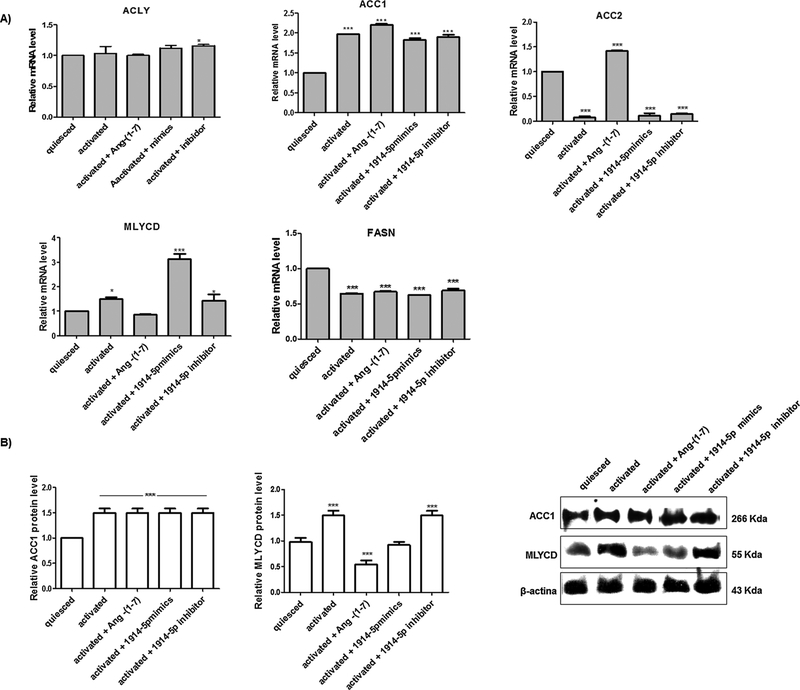
Furthermore, we analyzed the expression pattern of the key genes regulating fatty acid biosynthesis (Fig. 6A): ATP citrate lyase (ACLY) converts citrate coming from mitochondria to cytosolic acetyl-CoA; acetyl-CoA carboxylase (ACC) 1 and ACC2. ACC1 is cytosolic, and ACC2 is associated with the mitochondria and they catalyze the irreversible carboxylation of acetyl-CoA to malonyl-CoA, the rate-limiting step in fatty acid synthesis; MLYCD, which decarboxylates malonyl-CoA to acetyl-CoA, and fatty acid synthase (FASN), that catalyzes the synthesis of palmitate from acetyl-CoA and malonyl-CoA (Currie et al., 2013). The global analyses of investigated genes showed significant increased expression for ACC2, in ang-(1–7)-treated cells. Moreover, MLYCD transcripts increased in activated cells and even more in miR-mimic-transfected cells, when compared to the level found in quiesced cells. However, the MLYCD transcripts decreased in ang-(1–7)-treated cells, and in cells transfected with the miR-inhibitor, no major changes were observed in the MLYCD mRNA level compared to that of activated cells. In addition, lower FASN expression was found in the cells cultivated under high extracellular fatty acid concentration (10% FBS), supporting the fact that FASN expression is frequently downregulated under these conditions (Wang, 2010).
Fig. 6.
Molecular connectors of fatty acid biosynthesis in groups of LX-2 cells. (A) Relative mRNA expression of the main genes of fatty acids pathway. (B) Western blot analyses of ACC1 and MLYCD proteins. β-actin was used as loading control. Graphs represent values of the average from three independent experiments, and the error bars represent the standard deviation of the mean. ANOVA analysis showed significant differences (p < 0.05).
To clarify the functional activity of the miR-1914-5p in lipid metabolism, bioinformatics approaches pointed to ACC1 and MLYCD as potential targets of the miR-1914-5p, and protein levels of those enzymes were evaluated in LX-2 cultures (Fig. 6B). The analyses revealed a 50% increase in ACC1 protein levels in all groups cultivated under activated conditions, when compared to the level found in quiesced cells. For MLYCD (Fig. 6B), the protein level also demonstrated a similar pattern to the mRNA expression, except for activated cells transfected with miR-1914-5p. These group of cells presented MLYCD protein content close to the quiesced cells despite the high mRNA level observed, suggesting the presence of post-transcriptional mechanisms controlling MLYCD protein level (Carthew and Sontheimer, 2009; Fabian et al., 2010; Meijer et al., 2013; Wilczynska and Bushell, 2015) in miRNA-mimic-transfected cells. To confirm the physical interaction between the molecules, dual-luciferase assays were performed and Fig. A2 presents the results, which corroborates the physical interaction between the miRNA-1914-5p mimic and the pGL3-MLYCD-3′-UTRtransfected groups.
3.4. Functional validation of miRNA-1914-5p in pro-fibrotic lipid metabolism of LX-2 cells
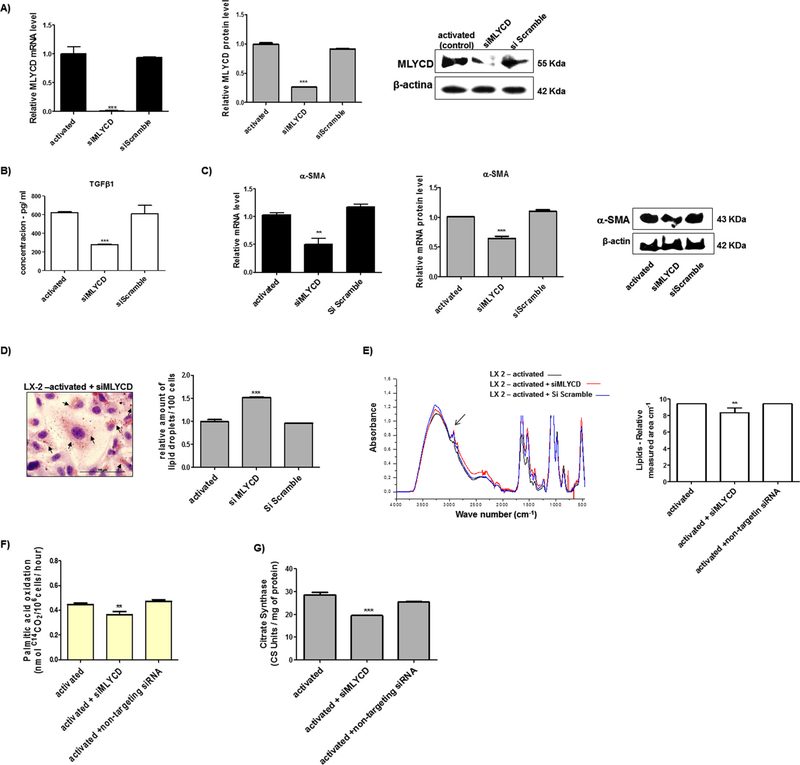
To address the modulatory function of the miR-1914-5p in pro-fibrotic lipid metabolism of LX-2 cells, MLYCD was downregulated (siMLYCD), using 10 nM of MLYCD-siRNA molecules. The mRNA expression was abolished, while Western blot analyses revealed a 73% reduction in MLYCD protein level (Fig. 7A). The incomplete protein silencing may be explained by its half-life of more than 12 h (Clark et al., 2012). Moreover, the HSC transfection with the non-targeting pool of siRNAs did not yield differences either in MLYCD transcript or protein levels, when compared to the control group.
Fig. 7.
Functional analyses of the effect of MLYCD gene silencing in groups of LX-2. (A) MLYCD mRNA and protein levels (B) TGF-β1 production measured by ELISA. (C) mRNA and protein levels of the fibrotic marker α-SMA. (D) Lipid droplets amount in LX-2 cultures. (E) UART-FITR spectra of LX-2 groups from regions 4000–450 cm−1 containing major assigned bands for lipids (regions 3000–2850 cm−1 – arrow), which were relative quantified. (F) Fatty acid oxidation in LX-2 groups. (G) Citrate synthase measurements. Graphs were plotted using values of the average from three independent experiments, and the error bars represent the standard deviation of the mean. ANOVA testing was applied. The significance level was set at p < 0.05.
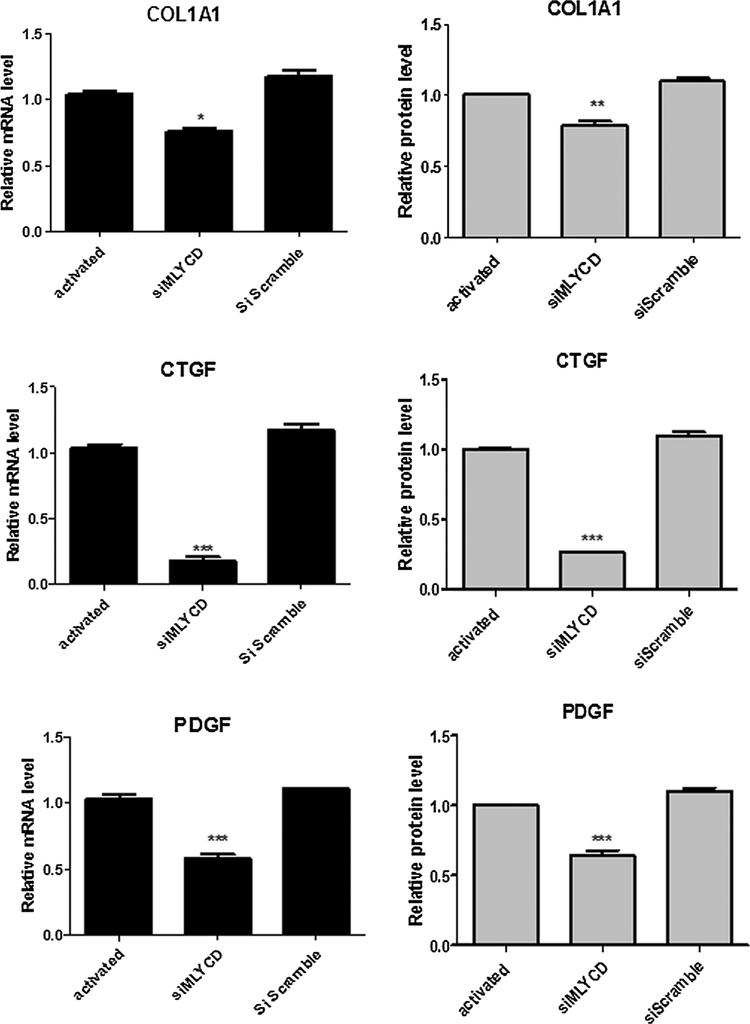
In addition, in siMLYCD cells reduced TGF-β1 expression (Fig. 7B) and α-SMA mRNA and protein levels (Fig. 7C), compared to the activated group. These results suggest that the MLYCD knock-down contributes to the control of initial pro-fibrotic stimuli in LX-2 cells. Other molecular markers of the pro-fibrotic stimuli, such as COL1A1, CTGF and PDGF-B were also reduced in siMLYCD cells (Fig. A3). Furthermore, LD in siMLYCD cells increased in number by approximately 50%, when compared to the activated cells (Fig. 7D). The same pattern of LD was found in ang-(1–7) treated cells and in miR-1914-5p transfected cells (Fig. 4), in which the expression level of MLYCD was also reduced (Fig. 6).
For the LX-2-siMLYCD cells, the UART-FITR analyses demonstrated a small decrease in the total amount of lipids, when compared to the activated ones (Fig. 7E). Moreover, in siMLYCD cells, the palmitic acid oxidation levels (Fig. 7F) and citrate synthase activity (Fig. 7G) were reduced near to the level found in activated LX-2 transfected with the miR-1914-5p. In addition, no major changes were observed in cells transfected with the On-Target Plus Non-targeting siRNA.
Moreover, to uncover details of the molecular activity of ang-(1–7) or miR-1914-5p in fatty acid metabolism, the expression levels of relevant molecules that control this metabolic pathway after palmitic acid synthesis were investigated: acyl-CoA synthetase (ACSL), glycerol-3-phosphate acyltransferases (GPATs), acylglycerolphosphate acyltransferases (AGPATs), Lipin-1, diglyceride acyltransferase (DGAT)1, DGAT2, adipose triglyceride lipase (ATGL), hormone sensitive lipase (HSL) and monoacylglycerol lipase (MAGL) (Currie et al., 2013). The results revealed differences in the mRNA expression in LX-2 groups of cells for ACSL4, LIPIN1 and DGATs genes.
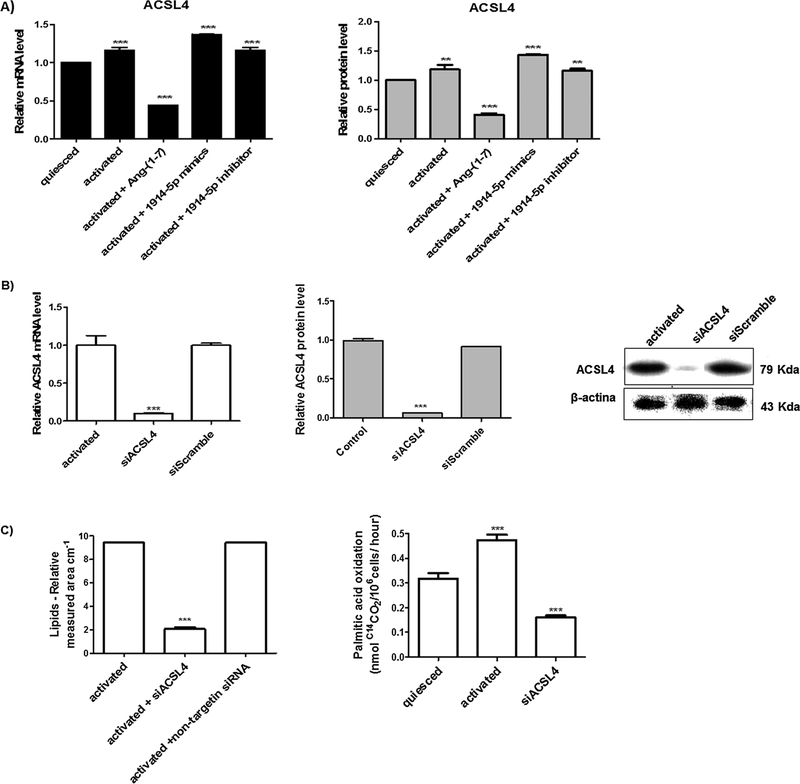
ACSL enzymes activate intracellular long chain fatty acids providing acyl-CoA substrates for several metabolic fates such as lipid synthesis or β-oxidation. ACSL4 mRNA expression is increased in HSCs activated cells, as demonstrated by Tuohetahuntila et al. (2015). Our assays also presented high ACSL4 mRNA expression in activated cells as in LX-2 transfected cells (Fig. 8A). In the heptapeptide treated-groups, there was an expressive reduction in gene expression and protein level compared to the other groups (Fig. 8A). To address the physiological effect of ACSL4 in our model, we knocked down this mRNA (siACSL4 cells), reducing the protein level (Fig. 8B). In addition, the lipid content and the fatty acid oxidation reduced considerable when compared to the activated cells (Fig. 8C), as observed in ang-(1–7) treated cells, suggesting the existence of cellular connections that support the mitochondrial oxidation processes and cellular maintenance (Fig. 5), probably by the compensatory activity of different ACSL isoforms. For the miRNA-1914-5p-transfected cells, higher levels of ACSL4 may favor higher fatty acid oxidation as found in activated cells and demonstrated in Fig. 5B.
Fig. 8.
LX-2 fatty acid metabolism and ACSL4 connections. (A) ACSL4 mRNA and protein levels in LX-2 groups. (B) ACSL4 mRNA and protein levels in LX-2-si-ACSL4 cells. The protein was examined and quantified by western blot, and β-actin was used as the loading control. (C) Fatty acid total amount and palmitic acid oxidation in LX-2-si-ACSL4 cells was plotted in graphs. Graphs and images present mean values from at least three independent experiments. The significance level was set at p < 0.05.
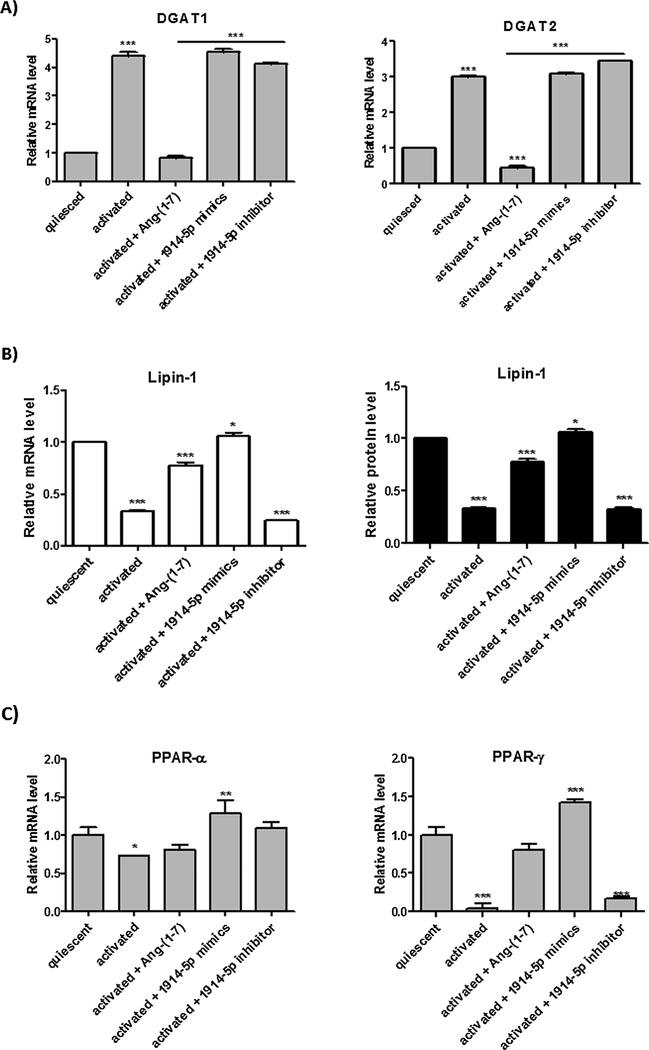
We also investigated LD assemble in ang-(1–7)-treated and miR-1914-5p-transfected cells, and special attention was given to the expression level of DGATs enzymes. DGATs (DGAT1 and DGAT2) are enzymes involved in lipogenesis and fatty acid storage control (Currie et al., 2013). These enzymes esterify diacylglycerol (DAG) and acyl-CoA into triacylglycerol (TAG). Recently, Yuen et al. (2015) demonstrated that the DGAT-1 inhibition favors the accumulation of LDs in HSCs, in opposition to what was described for hepatocytes. The same authors pointed that Dgat1–/– rat livers were protected against fibrosis. In our assays, the relative gene expression of two mammalian DGATs, DGAT1 and DGAT2, were found reduced only in quiesced and in heptapeptide-treated cells (Fig. 9A), supporting the increased number of LDs (Fig. 4C) present in those cells.
Fig. 9.
Major assigned genes in fatty acid storage metabolism in LX-2-heptapeptide treated and miR-1914-5p mimic-transfected cells. (A) Relative mRNA expression for DGAT1 and DGAT2 in different groups of cells. (B) lipin-1 mRNA and protein expression were analyzed in LX-2. (C) PPAR-transcriptional factors were also investigated at mRNA and protein levels. In western blot assays, β-actin was used as the loading control. The graphs and images present mean values of the average from at least three independent experiments. The significance level was set at p < 0.05.
However, the assembly of LD in miR-1914-5p-transfected cells demonstrated to be modulated by a molecular route, where Lipin-1 plays a role. This enzyme is a Mg(2 +)-dependent phosphatidic acid phosphohydrolases (PAP) that acts in the penultimate step in triglyceride (TG) synthesis (Han et al., 2006), facilitating the assembly of LD mediated by the direct interaction with perilipin proteins (Skinner et al., 2009). In our assays, the Lipin-1 relative gene expression and protein level decreased in activated cells as found in Jang et al. (2016). However, the level of Lipin-1 increased both in the heptapeptide treated-groups and even more in the miR-mimic-1914-5p transfected cells, when compared to the level found in activated cells (Fig. 9B). In addition, Lipin-1 acts as molecular scaffold considering its interactions with different transcriptional factors, leading the activation or repression of gene transcription in lipid metabolic pathway (Harris and Finck, 2011). In our study, the mRNA level of peroxisome proliferator-activated receptor (PPAR)-α and PPAR-γ increased in miR-mimic-1914-5p transfected cells (Fig. 9C), contributing to the homeostatic lipid metabolism (Bou et al., 2010) in LX-2 cells. In addition, the high expression levels of those molecules could be related with the increased fatty acid oxidation (Finck et al., 2006) found in miR-mimic-1914-5p transfected cells (Fig. 5B) and even to the control of the pro-fibrogenic environment in LX-2 (Jang et al., 2016) (Fig. 1).
4. Discussion
Hepatic fibrosis is a worldwide health concern, and no effective therapy is currently available. In addition, the advanced liver fibrosis impairs liver functions, which may favor the development of hepatocellular carcinoma (HCC) (Saeki et al., 2013; Sakurai and Kudo, 2013; Waller et al., 2015); then, liver fibrosis controlling is mandatory. Considering the relevant function of HSCs in the establishment of hepatic fibrosis, in this study, the molecular response of activated LX-2 to the treatment of the heptapeptide angiotensin-(1–7) was investigated, revealing the miR-1914-5p as an element that modulates the lipid metabolism in such cell line, changes cellular environment, and contributes to the control of molecular markers of hepatic fibrogenesis.
Angiotensin-(1–7) modulates several metabolic pathways. Shearn et al. (2014) reported that the modulatory activity of the heptapeptide in the AKT pathway influences the lipid metabolism. Singh et al. (2010) demonstrated the effect of the ang-(1–7) in changing lipid composition in renal cortical tissue in diabetic rats. Other studies demonstrated the effect of the ang-(1–7) in reducing levels of lipids in the plasma and in the whole body (Moreira et al., 2017; Santos et al., 2010; Schuchard et al., 2015; Tang et al., 2017), in preventing or positive controlling hepatic steatosis (Cao et al., 2016; Feltenberger et al., 2013; Moreira et al., 2017; Simões et al., 2017), and in antifibrotic activity (Cai et al., 2016; Lubel et al., 2009; Simões et al., 2017). In our analyses, ang-(1–7) modulated pro-fibrotic markers, lipid metabolism and the expression pattern of miRNAs in LX-2 cells, including the miR-1914-5p. In our assays, this miRNA modulated the biochemistry of lipid metabolism, contributing to the LX-2 phenotypic reversion from a myofibroblast-like form to a more quiesced stellate cells. However, the mechanistic differences observed between the effects of the ang-(1–7) and the isolated miR-mimic-1914-5p in LX-2 are supported by the fact that many molecular players are expressed and work synchronically when cells are treated with the peptide, including the miR-1914-5p. On the other hand, the miR-mimic-1914-5p acts on its molecular routes without any interference from molecular effectors coming from the heptapeptide transduction cellular signaling. The accurate analysis of the miR-1914-5p, demonstrated its relevant function in lipid metabolism, which may be useful in future drug development.
Considering the investigated elements, ACC2 emerged as a molecule that would probably modulated the β-oxidation reduction in the heptapeptide-treated cells (Vance and Vance, 2008) in LX-2 (Figs. 5, 6 and 10). The product of this enzyme (malonyl-CoA) blocks carnitine palmitoyltransferase 1 (CPT1) protein and avoids mitochondrial FA oxidation. In our assay, the increased expression of the ACC2 gene was observed exclusively in heptapeptide-treated cells (Fig. 6). In Feltenberger et al. (2013), the ang-(1–7) administration in mice fed with high-fat diet also suggested a modulatory function of the heptapeptide in the reduction of mitochondrial fatty acid oxidation. In addition, under different molecular connections, the heptapeptide and the miR-1914-5p reduced the MLYCD protein level. This reduction favors the accumulation of malonyl-CoA produced by the ACC1 enzyme, and the downstream cellular events that contribute to LDs reassembly and to the control of fibrotic markers level to a more quiesced state (Fig. 4). In heptapeptide-treated cells, the transcriptional pattern of MLYCD matches the protein level (Fig. 6), suggesting the existence of a regulatory mechanism closely dependent on transcriptional regulation. In miR-mimic-1914-5p transfected cells, the results pointed to the presence of post-transcriptional gene silencing (PTGS) in the control of MLYCD enzyme level in LX-2. The RNAi was clearly verified in the cells by translational repression of the enzyme (Carthew and Sontheimer, 2009) mediated by the interaction of mRNA-mimic (Figs. 6, A2), ensuring cellular survival, as the imbalanced MLYCD expression creates a toxic environment, which may induce cellular death. In a systemic point of view, both the ang-(1–7) and the miR-1914-5p modulate MLYCD, whose cellular activity plays a relevant function in LX-2 lipid metabolism, contributing to the transdifferentiation processes by its direct effect on the pro-fibrotic elements (Figs. 1 and 4, Fig. A1). The siMLYCD analyses corroborated the relevant function of this enzyme on the LX-2 metabolism (Figs. 7, A2).
Fig. 10.
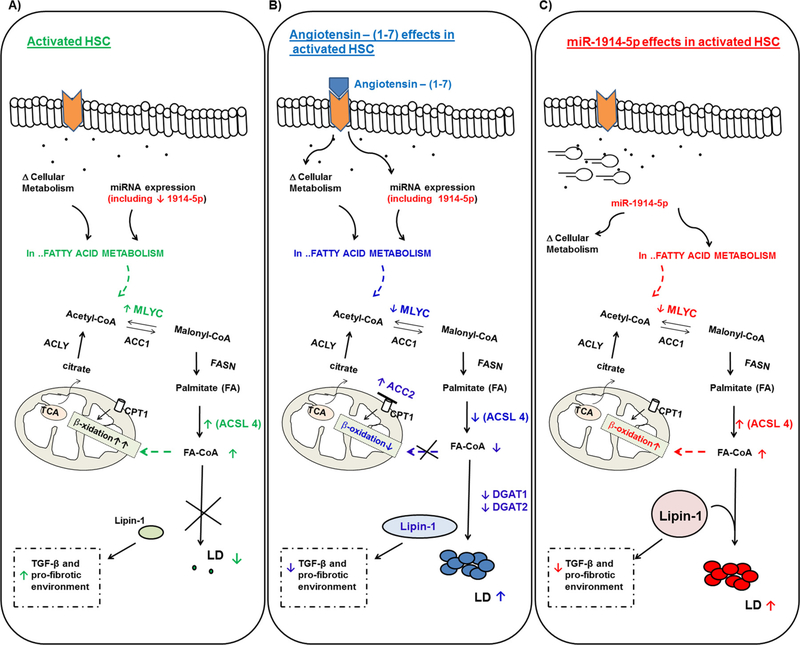
Schematic representation summarizing the effects of the ang-(1–7) and the miRNA-1914-5p in activated LX-2 lipid metabolism and their connections on the control of profibrotic environment. Central elements of the lipid metabolism pathway are represented. Target molecules, whose molecular effects support the major differences between the groups are presented in color letters: green; blue and red for (A) activated LX-2; (B) angiotensin-(1–7) treated cells; (C) miRNA-1914-5p transfected-cell. Symbols represent the connections as follow: (↑) increased amount; (↓) decreased amount; (X) pathway inhibition; ( ) structure blockage. (For interpretation of the references to colour in this figure legend, the reader is referred to the web version of this article.)
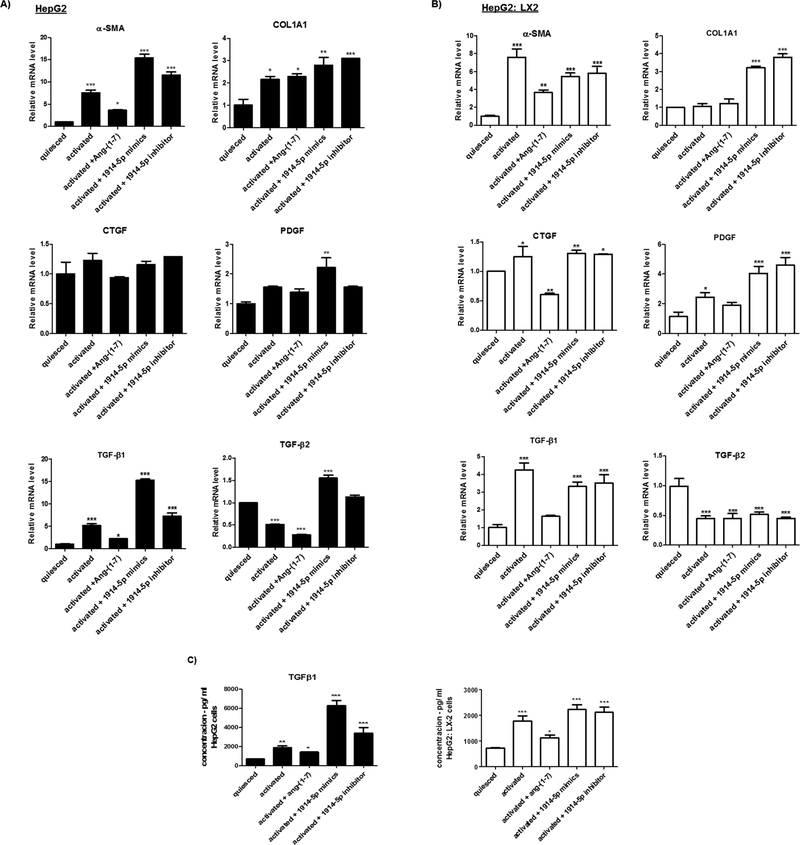
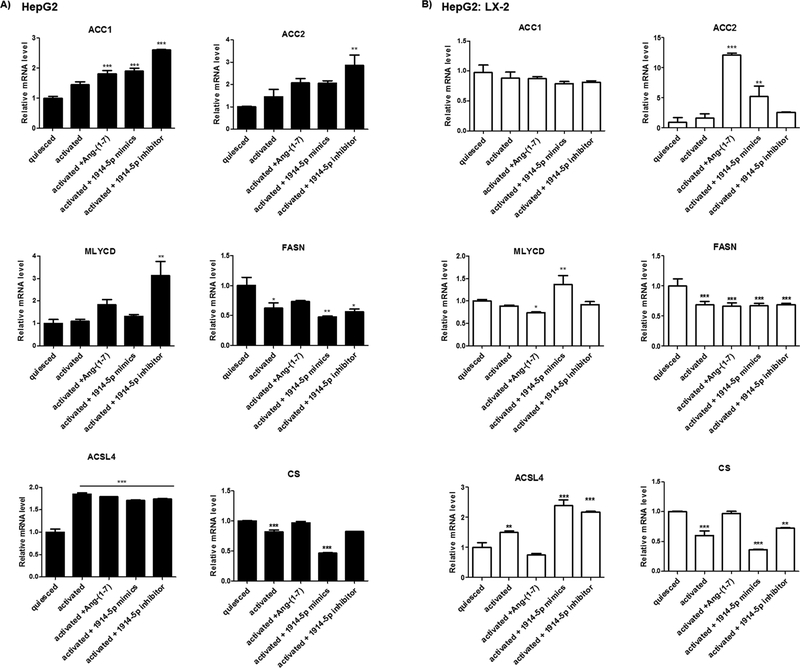
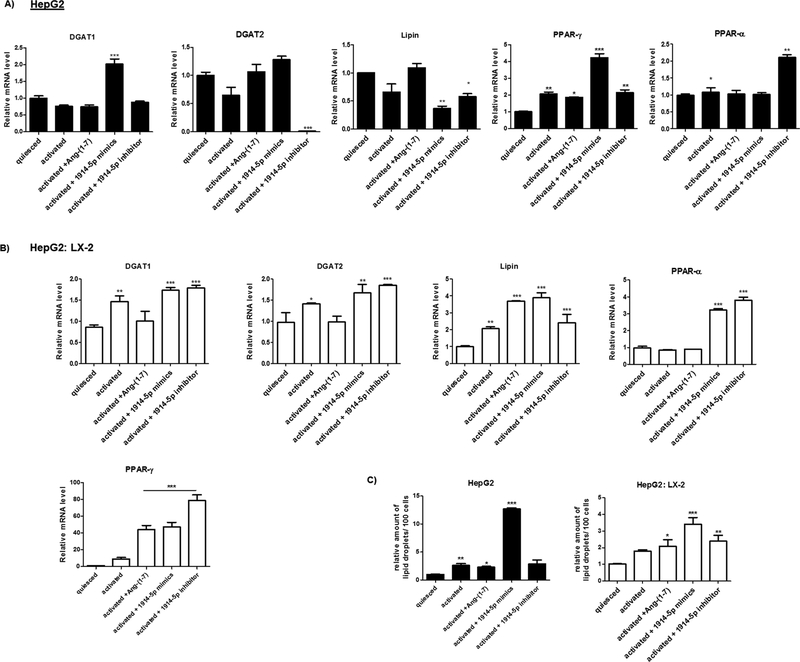
Moreover, the analyses of the ACSL4 reinforced the differences between metabolic routes conducted by the heptapeptide and the miRNA-1914-5p in LX-2 cells. The ACSL4 is the only ACSL isoform upregulated in activated cells (Tuohetahuntila et al., 2015), facilitating changes in lipid metabolism. In heptapeptide-treated cells, the low ACSL4 level found (Fig. 8) associated to the high ACC2 expression (Fig. 6) could have contributed to the low palmitate oxidation level (Figs. 5 and 10). Moreover, the high number of LD observed is probably correlated with the increased level of Lipin-1 (Fig. 9) and could have been intensified by the reduced levels of DGATs molecules (Yuen et al., 2015) (Fig. 9). In miRNA-mimic-transfected LX-2 cell, higher levels of ACSL4, Lipin-1 and DGATs were found. The increased level of ACSL4 may have contributed to the increased palmitate oxidation found in those cells (Fig. 5), and LD assembling would be more connected to Lipin-1, having occurred independently from DGAT-1 and DGAT-2. Moreover, in Jang et al. (2016), the authors demonstrated that Lipin-1 is able to regulate the fibrogenesis and TGF-β signaling in hepatic stellate cells. In our cellular model, the effective controlling of pro-fibrotic stimuli and the transdifferenciation processes mediated by the effect of the heptapeptide or the miR-1914-5p connects to the lipid metabolism. In addition, co-culture assays of LX-2 and the hepatocyte cell line HepG2, heptapeptide-treated or miR-1914-5p-transfected also reinforced the relevant function of the miR-1914-5p in cellular lipid metabolism and in the control of pro-fibrotic environment. Supplemental File discuss and presents the results of the assays performed using the two cell lines and the physiological effects of the miR-1914-5p. Fig. A4, Fig. A5 and Fig. A6 summarize the results, whose complete explanation is described in attached file.
In conclusion, the results demonstrated that the miR-1914-5p contributed to the LX-2 transdifferentiation based on the response of the cells to the ang-(1–7) treatment, both molecules downregulate MLYCD levels and normalize LD number through distinct mechanisms. Fig. 10 presents a schematic overview of the modulatory effect of the investigated molecules in the lipid metabolism pathway in LX-2.
Therefore, the clarification of how the molecular interplays modulated by the heptapeptide fine-tunes lipid metabolism is relevant to the development of new biotechnological strategies. The characterization of such molecular markers may be a useful probe in understanding and promoting the reversion of hepatic diseases. Unfortunately, there were certain limitations to our study, considering that primary human cells are difficult to obtain, and the non-existence of hsa-miR-1914-5p orthologue to validate its in vivo physiological function. Future indirect approaches might validate our findings and the mechanistic effect of the miR-1914-5p in human system biology.
Supplementary Material
Acknowledgements
We thank the professors Santos CF and Morales, MAM for the machine ViiA™ 7 and Step One™ Real-Time PCR System. This study was supported by research grants from Fundação de Amparo à Pesquisa do Estado de São Paulo (FAPESP) 2013/21186-5, 2010/17259-9 and 2009/07671-2.
APPENDIX
Fig. A1.
Fibrotic markers expression in LX-2-miR-1914-5p mimic transfected cells. Transcriptional and protein levels of fibrotic markers were evaluated in different groups of LX-2 cells. The graphs represent the mean values of at least three independent experiments (p < 0.05).
Fig. A2.
Dual-luciferase assays corroborates the physical interaction between the miRNA-1914-5p mimic and the MLYCD-3′- UTR. pGL3-Control group was used as reference in the assays. (A) Representative potential target sequences of the MLYCD-3′- UTR and MLYCDmut-3′- UTR and the miR-1914-5p. (B) Relative luciferase activity in pGL3-MLYCD-3′- UTR cells co-transfected or not with the 1914-5p miRNA mimic or inhibitor.(C) Relative luciferase activity in pGL3-MLYCDmut-3′- UTR cells co-transfected or not with the 1914-5p miRNA mimic or inhibitor, where the presence of small molecules did not affect the luciferase production. The graphs represent the mean values of at least three independent experiments (p < 0.05).
Fig. A3.
Fibrotic markers expression in LX-2 −siMLYCD cells. Transcriptional and protein levels of fibrotic markers were evaluated in different groups of LX-2 cells cultivated in 10% of FBS (activated). The graphs represent the mean values of at least three independent experiments (p < 0.05).
Fig. A4.
Pro-fibrotic markers expression in HepG2 and HepG2: LX-2 co-cultured cells cultivated under different conditions. (A and B) Transcriptional level of fibrotic markers was evaluated in different groups of cells by qRT-PCR. (C) TGF-β1 production measured by ELISA. The graphs represent the mean values of at least three independent experiments (p < 0.05).
Fig. A5.
Molecular connectors of fatty acid biosynthesis in HepG2 (A) and HepG2: LX-2 co-cultured cells. The Figure presents relative mRNA expression of the main genes of fatty acids pathway. Graphs represent values of the average from three independent experiments, and the error bars represent the standard deviation of the mean. ANOVA analysis showed significant differences (p < 0.05).
Fig. A6.
Major assigned genes in fatty acid storage metabolism in HepG2 (A) and HepG2: LX-2 co-cultured. (C) Lipid droplets from the different groups of cells were stained by Oil Red O and the detected droplets were quantified using Image J software. The graphs and images present mean values of the average from at least three independent experiments. The significance level was set at p < 0.05.
Footnotes
Conflict of interest
The authors report no conflict of interest.
Appendix B. Supplementary data
Supplementary data associated with this article can be found, in the online version, at https://doi.org/10.1016/j.biocel.2018.02.018.
References
- Ahmed M, 2015. Non-alcoholic fatty liver disease in 2015. World J. Hepatol. 7, 1450–1459. 10.4254/wjh.v7.i11.1450. [DOI] [PMC free article] [PubMed] [Google Scholar]
- Ambros V, 2003. MicroRNA pathways in flies and worms: growth, death, fat, stress and timing. Cell 113, 673–676. 10.1016/S0092-8674(03)00428-8. [DOI] [PubMed] [Google Scholar]
- Bartel DP, 2004. MicroRNAs: genomics, biogenesis, mechanism, and function. Cell 116, 281–297. 10.1016/S0092-8674(04)00045-5. [DOI] [PubMed] [Google Scholar]
- Bartel DP, 2009. MicroRNAs: target recognition and regulatory functions. Cell 136, 215–233. 10.1016/j.cell.2009.01.002. [DOI] [PMC free article] [PubMed] [Google Scholar]
- Bou KM, Blais A, Figeys D, Yao Z, 2010. Lipin – the bridge between hepatic glycerolipid biosynthesis and lipoprotein metabolism. Biochim. Biophys. Acta 180, 1249–1259. 10.1016/j.bbalip.2010.07.008. [DOI] [PubMed] [Google Scholar]
- Cai SM, Yang RQ, Li Y, Ning ZW, Zhang LL, Zhou GS, Luo W, Li DH, Chen Y, Pan MX, Li X, 2016. Angiotensin-(1–7) improves liver fibrosis by regulating the NLRP3 inflammasome via redox balance modulation. Antioxid. Redox. Signal 24, 795–812. 10.1089/ars.2015.6498. [DOI] [PubMed] [Google Scholar]
- Cao X, Yang F, Shi T, Yuan M, Xin Z, Xie R, Li S, Li H, Yang JK, 2016. Angiotensin-converting enzyme 2/angiotensin-(1–7)/Mas axis activates AKT signaling to ameliorate hepatic steatosis. Sci. Rep 17, 21592 10.1038/srep21592. [DOI] [PMC free article] [PubMed] [Google Scholar]
- Carthew RW, Sontheimer EJ, 2009. Origins and mechanisms of miRNAs and siRNAs. Cell 20, 642–655. 10.1016/j.cell.2009.01.035. [DOI] [PMC free article] [PubMed] [Google Scholar]
- Clark MB, Johnston RL, Inostroza-Ponta M, Fox AH, Fortini E, Moscato P, Dinger ME, Mattick JS, 2012. Genome-wide analysis of long noncoding RNA stability. Genome Res. 22, 885–898. 10.1101/gr.131037.111. [DOI] [PMC free article] [PubMed] [Google Scholar]
- Currie E, Schulze A, Zechner R, Walther TC, Farese RV Jr., 2013. Cellular fatty acid metabolism and cancer. Cell Metab. 18, 153–161. 10.1016/j.cmet.2013.05.017. [DOI] [PMC free article] [PubMed] [Google Scholar]
- Da Silva W, Dos Santos RA, Moraes KC, 2016. Mir-351-5p contributes to the establishment of a pro-inflammatory environment in the H9c2 cell line by repressing PTEN expression. Mol. Cell. Biochem 411, 363–371. 10.1007/s11010-015-2598-5. [DOI] [PubMed] [Google Scholar]
- Fabian MR, Sonenberg N, Filipowicz W, 2010. Regulation of mRNA translation and stability by microRNAs. Annu. Rev. Biochem 79, 351–379. 10.1146/annurev-biochem-060308-103103. [DOI] [PubMed] [Google Scholar]
- Feltenberger JD, Andrade JM, Paraíso A, Barros LO, Filho AB, Sinisterra RD, Sousa FB, Guimarães AL, de Paula AM, Campagnole-Santos MJ, Qureshi M, dos Santos RA, Santos SH, 2013. Oral formulation of angiotensin-(1–7) improves lipid metabolism and prevents high-fat diet-induced hepatic steatosis and inflammation in mice. Hypertension 62, 324–330. 10.1161/HYPERTENSIONAHA.111.00919. [DOI] [PubMed] [Google Scholar]
- Ferreira AJ, Santos RAS, Almeida AP, 2001. Angiotensin-(1–7): cardioprotective effect in myocardial ischemia/reperfusion. Hypertension 38, 665–668. 10.1161/01.HYP.38.3.665. [DOI] [PubMed] [Google Scholar]
- Finck BN, Gropler MC, Chen Z, Leone TC, Croce MA, Harris TE, Lawrence JC Jr., Kelly DP, 2006. Lipin 1 is an inducible amplifier of the hepatic PGC-1alpha/ PPARalpha regulatory pathway. Cell Metab. 4, 199–210. 10.1016/j.cmet.2006.08.005. [DOI] [PubMed] [Google Scholar]
- Friedman SL, Roll FJ, Boyles J, Bissell DM, 1985. Hepatic lipocyte: the principal collagen-producing cells of normal rat liver. Proc. Natl. Acad. Sci 82, 8681–8685. [DOI] [PMC free article] [PubMed] [Google Scholar]
- Friedman SL, 2008. Hepatic stellate cells: protean, multifunctional, and enigmatic cells of liver. Physio. Rev. 88, 125–172. 10.1152/physrev.00013.2007. [DOI] [PMC free article] [PubMed] [Google Scholar]
- Griffiths-Jones S, Grocock RJ, van Dongen S, Bateman A, Enright AJ, 2006. miRBase: microRNA sequences, targets and gene nomenclature. Nucleic Acids Res. 34, D140–144. [DOI] [PMC free article] [PubMed] [Google Scholar]
- Hamilton RJ, Cast J, 1999. Spectral Properties of Lipids. Blackwell Press; 424. [Google Scholar]
- Han GS, Wu WI, Carman GM, 2006. The Saccharomyces cerevisiae Lipin homolog is a Mg2+-dependent phosphatidate phosphatase enzyme. J. Biol. Chem 281, 9210 10.1074/jbc.M6004425200. [DOI] [PMC free article] [PubMed] [Google Scholar]
- Harris TE, Finck BN, 2011. Dual function lipin proteins and glycerolipid metabolism. Trends Endocrinol. Metab. 22, 226–233. 10.1016/j.tem.2011.02.006. [DOI] [PMC free article] [PubMed] [Google Scholar]
- Hernández-Gea V, Ghiassi-Nejad Z, Rozenfeld R, Gordon R, Fiel MI, Yue Z, Czaja MJ, Friedman SL, 2012. Autophagy releases lipid that promotes fibrogenesis by activated hepatic stellate cells in mice and in human tissues. Gastroenterology 142, 938–946. 10.1053/j.gastro.2011.12.044. [DOI] [PMC free article] [PubMed] [Google Scholar]
- Hsu YL, Hung JY, Lee YL, Chen FW, Chang KF, Chang WA, Tsai YM, Chong IW, Kuo PL, 2017. Identification of novel gene expression signature in lung adenocarcinoma by using next-generation sequencing data and bioinformatics analysis. Oncotarget 18, 104831–104854. 10.18632/oncotarget.21022. eCollection 2017 December 1. [DOI] [PMC free article] [PubMed] [Google Scholar]
- Imamura T, Komatsu S, Ichikawa D, Miyamae M, Okajima W, Ohashi T, Kiuchi J, Nishibeppu K, Kosuga T, Konishi H, Shiozaki A, Okamoto K, Fujiwara H, Otsuji E, 2017. Low plasma levels of miR-101 are associated with tumor progression in gastric cancer. Oncotarget 13, 106538–106550. 10.18632/oncotarget.20860. [DOI] [PMC free article] [PubMed] [Google Scholar]
- Ito T, Shibasaki S, 1968. Electron microscopy study on the hepatic sibusoidal wall and fat-storing cells in the normal human liver. Arch. Histol. Jpn 29, 137–192. [DOI] [PubMed] [Google Scholar]
- Jang CH, Kim KM, Yang JH, Cho SS, Kim SJ, Shin SM, Cho IJ, Ki SH, 2016. The role of lipin-1 in the regulation of fibrogenesis and TGF-β signaling in hepatic stellate cells. Toxicol. Sci 153, 28–38. 10.1093/toxsci/kfw109. [DOI] [PubMed] [Google Scholar]
- Kocabayoglu P, Friedman SL, 2013. Cellular basis of hepatic fibrosis and its role in inflammation and cancer. Front. Biosci 5, 217–230. 10.2741/S368.ScholEd. [DOI] [PubMed] [Google Scholar]
- Le MH, Devaki P, Ha NB, Jun DW, Te HS, Cheung RC, Nguyen MH, 2017. Prevalence of non-alcoholic fatty liver disease and risk factors for advanced fibrosis and mortality in the United States. PLoS One 12, e0173499 10.1371/journal.pone.0173499. [DOI] [PMC free article] [PubMed] [Google Scholar]
- Lee Y, Friedman SL, 2010. Fibrosis in the liver: acute protection and chronic disease. Prog. Mol. Biol. Transl. Sci 97, 151–200. 10.1016/B978-0-12385233-5.00006-4. [DOI] [PubMed] [Google Scholar]
- Lee TF, Mark KM, Rackovsky O, Lin YL, Kwong AJ, Loke JC, Friedman SL, 2010. Downregulation of hepatic stellate cell activation by retinol and palmitate mediated by adipose differentiation-related protein (ADRP). J. Cell. Physiol 223, 648–657. 10.1002/jcp.22063. [DOI] [PMC free article] [PubMed] [Google Scholar]
- Lida-Ueno A, Enomoto M, Tamori A, Kawada N, 2017. Hepatitis B virus infection and alcohol consumption. World J. Gastroenterol 23, 2651–2659. 10.3748/wjg.v23.i15.2651. [DOI] [PMC free article] [PubMed] [Google Scholar]
- Loot AE, Roks AJ, Henning RH, Tio RA, Suurmeijer AJ, Boomsma F, van Gilst WH, 2002. Angiotensin-(1–7) attenuates the development of heart failure after myocardial infarction in rats. Circulation 105, 1548–1550. 10.1161/01.CIR.000001347.07035.B9. [DOI] [PubMed] [Google Scholar]
- Lubel JS, Herath CB, Tchongue J, Grace J, Jia Z, Spencer K, Casley D, Crowley P, Sievert W, Burrell LM, Angus PW, 2009. Angiotensin-(1–7), an alternative metabolite of the renin-angiotensin system, is up-regulated in human liver disease and has antifibrotic activity in the bile-duct-ligated rat. Clin. Sci. (Lond.) 117, 375–386. 10.1042/CS20080647. [DOI] [PubMed] [Google Scholar]
- Massao Hirabara S, de Oliveira Carvalho CR, Mendonça JR, Piltcher Haber E, Fernandes LC, Curi R, 2003. Palmitate acutely raises glycogen synthesis in rat soleus muscle by a mechanism that requires its metabolization (Randle cycle). FEBS Lett. 541, 109–114. 10.1016/S0014-5793(03)00316-8. [DOI] [PubMed] [Google Scholar]
- Meijer HA, Kong YW, Lu WT, Wilczynska A, Spriggs RV, Robinson SW, Godfrey JD, Willis AE, Bushell M, 2013. Translational repression and eIF4A2 activity are critical for microRNA-mediated gene regulation. Science 340, 82–85. 10.1126/science.1231197. [DOI] [PubMed] [Google Scholar]
- Mokdad AA, Lopez AD, Shahraz S, Lozano R, Mokdad AH, Stanaway J, Murray CJ, Naghavi M, 2014. Liver cirrhosis mortality in 187 countries between 1980 and 2010: a systematic analysis. BMC Med. 12, 145 10.1186/s12916014-0145-y. [DOI] [PMC free article] [PubMed] [Google Scholar]
- Molenaar MR, Vaandrager AB, Helms JB, 2017. Some lipid droplets are more equal than others: different metabolic lipid droplet pools in hepatic stellate cells. Lipid Insights 10 10.1177/1178635317747281.1178635317747281. [DOI] [PMC free article] [PubMed] [Google Scholar]
- Moreira de Macêdo S, Guimarães TA, Feltenberger JD, Sousa Santos SH, 2014. The role of renin-angiotensin system modulation on treatment and prevention of liver diseases. Peptides 62, 189–196. 10.1016/j.peptides.2014.10.005. [DOI] [PubMed] [Google Scholar]
- Moreira CCL, Lourenço FC, Mario ÉG, Santos RAS, Botion LM, Chaves VE, 2017. Long-term effects of angiotensin-(1–7) on lipid metabolism in the adipose tissue and liver. Peptides 92, 16–22. 10.1016/j.peptides.2017.04.004. [DOI] [PubMed] [Google Scholar]
- Nayak NC, Vasdev N, Saigal S, Soin AS, 2010. End-stage nonalcoholic fatty liver disease: evaluation of pathomorphologic features and relationship to cryptogenic cirrhosis from study of explant livers in a living donor liver transplant program. Hum. Pathol 41, 425–430. 10.1016/j.humpath.2009.06.021. [DOI] [PubMed] [Google Scholar]
- Pappachan JM, Babu S, Krishnan B, Ravindran NC, 2017. Non-alcoholic fatty liver disease: a clinical update. J. Clin. Transl. Hepatol 5, 384–393. 10.14218/JCTH.2017.00013. [DOI] [PMC free article] [PubMed] [Google Scholar]
- Paraskevopoulou MD, Georgakilas G, Kostoulas N, Vlachos IS, Vergoulis T, Reczko M, Filippidis C, Dalamagas T, Hatzigeorgiou AG, 2013. DIANA-microT web server 5.0: service integration into miRNA functional analysis workflows. Nucleic Acids Res. 41, W169–173. 10.1093/nar/gkt393. [DOI] [PMC free article] [PubMed] [Google Scholar]
- Pereira RM, Dos Santos RA, Teixeira MM, Leite VH, Costa LP, da Costa Dias FL, Barcelos LS, Collares GB, Simões e Silva AC, 2007. The renin-angiotensin system in a rat model of hepatic fibrosis: evidence for a protective role of Angiotensin-(1–7). J. Hepatol 46, 674–681. 10.1016/j.jhep.2006.10.018. [DOI] [PubMed] [Google Scholar]
- Pirazzi C, Valenti L, Motta BM, Pingitore P, Hedfalk K, Mancina RM, Burza MA, Indiveri C, Ferro Y, Montalcini T, Maglio C, Dongiovanni P, Fargion S, Rametta R, Pujia A, Andersson L, Ghosal S, Levin M, Wiklund O, Iacovino M, Borén J, Romeo S, 2014. PNPLA3 has retinyl-palmitate lipase activity in uman hepatic stellate cells. Hum. Mol. Genet 23, 4077–4085. 10.1093/hmg/ddu121. [DOI] [PMC free article] [PubMed] [Google Scholar]
- Rasband WS, 1997. ImageJ, U. S. National Institutes of Health, Bethesda, Maryland, USA, URL: https://imagej.nih.gov/ij/. [Google Scholar]
- Reczko M, Maragkakis M, Alexiou P, Grosse I, Hatzigeorgiou AG, 2012. Functional microRNA targets in protein coding sequences. Bioinformatics 28, 771–776. 10.1093/bioinformatics/bts043. [DOI] [PubMed] [Google Scholar]
- Saeki I, Terai S, Fujisawa K, Takami T, Yamamoto N, Matsumoto T, Hirose Y, Murata Y, Yamasaki T, Sakaida I, 2013. Bortezomib induces tumor-specific cell death and growth inhibition in hepatocellular carcinoma and improves liver fibrosis. J. Gastroenterol 48, 738–750. 10.1007/s00535-012-0675-z. [DOI] [PubMed] [Google Scholar]
- Sakurai T, Kudo M, 2013. Molecular link between liver fibrosis and hepatocellular carcinoma. Liver Cancer 2, 365–366. 10.1159/000343851. [DOI] [PMC free article] [PubMed] [Google Scholar]
- Santos SH, Braga JF, Mario EG, Pôrto LC, Mda G, Murari A, Botion LM, Alenina N, Santos RA, 2010. Improved lipid and glucose metabolism in transgenic rats with increased circulating angiotensin-(1–7). Arterioscler. Thromb. Vasc. Biol 30, 953–961. 10.1161/ATVBAHA.109.200493. [DOI] [PubMed] [Google Scholar]
- Schuchard J, Winkler M, Stölting I, Schuster F, Vogt FM, Barkhausen J, Thorns C, Santos RA, Bader M, Raasch W, 2015. Lack of weight gain after angiotensin AT1 receptor blockade in diet-induced obesity is partly mediated by an angiotensin(1–7)/Mas-dependent pathway. Br. J. Pharmacol 172, 3764–3778. 10.1111/bph.13172. [DOI] [PMC free article] [PubMed] [Google Scholar]
- Shearn CT, Mercer KE, Orlicky DJ, Hennings L, Smathers-McCullough RL, Stiles BL, Ronis MJ, Petersen DR, 2014. Short term feeding of a high fat diet exerts an additive effect on hepatocellular damage and steatosis in liver-specific PTEN knockout mice. PLoS One 9, e96553 10.1371/journal.pone.0096553. [DOI] [PMC free article] [PubMed] [Google Scholar]
- Shirakami Y, Lee SA, Clugston RD, Blaner WS, 2012. Hepatic metabolism of retinoids and disease associations. Biochim. Biophys. Acta 1821, 124–136. 10.1016/j.bbalip.2011.06.023. [DOI] [PMC free article] [PubMed] [Google Scholar]
- Silva BdeO., Lima KF, Gonçalves LR, Silveira MB, Moraes KC, 2016. MicroRNA profiling of the effect of the heptapeptide angiotensin-(1–7) in A549 lung tumor cells reveals a role for miRNA 149-3p in cellular migration processes. PLoS One 11, e0162094 10.1371/journal.pone.0162094.eCollection2016. [DOI] [PMC free article] [PubMed] [Google Scholar]
- Simões E, Silva AC, Miranda AS, Rocha NP, Teixeira AL, 2017. Renin angiotensin system in liver diseases: friend or foe? World J. Gastroenterol 23, 3396–3406. 10.3748/wjg.v23.i19.3396. [DOI] [PMC free article] [PubMed] [Google Scholar]
- Singh K, Singh T, Sharma PL, 2010. Angiotensin (1–7)/Mas receptor axis activation ameliorates the changes in fatty acid composition in diabetic rats with nephropathy. J. Exp. Pharmacol 2, 163–168. 10.2147/JEP.S14342. [DOI] [PMC free article] [PubMed] [Google Scholar]
- Siu PM, Donley DA, Bryner RW, Always SE, 2003. Citrate synthase expression and enzyme activity after endurance training in cardiac and skeletal muscles. J. Appl. Physiol 94, 555–560. [DOI] [PubMed] [Google Scholar]
- Skinner JR, Shew TM, Schwartz DM, Tzekov A, Lepus CM, Abumrad NA, Wolins NE, 2009. Diacylglycerol enrichment of endoplasmic reticulum or lipid droplets recruits perilipin 3/TIP47 during lipid storage and mobilization. J. Biol. Chem 284, 30941–30948. 10.1074/jbc.M109.013995. [DOI] [PMC free article] [PubMed] [Google Scholar]
- Srere PA, 1969. Citrate synthase. Methods Enzymol 13, 3–11. 10.1016/0076-6879(69)13005-0. [DOI] [Google Scholar]
- Stuart BH, 2004. Infrared Spectroscopy: Fundamentals and Applications. John Wiley & Sons, pp. 244p. [Google Scholar]
- Su Z, Zimpelmann J, Burns KD, 2006. Angiotensin-(1–7) inhibits angiotensin II-stimulated phosphorylation of MAP kinases in proximal tubular cells. Kidney Int. 69, 2212–2218. 10.1038/sj.ki.5001509. [DOI] [PubMed] [Google Scholar]
- Szabo G, Bala S, 2013. MicroRNAs in liver disease. Nat. Rev. Gastroenterol. Hepatol 109, 542–552. 10.1038/nrgastro.2013.87. [DOI] [PMC free article] [PubMed] [Google Scholar]
- Tang A, Li C, Zou N, Zhang Q, Liu M, Zhang X, 2017. Angiotensin-(1–7) improves non-alcoholic steatohepatitis through an adiponectin-independent mechanism. Hepatol. Res 47, 116–122. 10.1111/hepr.12707. [DOI] [PubMed] [Google Scholar]
- Tata Biocenter Team, 2014. Exiqon GenEx 6 wizard, qPCR Analysis Software. MultiD Gothenburg, Sweden: URL: www.exiqon.com/qpcr-software. [Google Scholar]
- Tuohetahuntila M, Spee B, Kruitwagen HS, Wubbolts R, Brouwers JF, van de Lest CH, Molenaar MR, Houweling M, Helms JB, Vaandrager AB, 2015. Role of long-chain acyl-CoA synthetase 4 in formation of polyunsaturated lipid species in hepatic stellate cells. Biochim. Biophys. Acta 1851, 220–230. 10.1016/j.bbalip.2014.12.003. [DOI] [PubMed] [Google Scholar]
- Vance DE, Vance JE, 2008. Biochemistry of Lipids Lipoproteins and Membranes. Elsevier, pp. 631p.. [Google Scholar]
- Verano-Braga T, Schwämmle V, Sylvester M, Passos-Silva DG, Peluso AA, Etelvino GM, Santos RA, Roepstorff P, 2012. Time-resolved quantitative phosphoproteomics: new insights into Angiotensin-(1–7) signaling networks in human endothelial cells. J. Proteome Res 11, 3370–3381. 10.1021/pr3001755. [DOI] [PubMed] [Google Scholar]
- Waller LP, Deshpande V, Pyrsopoulos N, 2015. Hepatocellular carcinoma: a comprehensive review. World. J. Hepatol 7, 2648–2663. 10.4254/wjh.v7.i26.2648. [DOI] [PMC free article] [PubMed] [Google Scholar]
- Wang JY, Zhang Q, Wang DD, Yan W, Sha HH, Zhao JH, Yang SJ, Zhang HD, Hou JC, Xu HZ, He YJ, Hu JH, Zhong SL, Tang JH, 2017. MiR −29a: a potential therapeutic target and promising biomarker in tumors. Biosci. Rep 10.1042/BSR20171265. pii: BSR20171265. [DOI] [PMC free article] [PubMed] [Google Scholar]
- Wang E, 2010. Cancer Systems Biology. CRC Press; 456 p. [Google Scholar]
- Wilczynska A, Bushell M, 2015. The complexity of miRNA-mediated repression. Cell Death Differ. 22, 22–33. 10.1038/cdd.2014.112. [DOI] [PMC free article] [PubMed] [Google Scholar]
- Wong N, Wang X, 2015. miRDB: an online resource for microRNA target prediction and functional annotations. Nucleic Acids Res. 43, D146. [DOI] [PMC free article] [PubMed] [Google Scholar]
- Xu L, Hui AY, Albanis E, Arthur MJ, O’Byrne SM, Blaner WS, Mukherjee P, Friedman SL, Eng FJ, 2005. Human hepatic stellate cell lines, LX-1 and LX-2: new tools for analysis of hepatic fibrosis. Gut 54, 142–151. 10.1136/gut.2004.042127. [DOI] [PMC free article] [PubMed] [Google Scholar]
- Yuen JJ, Lee SA, Jiang H, Brun PJ, Blaner WS, 2015. DGAT1-deficiency affects the cellular distribution of hepatic retinoid and attenuates the progression of CCl4induced liver fibrosis. Hepatobiliary Surg. Nutr 4, 184–196. 10.3978/j.issn.2304-3881.2014.12.02. [DOI] [PMC free article] [PubMed] [Google Scholar]
Associated Data
This section collects any data citations, data availability statements, or supplementary materials included in this article.


