Abstract
Background
Hospital-related factors associated with mortality and morbidity after hip fracture surgery are not completely understood. The Veterans Health Administration (VHA) is the largest single-payer, networked healthcare system in the country serving a relatively homogenous patient population with facilities that vary in size and resource availability. These characteristics provide some degree of financial and patient-level controls to explore the association, if any, between surgical volume and facility resource availability and hospital performance regarding postoperative complications after hip fracture surgery.
Questions/purposes
(1) Do VHA facilities with the highest complexity level designation (Level 1a) have a disproportionate number of better-than-expected performance outliers for major postoperative complications compared with lower-complexity level facilities? (2) Do VHA facilities with higher hip fracture surgical volume have a disproportionate number of better-than-expected performance outliers for major postoperative complications compared with lower-volume facilities?
Methods
We explored the Veterans Affairs Surgical Quality Improvement Project (VASQIP) database from October 2001 to September 2012 for records of hip fracture surgery performed. Data reliability of the VASQIP database has been previously validated. We excluded nine of the 98 VHA facilities for contributing fewer than 30 records. The remaining 89 VHA facilities provided 23,029 records. The VHA designates a complexity level to each facility based on multiple criteria. We labeled facilities with a complexity Level 1a (38 facilities)–the highest achievable VHA designated complexity level—as high complexity; we labeled all other complexity level designations as low complexity (51 facilities). Facility volume was divided into tertiles: high (> 277 hip fracture procedures during the sampling frame), medium (204 to 277 procedures), and low (< 204 procedures). The patient population treated by low-complexity facilities was older, had a higher prevalence of severe chronic obstructive pulmonary disease (26% versus 22%, p < 0.001), and had a higher percentage of patients having surgery within 2 days of hospital admission (83% versus 76%, p < 0.001). High-complexity facilities treated more patients with recent congestive heart failure exacerbation (4% versus 3%, p < 0.001). We defined major postoperative complications as having at least one of the following: death within 30 days of surgery, cardiac arrest requiring cardiopulmonary resuscitation, new q-wave myocardial infarction, deep vein thrombosis and/or pulmonary embolism, ventilator dependence for at least 48 hours after surgery, reintubation for respiratory or cardiac failure, acute renal failure requiring renal replacement therapy, progressive renal insufficiency with a rise in serum creatinine of at least 2 mg/dL from preoperative value, pneumonia, or surgical site infection. We used the observed-to-expected ratio (O/E ratio)—a risk-adjusted metric to classify facility performance—for major postoperative complications to assess the performance of VHA facilities. Outlier facilities with 95% confidence intervals (95% CI) for O/E ratio completely less than 1.0 were labeled “exceed expectation;” those that were completely greater than 1.0 were labeled “below expectation.” We compared differences in the distribution of outlier facilities between high and low-complexity facilities, and between high-, medium-, and low-volume facilities using Fisher’s exact test.
Results
We observed no association between facility complexity level and the distribution of outlier facilities (high-complexity: 5% exceeded expectation, 5% below expectation; low-complexity: 8% exceeded expectation, 2% below expectation; p = 0.742). Compared with high-complexity facilities, the adjusted odds ratio for major postoperative complications for low-complexity facilities was 0.85 (95% CI, 0.67–1.09; p = 0.108).
We observed no association between facility volume and the distribution of outlier facilities: 3% exceeded expectation and 3% below expectation for high-volume; 10% exceeded expectation and 3% below expectation for medium-volume; and 7% exceeded expectation and 3% below expectation for low-volume; p = 0.890). The adjusted odds ratios for major postoperative complications were 0.87 (95% CI, 0.73–1.05) for low- versus high-volume facilities and 0.89 (95% CI, 0.79–1.02] for medium- versus high-volume facilities (p = 0.155).
Conclusions
These results do not support restricting facilities from treating hip fracture patients based on historical surgical volume or facility resource availability. Identification of consistent performance outliers may help health care organizations with multiple facilities determine allocation of services and identify characteristics and processes that determine outlier status in the interest of continued quality improvement.
Level of Evidence
Level III, therapeutic study.
Introduction
Hip fractures are a major public health concern that generate substantial healthcare costs [3]. Multiple studies have reported patient factors associated with mortality [22, 29]. The relationship between hospital hip fracture surgical volume and mortality has been studied, but an association has not been consistently observed [5, 7-10, 24, 27, 30]. Most reports suggest that teaching facilities have lower risk-adjusted mortality after hip fracture treatment when compared with community facilities [18, 19, 26, 32, 34]. However, to our knowledge, no studies have examined the effect of a hospital’s acuity level as an indication of resource availability and preparedness and its association with hip fracture mortality and postoperative morbidity.
The Veterans Health Administration (VHA) is the largest networked healthcare system in the country and may serve as a prototype for single-payer healthcare and bundled payment programs, which are increasing nationwide. The Veterans Affairs Surgical Quality Improvement Program (VASQIP) dataset has been validated for data reliability [6]. It was implemented in 1994 with the goal of monitoring quality and facilitating the implementation of improvement projects. Data are longitudinally maintained across all subspecialties across the VHA. There are advantages to exploring the VASQIP dataset. The VHA payment structure removes financial incentives for facilities to select patients, which may be a challenging confounder to account for when assessing facility performance [25]. Unique to the VHA is a complexity level designation for each facility that is related to the facility’s resource availability; this aids investigation into resource availability and facility performance.
The endpoint of mortality is both important and unambiguous; as such, it is often used in clinical and health-systems research, including studies on hip fracture [5, 7-10, 19]. However, postoperative complications contributing to morbidity may also be important for patients and healthcare providers. A commonly used risk-adjusted metric to assess facility performance is the observed-to-expect ratio (O/E ratio) for mortality and morbidity [11, 12]. The potential association between facility volume and facility complexity level designation—which we use as a proxy for resource availability—and risk-adjusted major postoperative complications after hip fracture surgery has not been explored.
In this study, we asked: (1) Do VHA facilities with the highest complexity level designation (Level 1a) have a disproportionate number of better-than-expected performance outliers for major postoperative complications compared with lower-complexity level facilities? (2) Do VHA facilities with higher hip fracture surgical volume have a disproportionate number of better-than-expected performance outliers for major postoperative complications compared with lower-volume facilities?
Patients and Methods
This retrospective, comparative study was reviewed and approved by the institutional review board and local VHA research committee with a waiver of informed consent. The sample obtained from the VASQIP database consisted of patient records from October 2001 to September 2012.
Study Subjects (Patient Level)
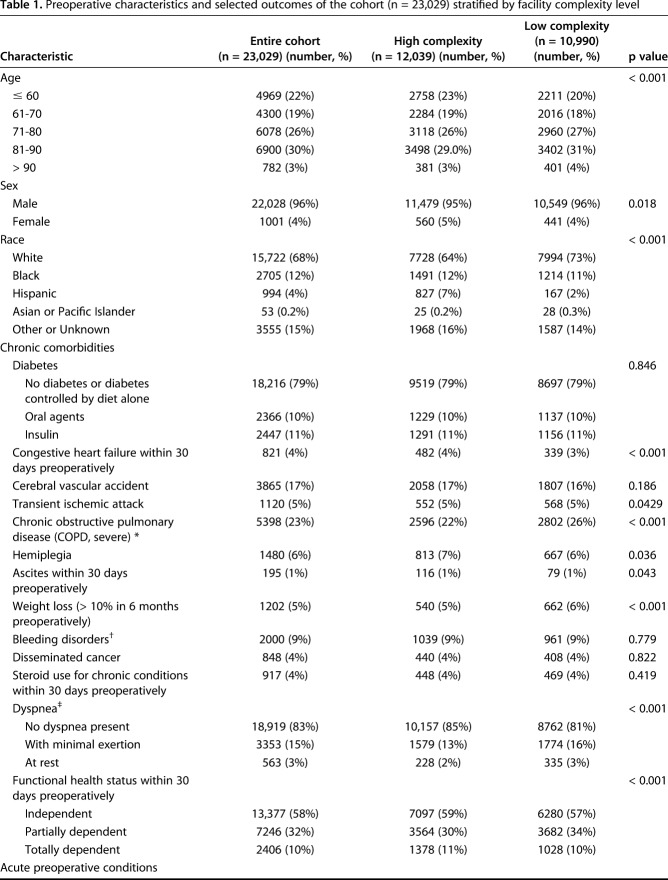
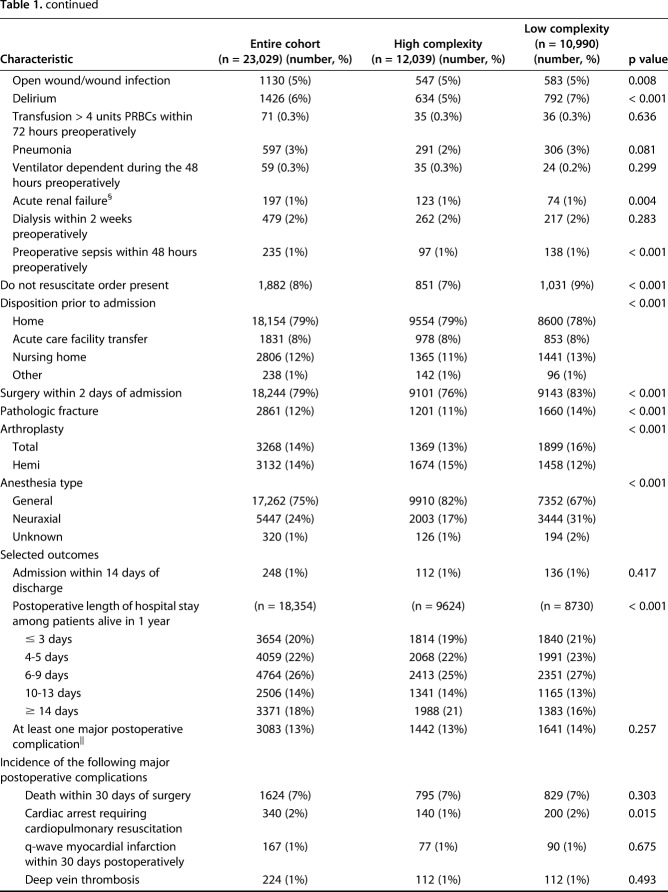
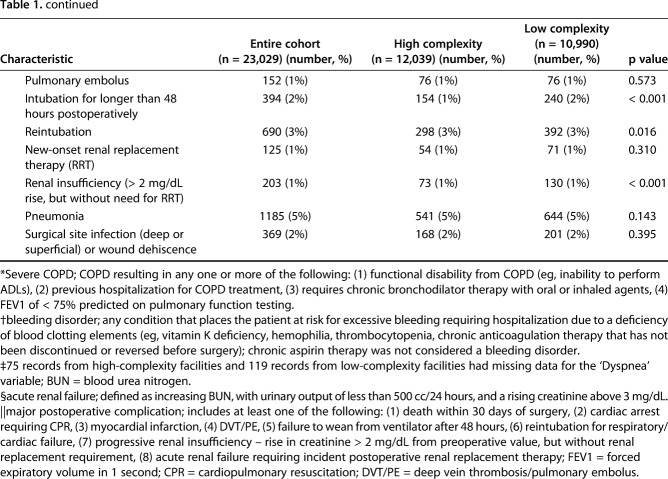
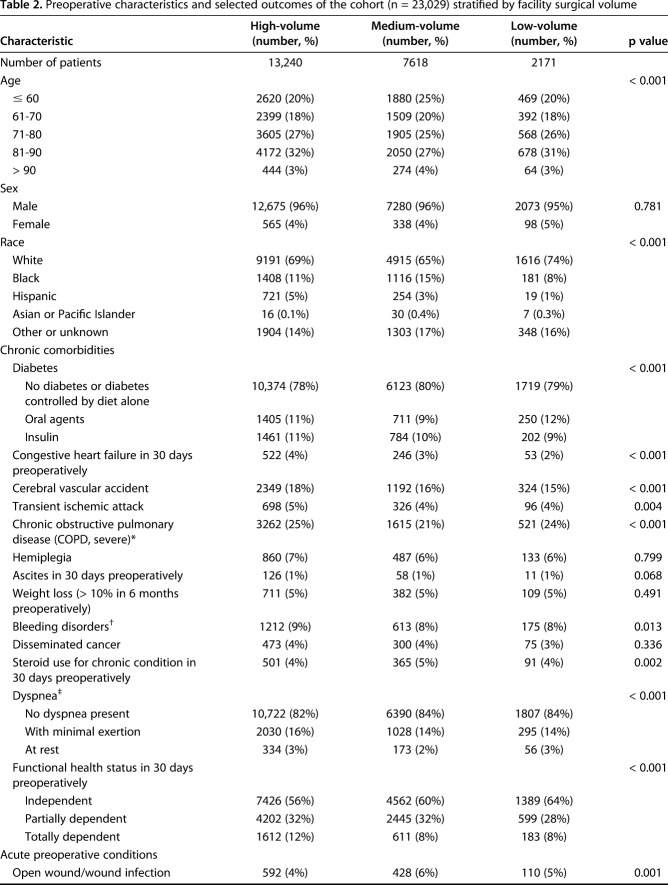
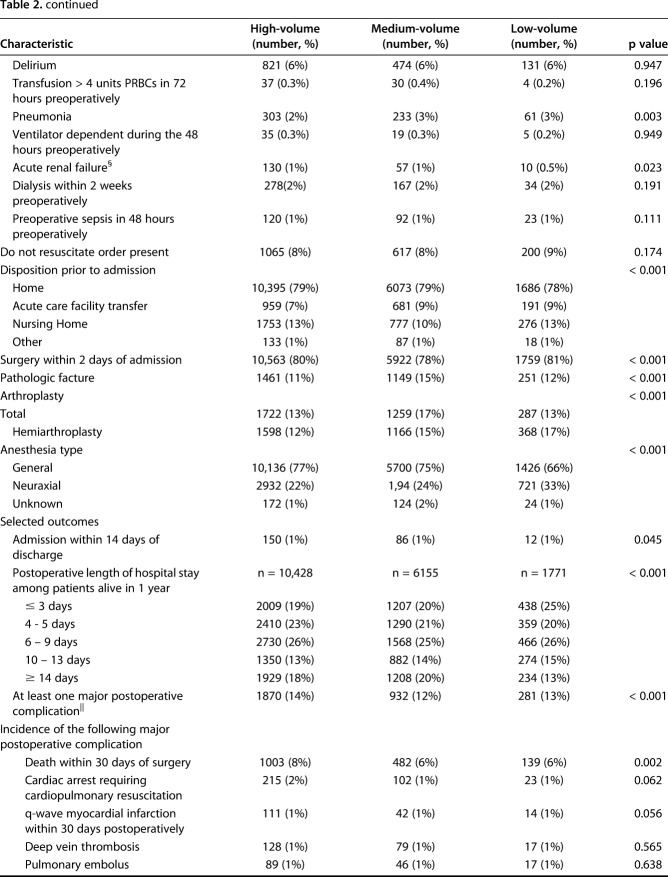
Included in this dataset were orthopaedic trauma and elective THA and partial hip arthroplasties. Patients surgically treated for hip fractures were identified by the following current procedural terminology (CPT) codes: 27220, 27226, 27227, 27228, 27230, 27232, 27235, 27236, 27238, 27240, 27244, 27245, 27246, 27248, 27269, 27254, 27258, and 27269. We also included patients who were treated with a THA (CPT code: 27130) or a partial hip arthroplasty (CPT code: 27125) with concomitant international classification of diseases-9 (ICD-9) code indicating a hip fracture diagnosis: 733.1, 733.15, 733.42, 733.96, or between 820 – 820.91. We observed notable if small differences between patients treated by high-complexity facilities compared with those treated by low-complexity facilities. The age distribution of the cohort treated at low-complexity facilities skewed toward an older population; the population treated by low-complexity facilities had a slightly higher prevalence of severe COPD and a lower prevalence of congestive heart failure exacerbation within a month of surgery. A higher percentage of patients from low-complexity facilities had surgery within 48 hours of hospital admission (Table 1). A larger proportion of patients treated at high-volume centers were completely dependent on others to perform activities of daily living (Table 2).
Table 1.
Preoperative characteristics and selected outcomes of the cohort (n = 23,029) stratified by facility complexity level
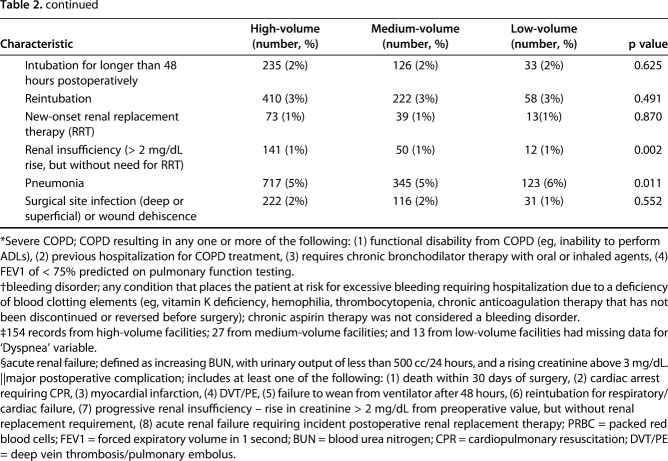
Table 2.
Preoperative characteristics and selected outcomes of the cohort (n = 23,029) stratified by facility surgical volume
Study Subjects (Facility Level; Hospital Characteristics)
To ensure adequate sample size for meaningful statistical analysis within each facility, we excluded nine facilities where surgeons performed fewer than 30 hip fracture procedures during the sampling time frame. Two hospital characteristics were available and of interest: (1) designated facility complexity level; and (2) facility hip fracture surgery volume. Each VHA hospital is assigned to one of five complexity level designations, which are high (Level 1), intermediate (Level 2), and standard (Level 3); high level is subdivided into 1a, 1b, and 1c. The criteria contributing to this classification includes: (1) the availability of subspecialty surgical programs (eg, cardiac surgery, neurosurgery); (2) supportive programs (such as interventional radiology or a polytrauma program); (3) intensive care unit level; (4) breadth of the physician training program; (5) grant funding for research; and (6) an estimate of the health risk of the population served by the VHA facility based on patient diagnosis grouping.
Balancing sample size considerations and assigning a rational demarcation for facility groupings, we labeled complexity Level 1a facilities “high” complexity and all other complexity level designations “low” complexity. In a separate analysis, we stratified facilities into tertiles with respect to surgical volume. Facilities contributing more than 277 records during the sampling time frame were considered high-volume facilities; we labeled facilities where surgeons performed between 204 to 277 procedures medium-volume; and fewer than 204 procedures were labeled low-volume (Table 3).
Table 3.
Facility distribution by complexity level and hip fracture surgical volume
Accounting for All Patients
The VASQIP database provided a list of 47,477 patient records. Exclusion of nonhip fracture orthopaedic trauma, hip arthroplasty for osteoarthritis, records with missing procedures and diagnosis codes, and records from facilities that contributed fewer than 30 hip fracture procedures during the sampling time frame resulted in a final cohort of 23,029 records (Fig. 1).
Fig. 1.
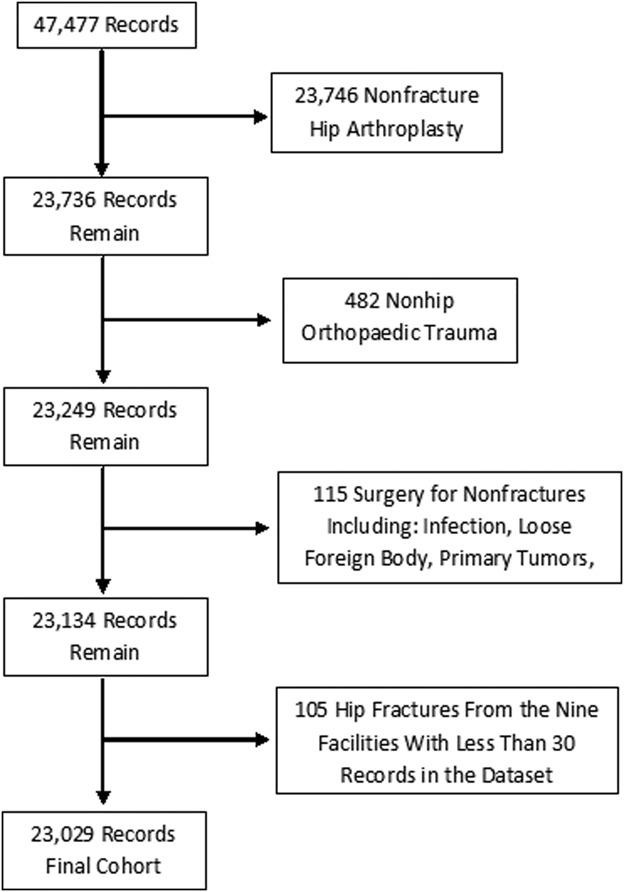
This flow diagram summarizes the number of records that were excluded from the initial cohort of records.
Variable: Major Postoperative Complications
We defined major postoperative complications as having at least one of the following postoperative adverse conditions: (1) death within 30 days of surgery; (2) cardiac arrest requiring cardiopulmonary resuscitation; (3) new q-wave myocardial infarction; (4) deep vein thrombosis/pulmonary embolism; (5) ventilator dependence for at least 48 hours after surgery; (6) reintubation for respiratory or cardiac failure; (7) acute renal failure requiring renal replacement therapy; (8) progressive renal insufficiency with a rise in serum creatinine of at least 2 mg/dL from the preoperative value; (9) pneumonia; or (10) surgical site infection.
Description of Model to Assess Risk of Having a Major Postoperative Complication
We performed bivariate analysis of available preoperative variables. Variables associated with a major postoperative complication at a p value ≤ 0.10 in the bivariate model were retained for testing in the multivariable logistic regression model with backwards elimination (see Appendix, Supplemental Digital Content 1). To test for model discrimination and calibration, we performed 10-fold cross validation. The area under the receiver operating characteristic (ROC) curve (AUC) generated by the predicted probabilities from 10-fold cross validation was used to determine model discrimination. Model calibration was tested with the Hosmer-Lemeshow goodness-of-fit test. To visualize model calibration, we used the predicted probabilities and the observed rate of major postoperative complications to generate a calibration plot (see Appendix, Supplemental Digital Content 2).
Because each facility’s results contribute to the reference population of facilities, a facility’s major postoperative complication rate impacts not only its own observed value but also the expected value. Facilities with extreme results may affect the expected values and lead to misclassification based on the O/E ratio method of facility classification. We performed “leave-one-out” cross validation to assess this possibility. Each facility was “left-out” once while the prediction model was developed using all other facilities; we applied the prediction model to the “left-out” facility to generate predicted probabilities for its records. We compared each facility’s predicted probability derived from the leave-one-out cross validation method to the predicted probability derived from the model that used records from all facilities (see Appendix, Supplemental Digital Content 3).
Observed-to-Expected Ratio Metric
The primary metric of interest was the facility O/E ratio of a major postoperative complication. We used the predictive model to calculate a probability of having a major postoperative complication for each record. The expected number of major postoperative complications for a facility was calculated by adding the predicted probabilities of the records from that facility; if a facility performed 100 procedures with each procedure having a 1% probability of having an event, the facility is expected to have one event. To derive the O/E ratio, the observed number of major postoperative complications at a facility was divided by the expected number of major postoperative complications. We calculated the 95% confidence interval (CI) for the O/E ratio for each facility with the SAS 9.4 PROC STDRATE module (SAS Institute Inc, Cary, NC, USA) with Poisson distribution. We labeled facilities whose 95% CI straddled 1.0 as meeting expectation; those whose 95% CI was entirely < 1.0 were labeled exceeding expectation, while those facilities whose 95% CI was entirely > 1.0 were labeled below expectation. Facilities labeled exceeding expectation or below expectation were also referred to as outliers. We compared the distribution of outlier facilities between complexity levels and between facility surgical volume with the Fisher’s exact test.
To assess the consistency of the observations by the O/E ratio methodology of classifying facility performance, we used multivariable hierarchical logistic regression modeling to assess facility performance and examined the association between facility complexity level and major postoperative complications. In these mixed models, we modeled facility complexity level and surgical volume as random effects.
Sources of Bias
Selection Bias
Because the estimated health risk (“sickness”) of the entire patient population treated at a VHA facility is a criterion to determine complexity level, high-level facilities may have treated hip fracture surgery patients with more severe comorbidities. The risk assessment model to calculate a predicted probability of having a major postoperative complication attempts to account for patient factors associated with having a major postoperative event; however, because no model is perfect, there are certainly unknown and unaccounted for predictors.
Assessment Bias
Risk-adjusted facility metrics calculated from the VASQIP database are used for internal reporting and assessment purposes. Upgrading the patient risk profile improves facility performance metrics. The risk of this bias influencing the observations is mitigated by evidence of reliability of VASQIP data, including collections of preoperative comorbidities [6].
Additional Statistical Analysis Details
Descriptive statistics were expressed as frequency and percentage of the entire cohort. All comparisons were two-tailed, and p < 0.05 was considered statistically significant. We used SAS 9.4 software for all statistical analyses.
Results
VHA facilities with the highest complexity level designation did not have a higher proportion of facilities performing better than expected compared with lower complexity level designation facilities. The association between complexity Level 1a designation and major postoperative complications was null (OR, 0.85; 95% CI, 0.67–1.09; p = 0.108; Table 4).
Table 4.
Distribution of facility performance for major postoperative complication among facility complexity level designation
VHA facilities with the highest hip fracture surgical volume did not have higher proportions of facilities performing better than expected compared with medium- and low-volume facilities. The association between surgical volume and major postoperative complications was null (low-volume versus high-volume: OR, 0.87; 95% CI, 0.73–1.05; medium-volume versus high-volume: OR, 0.89; 95% CI, 0.79– 1.02; p = 0.155; Table 5).
Table 5.
Distribution of facility performance for major postoperative complication among facility hip fracture surgical volume
Other Relevant Findings
To validate the use of O/E ratio methodology, we applied multivariable hierarchical logistic regression modeling to classify facility performance. This method reclassified seven facilities from outlier to average performer, but no facilities classified as average by O/E ratio methodology were reclassified as an outlier.
Discussion
Identifying facility factors associated with either excessive or low mortality and morbidity rates after hip fracture surgery is a priority of healthcare providers, hospital administrators, and policy makers as such information may reflect overall healthcare quality, focus efforts for improvement, and determine resource allocation. Unlike elective joint arthroplasty, hospital and surgeon volume for hip fracture surgery has not been consistently shown to be associated with mortality [5, 7-10, 21, 24, 27, 30]. The VHA is a single-payer system with facilities that vary in size, number of patients served, and services provided; these are among the factors that determine resource allocation within the VHA, which is closely tied to the VHA facility complexity level designation. We investigated the specific factors of complexity level designation and hip fracture surgical volume and their association, if any, with hip fracture surgery morbidity and mortality. Whether stratified by facility complexity level or hip fracture surgical volume, we observed no differences in the distribution of outlier facilities based on postoperative complications among VHA surgical facilities treating hip fractures. The observations do not support the thinking that, as a group, VHA facilities with the highest complexity level designation (1a) or greater hip fracture surgery volume have fewer major postoperative complications after hip fracture surgery. Taken together with many reports that have failed to demonstrate a consistent association between hip fracture surgical volume and mortality [5, 7, 21, 27], we cannot argue against facilities treating these patients based on historical surgical volume or facility resource availability.
Limitations
VHA Patient Population
The VHA patient population is relatively homogenous compared with nonVHA facilities. Two characteristics illustrate major differences between the population we studied and the populations in reports using nonVHA data [5, 7-10, 21, 24, 27, 30]. The VHA population in this report was predominately male, and more than 20% of the population was younger than 60 years of age. This may limit our finding’s external validity. Differences in preoperative comorbid conditions between VHA patients and the general population may also compromise external validity. Nearly a quarter of the VHA population had a diagnosis of severe COPD; sepsis within 2 days before surgery was documented in 1% of the VHA population; and 0.3% of patients were transfused with more than 4 units of packed red blood cells 3 days before surgery.
Veterans within VHA may have private insurance policies, permitting them to receive most of their care outside of the VHA system. Veterans, for example, may have all their primary care at a nonVHA facility but choose to have surgery at a VHA facility because of cost, convenience, or as a result of a specific referral. We cannot dismiss the possibility that the population of veterans with private insurance who only get certain treatments at a VHA facility are demographically different from those who get all their care from a VHA facility.
O/E Ratio Metric
The O/E ratio metric has been used to assess hospital, surgeon, and surgical program performance [11, 12, 31]. Awareness of its limitations guides results interpretation. As with any observation, the variance in hospital performance contains a random component; this random component will contribute more to the variance with smaller sample sizes and event rates [1]. Thus, misclassification of facility performance is more likely for low-volume facilities. Rather than using a single sample, judging hospital performance with longitudinal sampling, especially for low-volume facilities, may be more prudent [4]. The O/E ratio is used to identify performance outlier status, but it does not identify mechanisms responsible for outlier status.
The underlying indirect standardization used to calculate the expected number of events for the O/E ratio corresponds to the following question: “what would happen to a facility’s patients if they were treated at an ‘average’ facility?” In some clinical scenarios (eg, transferring a patient from one facility to another), it is critical to distinguish indirect standardization metrics from direct standardization metrics. Among many possible reasons to transfer a patient is the belief that the odds of a better outcome for the patient are higher if the patient is treated at the receiving facility. Direct comparison of facilities uses direct standardization methods with the underlying question being: “What would happen to the entire population of patients if it were treated at a given facility?” The O/E ratio methodology does not directly compare facilities; rather than interpreting that two “average” performing facilities are equal, a more appropriate interpretation may be that both facilities treat a patient population commensurate with their capabilities.
Dataset Limitations
We included a postoperative rise in creatinine, which may be self-limited as a major postoperative complication because of evidence that even mild postoperative acute kidney injury after orthopaedic surgery is associated with short and long-term mortality [2]. A substantial limitation of the dataset was the lack of a field for postoperative cerebral vascular accident.
Dichotomizing Facility Complexity Level
We categorized facilities as high volume or low volume, and high complexity or low complexity. Facilities within each classification are assuredly not homogenous in facility structure and processes. For sample size considerations and to specifically investigate any advantages of facilities achieving the highest complexity level, we labeled all noncomplexity Level 1a facilities as low complexity. Thus, the low-complexity group included complexity Levels 1b and 1c (both considered high-complexity by the VHA but not as high as 1a), complexity Level 2 (intermediate complexity by the VHA), and complexity Level 3 (standard complexity by the VHA) facilities. From the VHA designation perspective, the interpretation of our observations is that complexity Level 1a facilities do not have a different proportion of outlier facilities than noncomplexity Level 1a facilities. This dataset lacks details on facility characteristics or system factors that may affect postoperative complications and mortality more than surgical volume or complexity level, such as the presence or absence of specific models of care (like a perioperative surgical home or enhanced-recovery pathways).
Association Between Facility Complexity Level and Complications
VHA facilities with the highest complexity level designation do not have a disproportionate number of better-than-expected performance outliers for major postoperative complications compared with lower complexity level facilities. The complexity level designation for VHA facilities is unique. With respect to resource availability, comparing teaching or tertiary care centers with community hospitals may be the best approximation. While Koval et al. [19] did not report a difference in mortality or postoperative complication rates between teaching and nonteaching hospitals treating hip fractures when they explored the National Inpatient Sample database, most studies reported lower mortality with enhanced cost-effectiveness among teaching institutions [18, 26, 32, 34]. To interpret these discrepancies, it is important to note that because high-complexity facilities within the VHA and teaching facilities are likely to have more resource availability than low-complexity and nonteaching facilities, a direct comparison between high-complexity level within VHA and teaching facilities within the community may not be valid.
Association Between Facility Volume and Complications
VHA facilities with higher hip fracture surgical volume do not have a disproportionate number of better-than-expected performance outliers for major postoperative complications compared with lower-volume facilities. Although there are variations in the findings of an association between surgical volume and morbidity and mortality after elective joint replacement [17, 20, 28, 33], the preponderance of evidence suggesting an association between surgical volume and mortality [14, 15, 35], functional metrics [16, 17], revisions [13, 20, 23], and postoperative complications [35] has led to the belief that patients treated at higher-volume institutions have lower morbidity and mortality after elective joint arthroplasty. For hip fracture surgery, the association between surgical volume and mortality is not as well established. Several reports suggest an association between higher volume centers and lower mortality [8, 24]. Many have reported no association [5, 7, 10, 27, 30]. Some observed a higher postsurgical mortality rate in higher volume facilities [9, 21]. Wide variations in surgical volume classification challenge the appropriateness of direct comparisons between studies. When compared with nonVHA facilities included in other reports, almost every VHA facility would be classified as low volume; relative surgical volume homogeneity among VHA facilities may partially explain the observed null result.
Conclusions
Our observations suggest that within VHA facilities that perform hip fracture surgery, performance outlier status is not associated with complexity level designation or hip fracture surgical volume. This may imply that most VHA facilities care for a patient risk profile commensurate with their facility capabilities. However, we caution extrapolating observations derived from VHA data to the general population because as a single-payer system serving a specific patient population, the VHA likely serves a patient population that is more homogenous than that found outside of the VHA. As no model predicting adverse events is perfect, the homogeneity may provide a measure of control for both observed and unobserved patient factors that may confound the association between facility groupings and performance; it may also limit the external validity of observations from VHA data. Future studies should aim to identify consistent performance outliers because this information may help identify processes and characteristics that determine outlier status.
Acknowledgments
We thank Kristin Sainani PhD, associate professor (Health Research and Policy), for her contributions to the statistical analyses for this report.
Footnotes
One of the authors (NJG) certifies that he is the chair of the Orthopaedic Surgical Advisory Board for the Department of Veterans Affairs. Each author certifies that neither he or she, nor any member of his or her immediate family, have funding or commercial associations (consultancies, stock ownership, equity interest, patent/licensing arrangements, etc) that might pose a conflict of interest in connection with the submitted article.
All ICMJE Conflict of Interest Forms for authors and Clinical Orthopaedics and Related Research® editors and board members are on file with the publication and can be viewed on request.
Clinical Orthopaedics and Related Research® neither advocates nor endorses the use of any treatment, drug, or device. Readers are encouraged to always seek additional information, including FDA approval status, of any drug or device before clinical use.
Each author certifies that his or her institution approved the human protocol for this investigation and that all investigations were conducted in conformity with ethical principles of research.
This work was performed at Palo Alto Veterans Affairs Health Care Systems, Palo Alto, CA, USA.
References
- 1.Austin PC, Reeves MJ. Effect of provider volume on the accuracy of hospital report cards. A Monte Carlo study. Circ Cardiovasc Qual Outcomes. 2014;7:299–305. [DOI] [PubMed] [Google Scholar]
- 2.Bell S, Dekker FW, Vadiveloo T, Marwick C, Desmukh H, Donnan PT, Van Diepan M. Risk of postoperative acute kidney injury in patients undergoing orthopaedic surgery—development and validation of a risk score and effect of acute kidney injury on survival: observations cohort study. BMJ. 2016;351:h5639. [DOI] [PMC free article] [PubMed] [Google Scholar]
- 3.Braithwaite RS, Col NF, Wong JB. Estimating hip fracture morbidity, mortality, and costs. J Am Geriatr Soc. 2003;51:364–370. [DOI] [PubMed] [Google Scholar]
- 4.Bronskill SE, Normand SL, Landrum MB, Rosenheck RA. Longitudinal profiles of health care providers. Stat Med. 2002;21:1067–1088. [DOI] [PubMed] [Google Scholar]
- 5.Browne JA, Pietrobon R, Olson SA. Hip fracture outcomes: does surgeon or hospital volume really matter? J Trauma. 2009;66:809–814. [DOI] [PubMed] [Google Scholar]
- 6.Davis CL, Pierce JR, Henderson W, Spencer CD, Tyler C, Langberg R, Swafford J, Felan GS, Kearns MA, Booker B. Assessment of the reliability of data collected for the Department of Veterans Affairs National Surgical Quality Improvement Program. J Am Coll Surg. 2007;204:550–560.. [DOI] [PubMed] [Google Scholar]
- 7.Elkassabany NM, Passarella M, Mehta S, Liu J, Neuman MD. Hospital characteristics, inpatient processes of care, and readmissions of older adults with hip fractures. J Am Geriatr Soc. 2016;64:1656–1661. [DOI] [PMC free article] [PubMed] [Google Scholar]
- 8.Forte ML, Virnig BA, Swiontkowski MF, Bhandari M, Feldman R, Eberly LE, Kane RL. Ninety-day mortality after intertrochanteric hip fracture: does provider volume matter? J Bone Joint Surg Am. 2010;92:799–806. [DOI] [PubMed] [Google Scholar]
- 9.Franzo A, Francescutti C, Simon G. Risk factors correlated with post-operative mortality for hip fracture surgery in the elderly: a population-based approach. Eur J Epidemiol. 2005;20:985–991. [DOI] [PubMed] [Google Scholar]
- 10.Hamilton BH, Hamilton VH. Estimating surgical volume—outcome relationships applying survival models: accounting for frailty and hospital fixed effects. Health Econ. 1997;6:383–395. [DOI] [PubMed] [Google Scholar]
- 11.Ingraham AM, Cohen ME, Bilimoria KY, Feinglass JM, Richards KE, Hall BL, Ko CY. Comparison of hospital performance in nonemergency versus emergency colorectal operations at 142 hospitals. J Am Coll Surg. 2010;210:155–165. [DOI] [PubMed] [Google Scholar]
- 12.Jacobs JP, O’Brien SM, Pasquali SK, Gaynor JW, Mayer JE, Karamlou T, Welke KF, Filardo G, Han JM, Kim S, Quintessenza JA, Pizarro C, Tchervenkov CI, Lacour-Gayet F, Mavroudis C, Backer CL, Austin ER, Fraser CD, Tweddell JS, Jonas RA, Edwards FH, Grover FL, Prager RL, Shahian DM, Jacobs ML. The Society of Thoracic Surgeons congenital heart surgery database mortality risk model: Part 2—clinical application. Ann Thorac Surg. 2015;100:1063–1070. [DOI] [PMC free article] [PubMed] [Google Scholar]
- 13.Jeschke E, Citak M, Gunster C, Matthias HA, Heller KD, Malzahn J, Niethard FU, Schrader P, Zacher J, Gebrke T. Are TKAs performed in high-volume hospitals less likely to undergo revision than TKAs performed in low-volume hospitals. Clin Orthop Relat Res. 2017;475:2669–2674. [DOI] [PMC free article] [PubMed] [Google Scholar]
- 14.Katz JN, Barrett J, Mahomed NN, Baron JA, Wright RJ, Losina E. Association between hospital and surgeon volume and the outcomes of total knee replacement. J Bone Joint Surg Am. 2004;86:1909–1916. [DOI] [PubMed] [Google Scholar]
- 15.Katz JN, Losina E, Barrett J, Phillips CB, Mahomed NN, Lew RA, Guadagnoli E, Harris WH, Poss R, Baron JA. Association between hospital and surgeon procedure volume and outcomes of total hip replacement in the United States Medicare population. J Bone Joint Surg Am. 2001;83:1622–1629. [DOI] [PubMed] [Google Scholar]
- 16.Katz JN, Mahomed NN, Baron JA, Barrett JA, Fossel AH, Creel AH, Wright J, Wright EA, Losina E. Association of hospital and surgeon procedure volume with patient-centered outcomes of total knee replacement in a population-based cohort of patients age 65 years and older. Arthritis Rheum. 2007;56:568–574. [DOI] [PubMed] [Google Scholar]
- 17.Katz JN, Phillips CB, Baron JA, Fossel AH, Mahomed NN, Barrett J, Lingard EA, Harris WH, Poss R, Lew RA, Guadagnoli E, Wright EA, Losina E. Association of hospital and surgeon volume of total hip replacement with functional status and satisfaction three years following surgery. Arthritis Rheum. 2003;48:560–568. [DOI] [PubMed] [Google Scholar]
- 18.Konda SR, Lott A, Manoli A, Patel K, Egol KA. Hip fracture treatment at orthopedic teaching hospitals: better care at a lower cost. J Orthop Trauma. 2017;31:e364–e368. [DOI] [PubMed] [Google Scholar]
- 19.Koval KJ, Rust CL, Spratt KF. The effect of hospital setting and teaching status on outcomes after hip fracture. Am J Orthop (Belle Meade NJ). 2011;40:19–28. [PubMed] [Google Scholar]
- 20.Kreder HJ, Grosso P, Williams JI, Jaglal S, Axcell T, Wal EK, Stephen DJ. Provider volume and other predictors of outcome after total knee arthroplasty: a population study in Ontario. Can J Surg. 2003;4691:15–22. [PMC free article] [PubMed] [Google Scholar]
- 21.Kristensen PK, Thillemann TM, Johnsen SP. Is bigger always better? A nationwide study of hip fracture unit volume, 30-day mortality, quality of in-hospital care, and length of hospital stay. Med Care 2104;52:1023–1029. [DOI] [PubMed] [Google Scholar]
- 22.Liu Y, Wang Z, Xiao W. Risk factors for mortality in elderly patients with hip fractures: a meta-analysis of 18 studies. Aging Clin Exp Res. 2018;30:323–330. [DOI] [PubMed] [Google Scholar]
- 23.Losina E, Barrett J, Mahomed NN, Baron JA, Katz JN. Early failures of total hip replacement: effect of surgeon volume. Arthritis Rheum. 2004;50:1338–1343. [DOI] [PubMed] [Google Scholar]
- 24.Maceroli M, Nikkel LE, Mahmood B, Ketz JP, Qiu X, Ciminelli J, Messing S, Elfar JC. Total hip arthroplasty for femoral neck fractures: improved outcomes with higher hospital volumes. J Orthop Trauma. 2016;30:597–604. [DOI] [PMC free article] [PubMed] [Google Scholar]
- 25.Mahmoudi E., Squitieri L, Maroukis BL, Chung KC, Waljee JF. Care transfer for patients with upper extremity trauma: influence of health insurance type. J Hand Surg Am. 2016;41:516–525. [DOI] [PubMed] [Google Scholar]
- 26.McGuire KJ, Chacko AT, Bernstein J. Cost-effectiveness of teaching hospitals for the operative management of hip fractures. Orthopedics. 2011;34:e598–e601. [DOI] [PubMed] [Google Scholar]
- 27.Okike K, Chan PH, Paxton EW. Effect of surgeon and hospital volume on morbidity and mortality after hip fracture. J Bone Joint Surg Am. 2017;99:1547–53. [DOI] [PubMed] [Google Scholar]
- 28.Peterson JM, Williams JI, Kreder HJ, Mahomed NN, Gunraj N, Wang X, Laupacis A. Provider volumes and early outcomes of primary total joint replacement in Ontario. Can J Surg. 2010;53:175–183. [PMC free article] [PubMed] [Google Scholar]
- 29.Pugely AJ, Martin CT, Gao Y, Klocke NF, Callaghan JJ, Marsh JL. A risk calculator for short-term morbidity and mortality after hip fracture surgery. J Orthop Trauma. 2104;28:63–69. [DOI] [PubMed] [Google Scholar]
- 30.Shah SN, Wainess RM, Karunakar MA. Hemiarthroplasty for femoral neck fractures in the elderly. J Arthroplasty. 2005;20:503–508. [DOI] [PubMed] [Google Scholar]
- 31.Shahian DM, Normand ST. Comparison of “risk-adjusted” hospital outcomes. Circulation. 2008;117:1955–1963. [DOI] [PubMed] [Google Scholar]
- 32.Sheehan KJ, Sobolev B, Guy P, Kuramoto L, Morin SN, Sutherland JM, Beaupre L, Griesdale D, Dunbar M, Bohm E, Harvey E. In-hospital mortality after hip fracture by treatment setting. CMAJ. 2016;188:1219–1225. [DOI] [PMC free article] [PubMed] [Google Scholar]
- 33.Solomon DH, Losina E, Baron JA, Fossel AH, Guadagnoli E, Lingard EA, Miner A, Phillips CB, Katz JN. Contribution of hospital characteristics to the volume-outcome relationship: dislocation and infection following total hip replacement surgery. Arthritis Rheum. 2002;46:2436–2344. [DOI] [PubMed] [Google Scholar]
- 34.Taylor DH, Jr, Whellan DJ, Sloan FA. Effects of admission to a teaching hospital on the cost and quality of care for Medicare beneficiaries. N Engl J Med. 1999;340:293–299. [DOI] [PubMed] [Google Scholar]
- 35.Wilson S, Marx RG, Pan TJ, Lyman S. Meaningful thresholds for the volume-outcome relationship in total knee arthroplasty. J Bone Joint Surg Am. 2016;98:1683–1690. [DOI] [PubMed] [Google Scholar]


