Abstract
Background
Many two-dimensional (2-D) radiographic views are used to help diagnose cam femoroacetabular impingement (FAI), but there is little consensus as to which view or combination of views is most effective at visualizing the magnitude and extent of the cam lesion (ie, severity). Previous studies have used a single image from a sequence of CT or MR images to serve as a reference standard with which to evaluate the ability of 2-D radiographic views and associated measurements to describe the severity of the cam lesion. However, single images from CT or MRI data may fail to capture the apex of the cam lesion. Thus, it may be more appropriate to use measurements of three-dimensional (3-D) surface reconstructions from CT or MRI data to serve as an anatomic reference standard when evaluating radiographic views and associated measurements used in the diagnosis of cam FAI.
Questions/purposes
The purpose of this study was to use digitally reconstructed radiographs and 3-D statistical shape modeling to (1) determine the correlation between 2-D radiographic measurements of cam FAI and 3-D metrics of proximal femoral shape; and 2) identify the combination of radiographic measurements from plain film projections that were most effective at predicting the 3-D shape of the proximal femur.
Methods
This study leveraged previously acquired CT images of the femur from a convenience sample of 37 patients (34 males; mean age, 27 years, range, 16-47 years; mean body mass index [BMI], 24.6 kg/m2, range, 19.0-30.2 kg/m2) diagnosed with cam FAI imaged between February 2005 and January 2016. Patients were diagnosed with cam FAI based on a culmination of clinical examinations, history of hip pain, and imaging findings. The control group consisted of 59 morphologically normal control participants (36 males; mean age, 29 years, range, 15-55 years; mean BMI, 24.4 kg/m2, range, 16.3-38.6 kg/m2) imaged between April 2008 and September 2014. Of these controls, 30 were cadaveric femurs and 29 were living participants. All controls were screened for evidence of femoral deformities using radiographs. In addition, living control participants had no history of hip pain or previous surgery to the hip or lower limbs. CT images were acquired for each participant and the surface of the proximal femur was segmented and reconstructed. Surfaces were input to our statistical shape modeling pipeline, which objectively calculated 3-D shape scores that described the overall shape of the entire proximal femur and of the region of the femur where the cam lesion is typically located. Digital reconstructions for eight plain film views (AP, Meyer lateral, 45° Dunn, modified 45° Dunn, frog-leg lateral, Espié frog-leg, 90° Dunn, and cross-table lateral) were generated from CT data. For each view, measurements of the α angle and head-neck offset were obtained by two researchers (intraobserver correlation coefficients of 0.80-0.94 for the α angle and 0.42-0.80 for the head-neck offset measurements). The relationships between radiographic measurements from each view and the 3-D shape scores (for the entire proximal femur and for the region specific to the cam lesion) were assessed with linear correlation. Additionally, partial least squares regression was used to determine which combination of views and measurements was the most effective at predicting 3-D shape scores.
Results
Three-dimensional shape scores were most strongly correlated with α angle on the cross-table view when considering the entire proximal femur (r = -0.568; p < 0.001) and on the Meyer lateral view when considering the region of the cam lesion (r = -0.669; p < 0.001). Partial least squares regression demonstrated that measurements from the Meyer lateral and 90° Dunn radiographs produced the optimized regression model for predicting shape scores for the proximal femur (R2 = 0.405, root mean squared error of prediction [RMSEP] = 1.549) and the region of the cam lesion (R2 = 0.525, RMSEP = 1.150). Interestingly, views with larger differences in the α angle and head-neck offset between control and cam FAI groups did not have the strongest correlations with 3-D shape.
Conclusions
Considered together, radiographic measurements from the Meyer lateral and 90° Dunn views provided the most effective predictions of 3-D shape of the proximal femur and the region of the cam lesion as determined using shape modeling metrics.
Clinical Relevance
Our results suggest that clinicians should consider using the Meyer lateral and 90° Dunn views to evaluate patients in whom cam FAI is suspected. However, the α angle and head-neck offset measurements from these and other plain film views could describe no more than half of the overall variation in the shape of the proximal femur and cam lesion. Thus, caution should be exercised when evaluating femoral head anatomy using the α angle and head-neck offset measurements from plain film radiographs. Given these findings, we believe there is merit in pursuing research that aims to develop the framework necessary to integrate statistical shape modeling into clinical evaluation, because this could aid in the diagnosis of cam FAI.
Introduction
It has been credibly argued that most cases of adult idiopathic primary osteoarthritis (OA) are in fact secondary to longstanding hip pathoanatomy, including acetabular dysplasia and femoroacetabular impingement (FAI) [20]. By some estimates, 80% of patients with end-stage hip OA have evidence of cam-type FAI [5, 20]. Morphologically, cam FAI presents as femoral head asphericity with reduced head-neck offset. The region of asphericity is often referred to as the cam lesion and is generally located in the anterosuperior and anterolateral regions of the proximal femur. Surgical treatment of cam FAI aims to resect the lesion to alleviate pain and improve function. As such, an accurate assessment of the magnitude and location of the cam lesion (ie, severity) is important for preoperative planning [21, 37, 38].
Numerous two-dimensional (2-D) plain film views have been described for this purpose, but there is no consensus as to which views are best for evaluating the cam lesion [9, 11, 25, 31]. Previous research has attempted to identify which plain film views best describe the three-dimensional (3-D) anatomy of hips with and without cam FAI. Specifically, 2-D plain film α angle measurements have been compared with those from a reference standard of either CT or MRI [6, 11, 12, 25, 28, 32, 37]. In these studies, the plain film views for which α angle measurements were most strongly correlated with α angles obtained directly on the CT or MR images were considered to be the best for capturing the morphology of cam FAI. However, a possible limitation of these prior studies is that CT or MRI measurements that served as the reference standard were obtained from a single planar image based on either standard format (axial, coronal, or sagittal) or radially reformatted planes [6, 11, 12, 25, 28, 32, 37]. Single CT or MR images may not be aligned such that they visualize the apex of the lesion, which suggests that they may not serve as a good reference standard in which to evaluate plain film views and associated measurements used in the diagnosis of cam FAI.
Volumetric CT and MRI data can be reconstructed into 3-D surface models of the hip with subvoxel reconstruction errors [40], but in practice, it is difficult to extract quantitative measurements that can be interpreted in a statistically and clinically meaningful fashion and thus most reconstructions are only qualitatively analyzed in a clinical setting. Statistical shape modeling (SSM) is a technique that provides methods to objectively quantify 3-D anatomic shape using reconstructions from CT or MR images. SSM allows for the generation of shapes representing the mean shape for individual groups, which can be aligned to quantify the location and magnitude of tissue deformity, as we have done when applying SSM to study cam FAI [2, 3]. The SSM pipeline also incorporates statistical testing to determine whether there are significant differences in shape between groups [2, 3].
As part of a recent SSM study investigating the variation in cortical bone thickness among hips with cam FAI, we developed a technique to objectively quantify and visualize the shape of each participant’s femur by calculating a “shape score” based on a linear discriminant analysis [3]. This shape score represents each shape by a single number, making comparisons across participants and groups intuitive (see, for example, Figure 3 in Atkins et al. [3]). Regressions between measurements of the α angle and head-neck offset from plain film views and shape scores calculated by SSM would provide the means to identify which radiographic views and associated measurements best describe the 3-D shape of the femur.
Fig. 3.
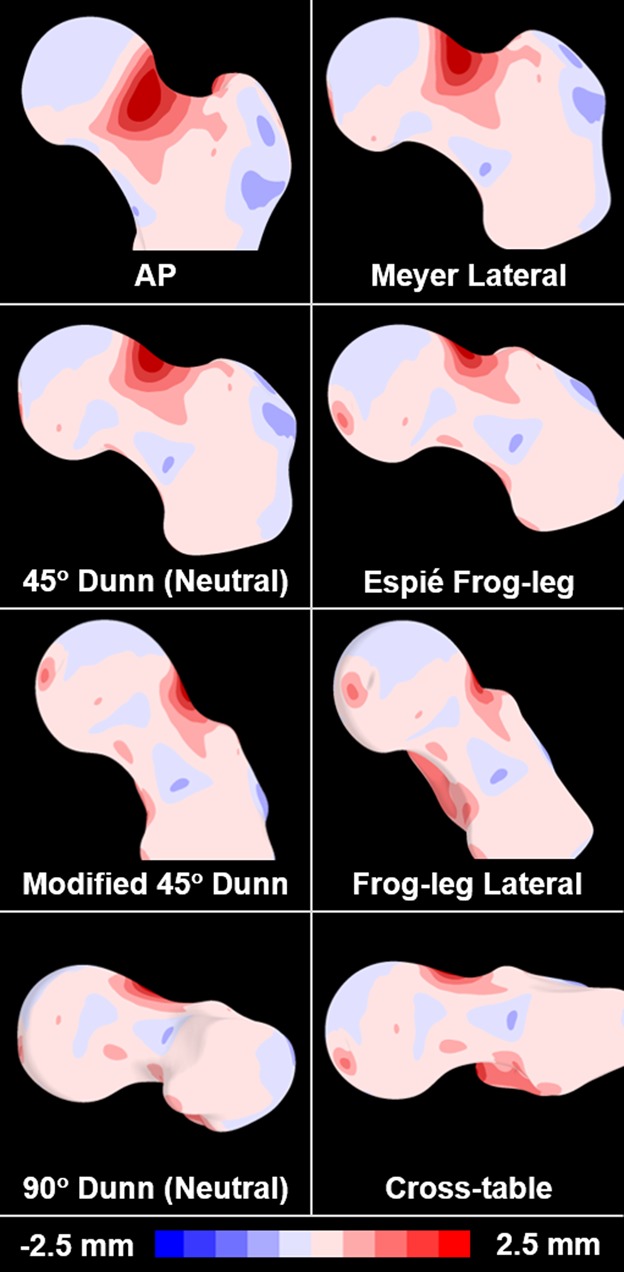
The mean cam femur from SSM was aligned to the orientation of the eight digitally reconstructed radiographs to visualize the location and magnitude of the cam lesion relative to the imaging plane. The color map represents the spatial distance between the mean cam and mean control surface reconstructions.
The purpose of this study was to use digitally reconstructed radiographs and SSM to (1) determine the correlation between 2-D radiographic measurements of cam FAI and 3-D metrics of proximal femoral shape; and (2) identify the combination of radiographic measurements from plain film projections that were most effective at predicting the 3-D shape of the proximal femur.
Patients and Methods
We leveraged previously imaged participants for the current study. The control group was composed of images obtained from 29 study volunteer participants and 30 cadaveric femur specimens (36 males; mean age, 29 years, range, 15-55 years; mean body mass index [BMI], 24.4 kg/m2, range, 16.3-38.6 kg/m2). Study participants had been imaged as part of previous unrelated studies with institutional review board (IRB) approval (University of Utah IRB numbers 11755 and 56086; Intermountain Healthcare IRB number 1024270) [2, 3, 17, 27]. Fourteen of 43 participants and 29 of 59 cadaveric femora were excluded for having anatomy of FAI or acetabular dysplasia as evaluated using an AP radiograph for the participants or a reconstructed radiograph in the frog-leg position for cadaveric specimens, leaving a total of 59 participants in the control group. The 30 cadaveric specimens included here were imaged for basic science research between May and June 2008 and 15 of the remaining 29 living control participants had been recruited from April 2008 to July 2010. Combined, these 45 femurs have represented the control population in our previous SSM studies of the femur [2, 3, 24]. An additional 14 living control volunteers were recruited from March 2013 to September 2014 as part of unrelated studies for which CT scans were acquired as part of a dual fluoroscopy protocol to measure in vivo hip motion during clinical examinations and weightbearing activities [17, 27].
Thirty-seven nonconsecutive patients with cam FAI (34 males; mean age, 27 years, range, 16-47 years; mean BMI, 24.6 kg/m2, range, 19.0-30.2 kg/m2) were recruited for convenience based on radiographic findings of cam FAI (ie, α angle measurements from AP and frog-leg lateral plain films), presence of pain, and positive clinical examinations, as assessed by one of two orthopaedic surgeons (CLP, SKA), each with more than 10 years of experience treating FAI. Twenty-seven of these patients were recruited from February 2005 to January 2009 (n = 14) and January 2011 to January 2012 (n = 13) and had been included in previous SSM studies of cam FAI [2, 3, 24]. The remaining 10 patients were recruited between February 2013 and January 2016 as part of an unrelated and ongoing study for which CT scans were acquired as part of a dual fluoroscopy protocol to measure in vivo hip motion during clinical examinations and weightbearing activities [27]. As a result of the nature of these ongoing and previous studies, which often included nonclinical motion capture imaging, the recruitment of patients represents a convenience sample from thousands of patients seen during this time period.
Using a previously described protocol [26], we acquired CT images of the proximal femur of all volunteer participants or patients with a SOMATOM Definition1 128 CT scanner (Siemens AG, Munich, Germany; 29 control participants, 24 patients with cam FAI) or LightSpeed1 VCT1 scanner (GE Healthcare, Chicago, IL, USA; 13 patients with cam FAI). Study volunteers were imaged supine using hare traction with toe tips taped or in a frog-leg position. Cadaveric femurs had been dissected of soft tissue and imaged in an anatomic orientation with a HiSpeed1 CTi Single Slice Helical CT scanner (GE Healthcare). Images were acquired at 100 to 120 kVp, 512 x 512 acquisition matrix, 0.625- to 1.0-mm slice thickness, 0.9 to 1.0 pitch, and 100 to 200 mAs with variable fields of view yielding in-plane resolutions of approximately 0.7 x 0.7 mm.
We generated 3-D reconstructions of the femur by segmenting CT image data (Amira, Version 5.6; FEI, Hillsboro, OR, USA) using our previously published protocol [26]. Of note, before segmentation, hip CT images were resampled to three times the native slice thickness and resolution, which reduced staircase artifact on the reconstructed surfaces [23]. Femur surface reconstructions were decimated and smoothed to remove segmentation artifacts. It has been shown that this protocol produces 3-D surfaces of bone with subvoxel (ie, submillimeter) reconstruction errors [1]. Because cam lesions are larger than the size of a single voxel [3, 24], we considered the application of CT to define the anatomy of the femur appropriate for achieving the objectives of our study.
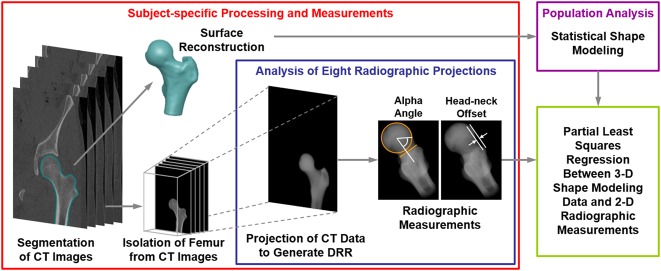
Reconstructed radiographs were generated using a previously validated protocol [25] by projecting the CT image data of the femur (Fig. 1) to create eight plain film views described in other studies [9, 10, 13-15, 31, 39]. Specifically, the views represented here were the AP [39], the Meyer lateral, as proposed by Meyer et al. [31], the 45° Dunn [13], the modified 45° Dunn [9], the frog-leg lateral [10], the Espié frog-leg [15], the 90° Dunn [13], and the cross-table lateral [14] (Fig. 2). Before application of a series of rotation angles (Table 1) to generate consistent femur positioning for each radiograph, femurs were aligned to remove errors associated with nonanatomic positioning during the imaging protocol. Rotations were applied about the center of the femoral head in the local coordinate system of the femur to align best with clinical descriptions of the different positions. Although the use of reconstructed radiographs ignores the interindividual variability in positioning that is inherent to clinical imaging, it provides a method to eliminate these differences and directly analyze the relationship between anatomic shape features and radiographic measurements [25]. From each radiographic view, measurements of α angle and head-neck offset (Fig. 1) [14, 35] were obtained by two orthopaedic researchers (PRA, YS) with experience with medical imaging using a custom code written in Matlab (Version 7.10; Natick, MA, USA) [25]. Researchers were blinded as to whether the images were from the control group or the FAI group.
Fig. 1.
Flowchart shows the methodological pipeline that included SSM and analysis of radiographic measurements used to diagnose cam FAI. Both cam FAI and control group participants were considered. For each individual analyzed, CT images were segmented to isolate the proximal femur. Reconstructed surfaces were input to SSM. Digitally reconstructed radiographs were then generated to represent eight plain film views commonly obtained in patients with suspected cam FAI. The reconstructed radiographs were generated by projecting the CT image stack, including only the pixel intensities within the proximal femur, at fixed rotation angles (Table 1). Alpha angle and head-neck offset measurements were obtained on each digitally reconstructed radiograph. Partial least squares regression was performed between the radiographic measurements and shape score to determine which radiographic view(s) and associated α angle and head-neck offset measurements best described the 3-D shape score calculated by SSM. DRR = digitally reconstructed radiograph.
Fig. 2.
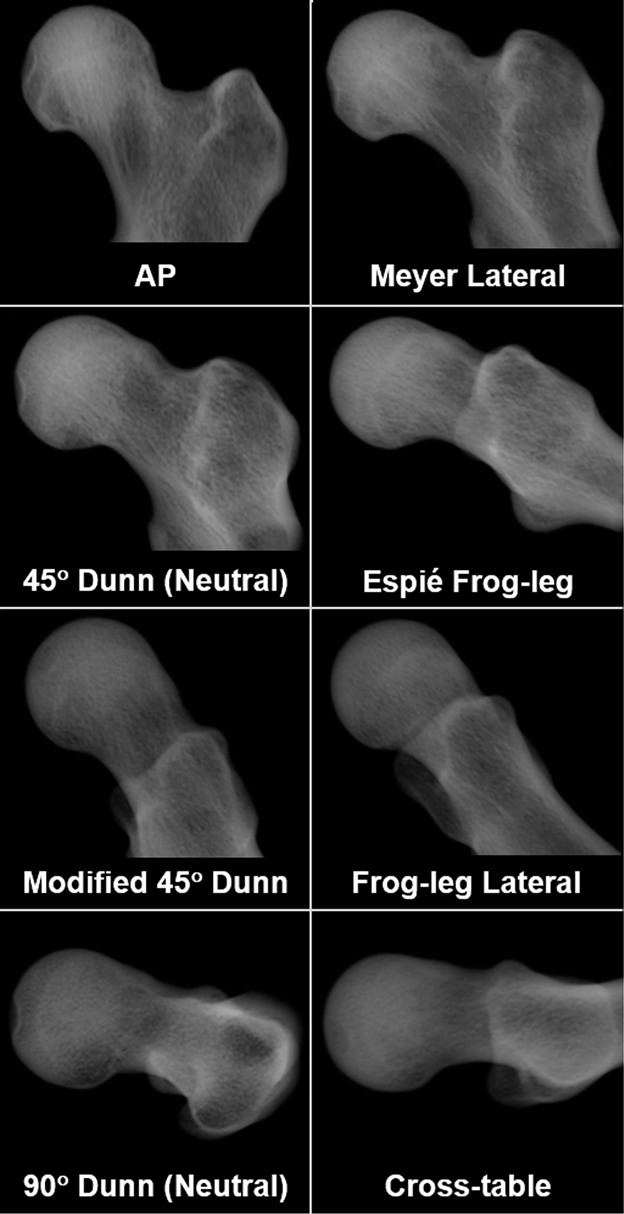
Digitally reconstructed radiographs show the eight views analyzed in this study. The radiographs shown are from a representative patient with cam FAI (26-year-old man). Alpha angle and head-neck offset measurements were obtained from each of the eight views for each femur.
Table 1.
Femur positioning for the digitally reconstructed radiographs representing eight plain film views
The segmented femur surfaces were input to open-source SSM (ShapeWorks, University of Utah, Salt Lake City, UT, USA) following previously published methods [2, 3, 24]. Briefly, this involved a computational optimization to place correspondence particles in the same relative anatomic position over each of the surfaces. This optimization produces a dense correspondence model, which serves as the mathematical foundation for SSM. This dense correspondence model ensured accurate reconstruction of surfaces that represented group statistics [3]. Thus, the chosen shape modeling pipeline was deemed appropriate for providing a reference standard in which to measure the 3-D shape of the femur as reconstructed from CT images [2, 3, 24].
We used the mean control and mean cam FAI femur correspondence particle locations to define the spectrum of shape variability for the femur (referred to here as “femur”) [3]. Correspondence particle locations for each femur were then mapped onto this spectrum to determine the individual shape scores [3]. We repeated the assignment of shape scores for the subset of correspondence particles that represented the region of the cam lesion, which was defined by a difference in mean shapes of the cam and control groups > 1 mm to provide a more direct measure of cam morphology (referred to here as “lesion”) [3]. Shape scores for the two groups were normalized such that the mean score of each group would be +1 and -1 for the control and cam femurs, respectively. The mean of each group is therefore inherently different. However, it is important to note that use of radiographs to screen participants does not guarantee that their shape score resides within the group in which they were designated because the shape score considers the entire 3-D anatomy of the proximal femur, whereas radiographic screening only considers a 2-D projection of the anatomy of the femoral head-neck junction. In other words, some of the control participants could have a shape score that was closer to the cam group (-1) than the mean of their group (+1). It is also important to recognize that the shape score is not a direct measure of cam morphology, but rather an objective assessment of the overall 3-D shape. From the shape model, computer-generated femur surfaces were reconstructed for the mean patient from the cam FAI group, the mean shape from the control group, and to represent integer shape scores of the population between -4 and +4. We mapped the shape distance between the mean shapes onto the mean cam FAI femur to provide visualization of shape variation relative to the anatomy. The rotations used for the digitally reconstructed radiograph projections were applied to this mapped surface to visualize how cam FAI anatomy was captured on each radiographic view.
The assumption that data were normally distributed was tested using the Shapiro-Wilk test. Those data that were normally distributed were represented as mean ± SD, whereas nonnormally distributed data were represented as median (interquartile range). We determined the repeatability of α angle and head-neck offset measurements using a two-way consistency calculation of intraclass correlation coefficient (ICC) [8, 19]. Excellent interrater reliability was observed on all α angle measurements (ICC range, 0.80–0.94) and three head-neck offset measurements (AP, Espié frog-leg, and modified 45° Dunn; ICC range, 0.78–0.80), good agreement on four head-neck offset measurements (Meyer lateral, frog-leg lateral, 90° Dunn, cross-table; ICC range, 0.64–0.72), and fair agreement on one head-neck offset measurement (45° Dunn; ICC, 0.42). Measurements were averaged between the two observers (PRA, YS) for all other statistical analyses. We used an unpaired Student’s t-test to compare measurements between groups, and we used the Spearman’s rank-order correlation coefficient to evaluate the relationship between each individual radiographic measurement and the shape score. The Holm-Bonferroni adjustment method corrected for multiple comparisons. Corrected p values < 0.05 were used to identify significance. All statistical analyses were completed in R (Version 3.4.1; R Core Team, Vienna, Austria) [36].
We used partial least squares (PLS) regression to determine the combination of radiographic views and associated measurements that best represented the shape scores of the proximal femur and the shape scores of the region of the cam lesion [30]. PLS regression was performed with the inherent unscaled inputs (ie, α angles and head-neck offset measurements) and with scaled inputs, where the sample SD of each measurement served as the scaling factor used to normalize the variability of the data. Although the unscaled model is more relevant clinically, the use of scaled data is more common for PLS regression. Leave-one-out crossvalidation was used to calculate the predictive power of the model. Using the leave-one-out crossvalidation method, the model is rerun several times such that each sample serves as the test data point for the regression model. The use of leave-one-out crossvalidation is the preferred method for regression models with smaller sample sizes such as the sample size used here, because model predictability is quantified considering each sample as the test data set, resulting in consistent measures of predictability, which are not dependent on the choice of the test and training data set [29]. The number of model components was determined based on minimized root mean squared error of prediction (RMSEP) such that the smallest number of components was chosen that did not differ from the global minimum RMSEP value. R2 was used as a measure of the predictability of the model given the data it was trained on, whereas RMSEP and Q2 were used to measure the predictability of the model given the test data set evaluated using crossvalidation. The variable influence on projection was used to evaluate the relevance of each measurement in the explanation of the shape scores.
Results
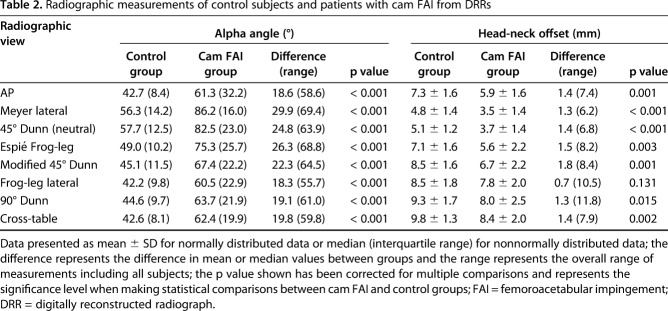
Measurements of the digitally reconstructed radiographs of the patients with cam FAI were larger for all eight α angle measurements with a large effect (effect size, d > 1.4, p < 0.001) and smaller for seven of the head-neck offset measurements with a medium to large effect (d < -0.6, p < 0.015); the standard frog-leg lateral view head-neck offset measurement was not different between groups (Table 2). We observed that with respect to the control group, α angle measurements of the patient group were largest for the Meyer lateral, which positioned the femur in 25° flexion and 20° abduction (difference of medians, 29.9°; p < 0.001) and head-neck offset measurements were smallest for the modified 45° Dunn (difference of means, -1.8 mm; p = 0.001) (Table 2).
Table 2.
Radiographic measurements of control subjects and patients with cam FAI from DRRs
The mapping of the surface distance between the mean cam FAI and the mean control femurs from SSM provided clear visualization of the average location and magnitude of the cam lesion (Fig. 3, with dark regions indicating the location of largest deviation). For many of the views, the projection of the femur did not allow visualization of the maximum deviation of the cam lesion (Fig. 3). Specifically, some radiographic projections such as the AP or cross-table views appeared more likely to position the cam lesion out of plane with the plain film projection.
Compared with the control group, the shape scores were smaller with a larger spread of data for the patients (cam: -1.0 ± 1.8 versus control: 1.0 ± 1.7; difference of means, 2.0; 95% confidence interval [CI], 1.3-2.7; p < 0.001). Similarly, the shape scores for the region of the cam lesion (Fig. 4) were smaller for the patients than for the control group with a larger spread of data (cam: -1.0 ± 1.4 versus control: 1.0 ± 1.2; difference of means, 2.0; 95% CI, 1.4-2.6; p < 0.001). Computer-generated femur reconstructions for the integer shape scores showed variability in both the femoral head-neck junction and the posterosuperior greater trochanter (Fig. 5).
Fig. 4.
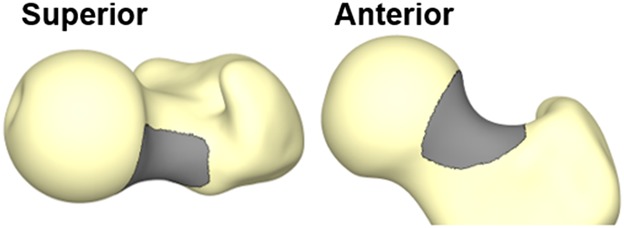
The region of the cam lesion (dark gray) is identified by overall differences in mean shapes of the cam FAI and control femurs > 1 mm.
Fig. 5.
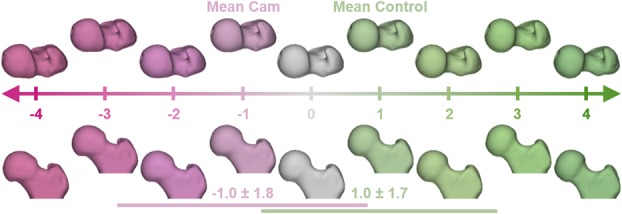
Computer-generated femur surface reconstructions representing the spectrum of variability in proximal femoral anatomy as calculated from SSM. The correspondence particles of each femur were mapped onto the spectrum of shape variation to generate a femur-specific shape score. Horizontal lines identify the SD of shape scores for the femur shapes of the patients with cam FAI (magenta) and control group participants (green). Negative shape scores indicate shapes that resemble cam femurs, whereas positive shape scores indicate shapes that resemble control femurs. Along the spectrum, shape variation in the head-neck junction can be seen in both the superior view (top) and the anterior view (bottom), whereas variation of the greater trochanter is best seen in the superior view.
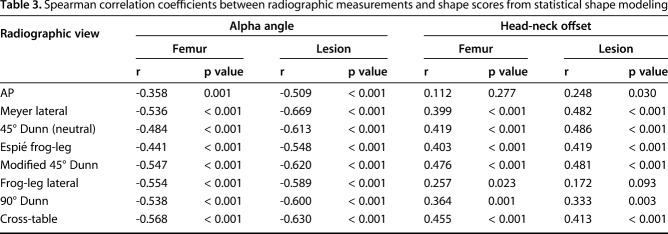
All correlations between shape scores and 2-D radiographic measurements were either weak or moderate (Table 3). Specifically, the strongest correlations with proximal femur shape were found with the cross-table α angle measurement (r = -0.568, p < 0.001) and the modified 45° Dunn head-neck offset measurement (r = 0.476, p < 0.001), whereas the strongest correlations for the shape of the isolated cam lesion were found with the Meyer lateral α angle measurement (r = -0.669, p < 0.001) and the neutral 45° Dunn head-neck offset measurement (r = 0.486, p < 0.001) (Table 3).
Table 3.
Spearman correlation coefficients between radiographic measurements and shape scores from statistical shape modeling
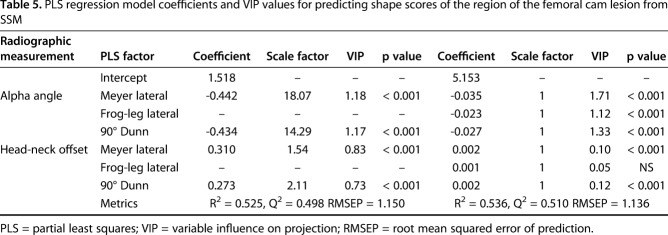
Results from PLS regression indicated that combined radiographic measurements from the Meyer lateral and 90° Dunn radiographs most effectively described femur shape, including both the shape of the overall proximal femur (Table 4) and of the isolated cam lesion (Table 5) when measurements were scaled. However, when measurement values were not scaled, the optimized model also included the frog-leg lateral view; this model improved the overall predictability of the model for the region of the cam lesion (difference in R2 = 0.011; Table 5), but diminished the predictability of the model of the proximal femur (difference in R2 = -0.011; Table 4). Radiographic measurements were better at predicting the shape of the isolated cam lesion (unscaled model, R2 = 0.536, Q2 = 0.510) than the overall shape of the proximal femur (scaled model, R2 = 0.405, Q2 = 0.373). For the scaled model, inclusion of a third radiograph, the cross-table, led to slight improvements to the goodness of fit of the regression model for the femur (R2 = 0.425, increase of 0.020). Interestingly, the inclusion of the AP radiograph led to the largest decreases in goodness of fit for the femur (R2 = 0.357, decrease of 0.048). This pattern was also true for the region of the cam lesion where the inclusion of the cross-table radiograph led to increased goodness of fit (R2 = 0.527, increase of 0.002) and the AP radiograph led to the largest decrease (R2 = 0.471, decrease of 0.054).
Table 4.
PLS regression model coefficients and VIP values for predicting shape scores of the proximal femur from SSM
Table 5.
PLS regression model coefficients and VIP values for predicting shape scores of the region of the femoral cam lesion from SSM
Discussion
Morphologic measurements from many radiographic views have been suggested to help diagnose cam FAI; however, there is little consensus as to which views provide the best visualization of femoral pathomorphology as evaluated in 3-D. Here, we quantified the ability of various radiographic projections and associated 2-D measurements of femoral head asphericity to describe the 3-D shape score of the proximal femur, as determined from SSM. The best predictive model included the α angle and head-neck offset measurements from the Meyer lateral and 90° Dunn radiographs. The predictability of the model was improved with the addition of the cross-table view; however, to minimize the number of radiographs and avoid concerns of poor image quality as a result of projection angle, the cross-table view was not included in the final regression model.
This study has several limitations. First, we used radiographic measurements of α angle and head-neck offset from frog-leg lateral reconstructed radiographs or AP plain films to screen control group participants, yet morphologic features found in symptomatic patients with cam FAI are prevalent among asymptomatic individuals [18]. Thus, our results should be interpreted with caution, because shape score values would change if asymptomatic control group participants with FAI morphology were included. We included a control group without cam morphology to evaluate regressions over a wide range of morphologies and radiographic measurements. Most of our recruited patients with cam FAI were males, which may affect the distribution of shape scores. However, cam FAI occurs more frequently in males, and therefore our results represent the population of interest [22]. Also of note, our control group consisted of 30 dissected cadaveric femurs and 29 asymptomatic volunteers. The specific medical history of the cadaveric specimens was not known such that it is unknown whether the hip may have been symptomatic. However, each cadaveric specimen was evaluated for cam morphology, which resulted in exclusion of approximately half of the femurs. Importantly, the demographics of the cadaveric specimens were not different than our living participants. A potential second limitation was that we used digitally reconstructed radiographs in lieu of standard plain films; reconstructed radiographs do not visualize soft tissue bulk surrounding the hip, making them appear different than standard plain films. Nevertheless, reconstructed radiographs have been shown to be a valid surrogate for plain films [25]. The ICC values for the measurement of α angle and head-neck offset on the digitally reconstructed radiographs were as good or better than those previously reported when measuring standard plain films, including measurements from orthopaedic clinicians with extensive imaging experience [7, 10, 33]. Furthermore, digitally reconstructed radiographs can be constructed such that they eliminate the errors caused by inconsistent placement of patients in the clinical x-ray equipment. Nevertheless, in the future, it may be useful to repeat our study using measurements of plain film radiographs instead of digitally reconstructed radiographs. This would help isolate the influence of patient positioning on the ability of 2-D measurements to predict 3-D shape of the proximal femur. Finally, it should be reiterated that this study utilized previously obtained imaging [2-4, 16, 17, 24, 25, 27] and therefore does not represent a new cohort of participants. This is relevant to future meta-analysts who should be wary of including results multiple times.
To our knowledge, this is the first study to use regression analysis to identify which radiographic views and associated 2-D measurements provided the best predictors of 3-D femur shape as quantified using SSM. A previous study found moderate to weak correlations between 2-D radiographic measurements of femoral shape from digitally reconstructed radiographs and the first three principal component loading values from SSM, which aligns with the moderate correlations we found between radiographic measurements and shape scores [25]. With respect to 3-D evaluation of femoral shape, the Dunn radiographs and the cross-table lateral views had been suggested to best capture cam morphology [31]. However, the Meyer lateral radiograph (25° flexion, 20° abduction) was also found to be valuable for imaging cam lesions because it was believed to align the morphology with the imaging plane [31]. Although the Meyer lateral radiograph has not been adopted clinically as a result of similarities with the 45° Dunn radiograph, our results support that this view, along with the 90° Dunn view, may provide the best representation of 3-D femoral anatomy. Another recent study evaluated the accuracy of clinical measurements obtained from CT-based reconstructions of the femur relative to planar CT-based measurements as the reference standard [34]. In this previous study, the largest deviations were observed in measurements of head-neck offset, which may support our observation that head-neck offset measurements had larger variability and less impact on predictions of 3-D shape (Tables 4, 5).
Measurements from plain films and 2-D slices from standard or radial reconstructions of CT or MRI have also been evaluated in an attempt to identify the best plain film views [6, 11, 12, 25, 28, 32, 37]. Previously, the sensitivity and specificity of cam FAI diagnosis from the AP, 45° Dunn, frog-leg lateral, and cross-table plain film views were evaluated relative to measurements from radial CT images. Three plain films, including the AP, 45° Dunn, and frog-leg lateral, have been recommended to be used in clinical decision-making [32]. However, none of the three views were used to predict 3-D shape in our PLS regression model, and the one view they excluded, the cross-table, slightly improved predictability when added to our two-radiograph model. These discrepancies may be the result of their use of clinical imaging protocols, instead of digitally reconstructed radiographs, or their use of 2-D measurements of radial images as the reference standard in which to evaluate anatomic shape instead of 3-D shape scores quantified with SSM. Prior studies have used radial images as a reference standard in which to evaluate the morphology of the cam lesion, yet these measurements are still based on a single, 2-D image, which likely does not capture the true 3-D shape of the cam lesion. For example, 30° radial slices on a femoral head with a radius of 20 mm would be separated by 10.5 mm on the femoral surface, which could potentially miss a large portion of the cam lesion. In a previous study that correlated α angle measurements from plain films and radial CT images to measurements of 3-D femoral head asphericity (that is, deviation from a best-fit sphere), the modified 45° Dunn and cross-table views were more strongly correlated to 3-D asphericity measurements than any of the radial reconstructions [25]. Thus, in contrast to previous reports [6, 11, 12], radial imaging may not serve as a good reference standard with which to evaluate proximal femur shape. In contrast, the shape modeling approach described here provides a means to quantify the shape of the femur in 3-D using reconstructions from CT or MR image data.
Clinicians often obtain multiple hip radiographs to evaluate hip pathologies, acetabular coverage, and degree of degeneration. One of the most commonly used radiographs is the AP radiograph. However, the inclusion of measurements from this third view into our two-radiograph regression model reduced the predictability of the model more than the inclusion of any other view. As such, the use of measurements from this and other views should focus on the overall assessment of the hip and not on the assessment of cam FAI.
Our study findings are important because they question the assumption that radiographic projections that result in higher α angle measurements and greater differences in measurements between patients with cam FAI and control participants are better projections for visualizing the cam lesion. Specifically, as we showed, some of the radiographic projections that best represented the 3-D shape score had some of the smallest α angle or largest head-neck offset measurements (for example, the 90° Dunn view). Similarly, large differences in measurements were observed between the cam and control groups on the Espié frog-leg (45° flexion, 45° abduction, and 30° external rotation) and modified 45° Dunn radiographs. However, these views were not identified through PLS regression as being predictive of 3-D shape scores of the proximal femur.
In conclusion, our results suggest that α angle and head-neck offset measurements from the Meyer lateral and 90° Dunn views provide the best prediction of the 3-D shape of the region where the cam lesion is typically located. However, the α angle and head-neck offset measurements from these and other plain film views could describe no more than half of the overall variation in the shape of the proximal femur and cam lesion. Additionally, we found that those radiographic projections that result in greater differences in α angle and head-neck offset measurements between patients with cam FAI and control participants did not necessarily provide better visualization of the cam lesion. Collectively, our results suggest caution should be exercised when interpreting α angle and head-neck offset measurements from plain film radiographs. Given these results, we believe there is merit in pursuing research that aims to develop the framework necessary to integrate SSM with the clinic, because this could aid in the diagnosis of cam FAI.
Acknowledgments
We thank Trevor Hafer, Tyler Skinner, Samuel Colby, and Lindsay Schuring for their contributions to image processing.
Footnotes
The institution of one or more of the authors has received, during the study period, funding from the National Institutes of Health (R01-EB016701 [AEA], P41-GM103545 [RTW], R01-GM083925 [JAW], R21-AR063844 [AEA]) and the LS-Peery Discovery Program in Musculoskeletal Research (PRA). One of the authors (SKA) received personal fees from Stryker Medical (Kalamazoo, MI, USA), outside the submitted work. One of the authors (CLP) received personal fees from Zimmer Biomet (Warsaw, IN, USA) and from CoNextions Medical (Salt Lake City, UT, USA), outside the submitted work.
All ICMJE Conflict of Interest Forms for authors and Clinical Orthopaedics and Related Research® editors and board members are on file with the publication and can be viewed on request.
Clinical Orthopaedics and Related Research® neither advocates nor endorses the use of any treatment, drug, or device. Readers are encouraged to always seek additional information, including FDA approval status, of any drug or device before clinical use.
Each author certifies that his or her institution approved the human protocol for this investigation and that all investigations were conducted in conformity with ethical principles of research.
References
- 1.Anderson AE, Peters CL, Tuttle BD, Weiss JA. Subject-specific finite element model of the pelvis: development, validation and sensitivity studies. J Biomech Eng. 2005;127:364–373. [DOI] [PubMed] [Google Scholar]
- 2.Atkins PR, Aoki SK, Whitaker RT, Weiss JA, Peters CL, Anderson AE. Does removal of subchondral cortical bone provide sufficient resection depth for treatment of cam femoroacetabular impingement? Clin Orthop Relat Res. 2017;475:1977–1986. [DOI] [PMC free article] [PubMed] [Google Scholar]
- 3.Atkins PR, Elhabian SY, Agrawal P, Harris MD, Whitaker RT, Weiss JA, Peters CL, Anderson AE. Quantitative comparison of cortical bone thickness using correspondence-based shape modeling in patients with cam femoroacetabular impingement. J Orthop Res. 2017;35:1743–1753. [DOI] [PMC free article] [PubMed] [Google Scholar]
- 4.Atkins PR, Fiorentino NM, Aoki SK, Peters CL, Maak TG, Anderson AE. In vivo measurements of the ischiofemoral space in recreationally active participants during dynamic activities: a high-speed dual fluoroscopy study. Am J Sports Med. 2017;45:2901–2910. [DOI] [PMC free article] [PubMed] [Google Scholar]
- 5.Barros HJ, Camanho GL, Bernabe AC, Rodrigues MB, Leme LE. Femoral head-neck junction deformity is related to osteoarthritis of the hip. Clin Orthop Relat Res. 2010;468:1920–1925. [DOI] [PMC free article] [PubMed] [Google Scholar]
- 6.Barton C, Salineros MJ, Rakhra KS, Beaule PE. Validity of the alpha angle measurement on plain radiographs in the evaluation of cam-type femoroacetabular impingement. Clin Orthop Relat Res. 2011;469:464–469. [DOI] [PMC free article] [PubMed] [Google Scholar]
- 7.Carlisle JC, Zebala LP, Shia DS, Hunt D, Morgan PM, Prather H, Wright RW, Steger-May K, Clohisy JC. Reliability of various observers in determining common radiographic parameters of adult hip structural anatomy. Iowa Orthop J. 2011;31:52–58. [PMC free article] [PubMed] [Google Scholar]
- 8.Cicchetti DV, Sparrow SA. Developing criteria for establishing interrater reliability of specific items: applications to assessment of adaptive behavior. Am J Ment Defic. 1981;86:127–137. [PubMed] [Google Scholar]
- 9.Clohisy JC, Carlisle JC, Beaule PE, Kim YJ, Trousdale RT, Sierra RJ, Leunig M, Schoenecker PL, Millis MB. A systematic approach to the plain radiographic evaluation of the young adult hip. J Bone Joint Surg Am. 2008;90(Suppl 4):47–66. [DOI] [PMC free article] [PubMed] [Google Scholar]
- 10.Clohisy JC, Nunley RM, Otto RJ, Schoenecker PL. The frog-leg lateral radiograph accurately visualized hip cam impingement abnormalities. Clin Orthop Relat Res. 2007;462:115–121. [DOI] [PubMed] [Google Scholar]
- 11.Domayer SE, Ziebarth K, Chan J, Bixby S, Mamisch TC, Kim YJ. Femoroacetabular cam-type impingement: diagnostic sensitivity and specificity of radiographic views compared to radial MRI. Eur J Radiol. 2011;80:805–810. [DOI] [PubMed] [Google Scholar]
- 12.Dudda M, Albers C, Mamisch TC, Werlen S, Beck M. Do normal radiographs exclude asphericity of the femoral head-neck junction? Clin Orthop Relat Res. 2009;467:651–659. [DOI] [PMC free article] [PubMed] [Google Scholar]
- 13.Dunn DM. Anteversion of the neck of the femur; a method of measurement. J Bone Joint Surg Br. 1952;34:181–186. [DOI] [PubMed] [Google Scholar]
- 14.Eijer H, Leunig M, Mahomed MN, Ganz R. Cross-table lateral radiographs for screening of anterior femoral head-neck offset in patients with femoro-acetabular impingement. Hip Int. 2001;11:37–41. [Google Scholar]
- 15.Espie A, Chaput B, Murgier J, Bayle-Iniguez X, Elia F, Chiron P. 45°-45°-30° frog-leg radiograph for diagnosing cam-type anterior femoroacetabular impingement: reproducibility and thresholds. Orthop Traumatol Surg Res. 2014;100:843–848. [DOI] [PubMed] [Google Scholar]
- 16.Fiorentino NM, Atkins PR, Kutschke MJ, Foreman KB, Anderson AE. In-vivo quantification of dynamic hip joint center errors and soft tissue artifact. Gait Posture. 2016;50:246–251. [DOI] [PMC free article] [PubMed] [Google Scholar]
- 17.Fiorentino NM, Kutschke MJ, Atkins PR, Foreman KB, Kapron AL, Anderson AE. Accuracy of functional and predictive methods to calculate the hip joint center in young non-pathologic asymptomatic adults with dual fluoroscopy as a reference standard. Ann Biomed Eng. 2016;44:2168–2180. [DOI] [PMC free article] [PubMed] [Google Scholar]
- 18.Frank JM, Harris JD, Erickson BJ, Slikker W, 3rd, Bush-Joseph CA, Salata MJ, Nho SJ. Prevalence of femoroacetabular impingement imaging findings in asymptomatic volunteers: a systematic review. Arthroscopy. 2015;31:1199–1204. [DOI] [PubMed] [Google Scholar]
- 19.Gamer M, Lemon J, Fellows I, Singh P. IRR: various coefficients of interrater reliability and agreement; 2012. Available at: https://cran.r-project.org/web/packages/irr/irr.pdf. Accessed July 30, 2018.
- 20.Ganz R, Leunig M, Leunig-Ganz K, Harris WH. The etiology of osteoarthritis of the hip: An integrated mechanical concept. Clin Orthop Relat Res. 2008;466:264–272. [DOI] [PMC free article] [PubMed] [Google Scholar]
- 21.Griffin DR, Dickenson EJ, O'Donnell J, Agricola R, Awan T, Beck M, Clohisy JC, Dijkstra HP, Falvey E, Gimpel M, Hinman RS, Holmich P, Kassarjian A, Martin HD, Martin R, Mather RC, Philippon MJ, Reiman MP, Takla A, Thorborg K, Walker S, Weir A, Bennell KL. The Warwick agreement on femoroacetabular impingement syndrome (FAI syndrome): an international consensus statement. Br J Sports Med. 2016;50:1169–1176. [DOI] [PubMed] [Google Scholar]
- 22.Halim A, Badrinath R, Carter CW. The importance of sex of patient in the management of femoroacetabular impingement. Am J Orthop (Belle Mead NJ). 2015;44:172–175. [PubMed] [Google Scholar]
- 23.Harris MD, Anderson AE, Henak CR, Ellis BJ, Peters CL, Weiss JA. Finite element prediction of cartilage contact stresses in normal human hips. J Orthop Res. 2012;30:1133–1139. [DOI] [PMC free article] [PubMed] [Google Scholar]
- 24.Harris MD, Datar M, Whitaker RT, Jurrus ER, Peters CL, Anderson AE. Statistical shape modeling of cam femoroacetabular impingement. J Orthop Res. 2013;31:1620–1626. [DOI] [PMC free article] [PubMed] [Google Scholar]
- 25.Harris MD, Kapron AL, Peters CL, Anderson AE. Correlations between the alpha angle and femoral head asphericity: implications and recommendations for the diagnosis of cam femoroacetabular impingement. Eur J Radiol. 2014;83:788–796. [DOI] [PMC free article] [PubMed] [Google Scholar]
- 26.Henak CR, Abraham CL, Peters CL, Sanders RK, Weiss JA, Anderson AE. Computed tomography arthrography with traction in the human hip for three-dimensional reconstruction of cartilage and the acetabular labrum. Clin Radiol. 2014;69:e381–391. [DOI] [PMC free article] [PubMed] [Google Scholar]
- 27.Kapron AL, Aoki SK, Peters CL, Anderson AE. In-vivo hip arthrokinematics during supine clinical exams: application to the study of femoroacetabular impingement. J Biomech. 2015;48:2879–2886. [DOI] [PMC free article] [PubMed] [Google Scholar]
- 28.Konan S, Rayan F, Haddad FS. Is the frog lateral plain radiograph a reliable predictor of the alpha angle in femoroacetabular impingement? J Bone Joint Surg Br. 2010;92:47–50. [DOI] [PubMed] [Google Scholar]
- 29.Mevik B-H, Cederkvist HR. Mean squared error of prediction (MSEP) estimates for principal component regression (PCR) and partial least squares regression (PLSR). Journal of Chemometrics. 2004;18:422–429. [Google Scholar]
- 30.Mevik B-H, Wehrens R. The pls package: principal component and partial least squares regression in R. Journal of Statistical Software. 2007;18:1–24. [Google Scholar]
- 31.Meyer DC, Beck M, Ellis T, Ganz R, Leunig M. Comparison of six radiographic projections to assess femoral head/neck asphericity. Clin Orthop Relat Res. 2006;445:181–185. [DOI] [PubMed] [Google Scholar]
- 32.Nepple JJ, Martel JM, Kim YJ, Zaltz I, Clohisy JC. Do plain radiographs correlate with CT for imaging of cam-type femoroacetabular impingement? Clin Orthop Relat Res. 2012;470:3313–3320. [DOI] [PMC free article] [PubMed] [Google Scholar]
- 33.Nepple JJ, Martell JM, Kim YJ, Zaltz I, Millis MB, Podeszwa DA, Sucato DJ, Sink EL, Clohisy JC. Interobserver and intraobserver reliability of the radiographic analysis of femoroacetabular impingement and dysplasia using computer-assisted measurements. Am J Sports Med. 2014;42:2393–2401. [DOI] [PubMed] [Google Scholar]
- 34.Ng KCG, Lamontagne M, Labrosse MR, Beaulé PE. Comparison of anatomical parameters of cam femoroacetabular impingement to evaluate hip joint models segmented from CT data. Comput Methods Biomech Biomed Eng Imaging Vis. 2018;6:293–302. [Google Scholar]
- 35.Notzli HP, Wyss TF, Stoecklin CH, Schmid MR, Treiber K, Hodler J. The contour of the femoral head-neck junction as a predictor for the risk of anterior impingement. J Bone Joint Surg Br. 2002;84:556–560. [DOI] [PubMed] [Google Scholar]
- 36.RCoreTeam. R: A Language and Environment for Statistical Computing. Vienna, Austria: R Foundation for Statistical Computing; 2014. [Google Scholar]
- 37.Sutter R, Dietrich TJ, Zingg PO, Pfirrmann CW. How useful is the alpha angle for discriminating between symptomatic patients with cam-type femoroacetabular impingement and asymptomatic volunteers? Radiology. 2012;264:514–521. [DOI] [PubMed] [Google Scholar]
- 38.Tannast M, Siebenrock KA, Anderson SE. Femoroacetabular impingement: Radiographic diagnosis–what the radiologist should know. AJR Am J Roentgenol. 2007;188:1540–1552. [DOI] [PubMed] [Google Scholar]
- 39.Troelsen A, Jacobsen S, Rømer L, Søballe K. Weightbearing anteroposterior pelvic radiographs are recommended in DDH assessment. Clin Orthop Relat Res. 2008;466:813–819. [DOI] [PMC free article] [PubMed] [Google Scholar]
- 40.Van den Broeck J, Vereecke E, Wirix-Speetjens R, Vander Sloten J. Segmentation accuracy of long bones. Med Eng Phys. 2014;36:949–953. [DOI] [PubMed] [Google Scholar]


