

Abstract
Dementia increases the risk of mortality (ROM) in the elderly and estimates of hazard ratio (HR) of dementia for mortality have ranged from 1.7 to 6.3. However, previous studies may have underestimated ROM of dementia due to length bias, which occurs when failing to include the persons with rapidly progressive diseases, who died before they could be included in the study. This population-based prospective cohort study conducted on 6,752 randomly sampled Koreans, aged 60 years or older (the Korean Longitudinal Study on Cognitive Aging and Dementia). Cognitive disorders were evaluated at baseline and 2-year follow-up using the Korean version of the Consortium to Establish a Registry for Alzheimer’s Disease Assessment Packet (CERAD-K), and prevalent and incident cases of dementia were identified. The participants’ deaths were confirmed through the National Mortality Database of Statistics Korea. We compared the ROM between prevalent and incident dementia, and estimated HR of dementia for mortality using Cox proportional hazards model. Of the 5,097 responders to the 2-year follow-up assessment, 150 participants had dementia from the baseline (prevalent dementia), and 95 participants developed dementia during the 2-year follow-up period (incident dementia). The ROM of participants with incident dementia was about 3 times higher than the ROM of those with prevalent dementia (HR = 3.04, 95% confidence interval [CI] = 1.34-6.91). Compared to cognitively normal participants at both the baseline and 2-year follow-up assessments, the ROM of those with incident dementia approximately 8 times higher (HR = 8.37, 95 % CI = 4.23-16.54). In conclusion, the ROM of dementia using prevalent cases was underestimated due to length bias, and dementia may be much more fatal than previously estimated. In clinical settings, the ROM of dementia warrants the attention of physicians, particularly in recently incident dementia cases.
Keywords: dementia, Alzheimer’s disease, mortality, death, survival
The number of deaths due to dementia more than doubled, in the period from 2000 to 2015, making it the seventh leading cause of death, globally, and the third leading cause of death, in high-income countries [1]. Dementia killed about 1.6 million people in 2015; this accounts for about 3% of the 56.4 million deaths, worldwide, in that year [1].
Previously conducted population-based cohort studies consistently reported that dementia [2-20] and mild cognitive impairment (MCI) [6, 10, 11, 16, 21-23] increased the risk of mortality (ROM) in elderly people. However, the ROM of dementia and MCI might have been underestimated in those studies, due to a number of reasons. First, most of the studies estimated the ROM of dementia and MCI in prevalent cases. Of the 19 studies on the ROM of dementia published from 1998 to 2017 [2-20], only 6 were conducted on incident cases [13-18]. Of the 7 studies on the ROM of MCI, published from 2003 to 2017 [6, 10, 11, 16, 21-23], only 1 was conducted on incident cases [22]. In the studies that employed prevalent cases only, the ROM could have been underestimated due to length bias, because prevalent cases might not include the persons with rapidly progressive diseases, who died before they could be included in the study [24-27]. Second, many of those studies estimated the ROM of dementia by employing non-demented elderly people, instead of cognitively normal elderly people as the reference group [2-4, 15, 16, 18-20, 24, 28]. Since MCI also increased the ROM [22, 29, 30], the ROM of dementia could have been underestimated if the non-demented reference group included cases of MCI. However, only 3 studies, till date, have estimated the ROM of dementia, relative to a reference group comprising those without cognitive impairment [6, 10, 11]. Six studies that investigated the ROM of dementia, using incident cases, included MCI in their reference groups. Third, the ROM might have been underestimated in some studies due to their designs. The ROM of dementia tended to decrease as the follow-up interval increased (Fig. 1); the hazard ratio (HR) for mortality due to dementia was over 2, when the interval of the follow-up assessment was under 2 years [14, 16, 18], and below 2, when the interval of the follow-up assessment was 2 years or more [13, 15, 17].
Figure 1.

The estimated risks of mortality of dementia according to the interval and duration of follow-up. *Estimated using Cox proportional hazard models and compared to non-demented participants; the error bars indicate 95% confidence. The references are as follows: [2-5, 7-9, 12-20].
In the present 4-year nationwide population-based prospective cohort study, we hypothesized that if length bias affects the estimates of ROM of dementia, the ROM of incident dementia would be higher than that of prevalent dementia. Furthermore, in order to establish the unbiased ROM of dementia, we estimated it in incident cases with dementia, and employed cognitively normal individuals as the reference group.
MATERIALS AND METHODS
Participants
This study was a part of the Korean Longitudinal Study on Cognitive Aging and Dementia (KLOSCAD) [32]. In the KLOSCAD, we randomly sampled 30 villages and towns from 13 specific districts across South Korea (hereafter, Korea). Using residential rosters and data on residents aged 60 years and above, we randomly selected 10% of the elderly adults from urban areas and 20% from rural areas. In the baseline assessment, which was conducted from November 2010 through October 2012, 6,818 (53.7%) individuals participated. 6,752 were included in the current analysis, after 3 individuals who had mental retardation, 2 in whom the diagnosis for cognitive disorders due to a comorbid major depressive disorder was uncertain, and 61 who did not provide their personal identification numbers, that are necessary for the identification of death at the National Mortality Database of Statistics Korea, were excluded. Follow-up assessments have been conducted every two years, with the first follow-up assessment conducted between November 2012 and October 2014. 5,097 participants completed the 2-year follow-up assessment, 181 passed away during the follow-up period, and 1,474 refused to undergo the follow-up assessment (Fig. 2). This study’s protocol was approved by the Institutional Review Board of Seoul National University Bundang Hospital. All subjects were fully informed of the study protocol. All subjects provided written informed consent, which was signed by either the subjects or their legal guardians.
Figure 2.

The flowchart of the mortality analysis in the Korean Longitudinal Study on Cognitive Aging and Dementia. MCI = mild cognitive impairment.
Assessments and Diagnosis
In the KLOSCAD, geriatric neuropsychiatrists with expertise in dementia research conducted a face-to-face standardized diagnostic interview, as well as physical and neurological examinations, using the Korean version of the Consortium to Establish a Registry for Alzheimer’s Disease Assessment Packet (CERAD-K) Clinical Assessment Battery and the Korean version of the Mini International Neuropsychiatric Inventory [33]. Comorbid medical illnesses were evaluated using the Cumulative Illness Rating Scale (CIRS)[34] and the vascular components of cognitive impairment using the Modified Hachinski Ischemic Score (MHIS) [35]. Trained research neuropsychologists administered the CERAD-K Neuropsychological Assessment Battery (CERAD-K-N), Digit Span Test, and Frontal Assessment Battery. The CERAD-K-N consists of 9 neuropsychological tests: The Verbal Fluency Test, 15-item Boston Naming Test, Mini Mental Status Examination, Word List Memory Test, Constructional Praxis Test, Word List Recall Test, Word List Recognition Test, Constructional Recall Test, and Trail Making Test. A panel of research neuropsychiatrists determined the final diagnosis of each participant. Dementia and depressive disorders were diagnosed according to the criteria of the Diagnostic and Statistical Manual of Mental Disorders, Fourth Edition [36], and, further, Alzheimer’s disease (AD) was diagnosed according to the criteria of the National Institute of Neurological and Communicative Disorders and Stroke and the Alzheimer’s Disease and Related Disorders Association [37]. We diagnosed MCI according to the consensus criteria from the International Working Group on MCI [38]. We ascertained the presence of objective cognitive impairment if a participant performed -1.5 standard deviation or below of the age-, gender-, and education-adjusted norms in any of the 11 neuropsychological tests [39]. We defined normal cognition (NC) as the state of having no cognitive disorders (MCI or dementia) and other psychiatric or neurologic disorders.
Identification of Death
The deaths of participants were identified from the National Mortality Database of Statistics Korea using personal identification numbers. In Korea, deaths are reported to the corresponding local governments, and included in a national database of deaths in the country, which is managed by Statistics Korea. This database provides the date, place, and cause of death, as confirmed by a physician [40]. In the case of those who responded to the 2-year follow-up assessment, we identified their death within 2 years from their 2-year follow-up assessment. In the non-responders to the 2-year follow-up assessment, we identified their death within 4 years from their baseline assessment.
Statistical Analysis
We compared the continuous variables, between the groups, using an independent sample t-test and one-way analysis of variance, and the categorical variables using the χ2 test. We investigated the association of cognitive disorders with the ROM using Cox proportional hazard models. We adjusted for potential confounding factors such as age, sex, years of education, smoking status, alcohol consumption status, MHIS, CIRS score and presence of depressive disorders, because these factors were associated with the ROM in the elderly. The appropriateness of the models was checked graphically by plotting the log[-log(survival)] curves versus log(time). First, we estimated the 4-year ROM of the prevalent cases, at the baseline assessment (NC, MCI, and dementia), using multivariate Cox proportional hazard models that adjusted potential confounding factors. This analysis included 6,752 individuals who participated in the baseline assessment, regardless of their participation in the follow-up assessment. Second, we compared the ROM between the prevalent and incident cases of dementia, AD and MCI, using multivariate Cox proportional hazard models that adjusted potential confounding factors. This analysis included 5,097 individuals who participated in both the baseline and 2-year follow-up assessments. Third, individuals with NC at both the assessments were assigned to the reference group, and we estimated the ROM in prevalent and incident cases of dementia and MCI, using multivariate Cox proportional hazard models, which adjusted potential confounding factors. Fourth, we constructed Kaplan-Meier survival plots and performed log-rank tests to estimate the cumulative survivals of the cases of prevalent and incident dementia and MCI. All the statistical analyses were performed using SPSS Statistics 20, Release Version 20.0.0 (SPSS, Inc., 2011, Chicago, IL).
RESULTS
Of the 6,752 individuals who participated in the baseline assessment, 181 passed away within 2 years. In total, 5,097 participants responded to the 2-year follow-up assessment and 1,474 refused to participate in the follow-up assessment. At the baseline assessment, MCI and dementia were less prevalent in those who participated in the 2-year follow-up assessment compared to those who did not (26.4% versus 31.6% for MCI, 2.9% versus 8.9% for dementia, p < 0.001, Chi square test). The responders were younger, more educated, and likelier to be alcohol drinkers, and had higher CIRS scores; however, their MHIS was lower than that of the non-responders (Table 1).
Table 1.
Baseline characteristics of the responders and non-responders, at the 2-year follow-up assessment.
| Baseline characteristics | Responders | Non-responders | Statistics*
|
|
|---|---|---|---|---|
| T or χ2 | p | |||
| Normal cognition | ||||
| Number | 3599 | 878 | ||
| Age (years ± SD) | 68.9 ± 6.1 | 69.2 ± 6.4 | -1.108 | 0.268 |
| Sex (men, %) | 44.8 | 45.7 | 0.197 | 0.657 |
| Education (years ± SD) | 8.9 ± 5.3 | 8.1 ± 5.3 | 4.312 | < 0.001 |
| Smoking status (yes, %)† | 31.0 | 30.8 | 0.004 | 0.950 |
| Alcohol consumption (yes, %)† | 34.2 | 33.8 | 0.049 | 0.824 |
| MHIS (score ± SD) | 0.7 ± 0.9 | 0.6 ± 0.7 | 1.511 | 0.131 |
| CIRS score (score ± SD) | 4.3 ± 2.8 | 3.9 ± 2.5 | 4.176 | < 0.001 |
| Depression (yes, %)‡ | 2.0 | 3.1 | 3.059 | 0.080 |
| Mild cognitive impairment | ||||
| Number | 1348 | 465 | ||
| Age (years ± SD) | 71.8 ± 6.7 | 72.4 ± 8.0 | -1.352 | 0.177 |
| Sex (men, %) | 38.5 | 35.5 | 1.300 | 0.254 |
| Education (years ± SD) | 6.9 ± 5.0 | 5.7 ± 4.8 | 4.590 | < 0.001 |
| Smoking status (yes, %)† | 26.9 | 24.6 | 0.872 | 0.350 |
| Alcohol consumption (yes, %)† | 28.3 | 24.5 | 2.354 | 0.125 |
| MHIS (score ± SD) | 0.9 ± 1.1 | 0.9 ± 1.2 | -0.919 | 0.358 |
| CIRS score (score ± SD) | 4.9 ± 2.9 | 4.6 ± 3.0 | 1.474 | 0.141 |
| Depression (yes, %)‡ | 5.8 | 5.0 | 0.392 | 0.531 |
| Dementia | ||||
| Number | 150 | 131 | ||
| Age (years ± SD) | 77.9 ± 7.9 | 79.7 ± 7.7 | -1.957 | 0.051 |
| Sex (men, %) | 32.0 | 24.4 | 1.969 | 0.161 |
| Education (years ± SD) | 3.8 ± 4.5 | 3.3 ± 4.4 | 0.800 | 0.424 |
| Smoking status (yes, %)† | 20.4 | 22.2 | 0.123 | 0.726 |
| Alcohol consumption (yes, %)† | 13.5 | 5.5 | 4.522 | 0.033 |
| MHIS (score ± SD) | 1.5 ± 1.9 | 1.7 ± 2.6 | -1.017 | 0.310 |
| CIRS score (score ± SD) | 4.9 ± 2.8 | 5.7 ± 3.7 | -1.972 | 0.050 |
| Depression (yes, %)‡ | 12.2 | 11.0 | 0.087 | 0.776 |
| All | ||||
| Number | 5097 | 1474 | ||
| Age (years ± SD) | 70.0 ± 6.6 | 71.1 ± 7.7 | -5.322 | < 0.001 |
| Sex (men, %) | 42.8 | 40.6 | 2.286 | 0.131 |
| Education (years ± SD) | 8.2 ± 5.4 | 6.9 ± 5.3 | 8.615 | < 0.001 |
| Smoking status (yes, %)† | 29.6 | 28.2 | 0.986 | 0.321 |
| Alcohol consumption (yes, %)† | 32.0 | 28.6 | 5.881 | 0.015 |
| MHIS (score ± SD) | 0.7 ± 1.0 | 0.8 ± 1.2 | -2.191 | 0.029 |
| CIRS score (score ± SD) | 4.5 ± 2.8 | 4.3 ± 2.9 | 2.323 | 0.020 |
| Depression (yes, %)‡ | 3.3 | 4.3 | 2.971 | 0.085 |
SD = standard deviation, MHIS = Modified Hachinski Ischemic Score, CIRS = Cumulative Illness Rating Scale
Continuous variables were compared using a t-test and categorical variables were compared using χ2 tests
Smoked or drank alcohol within the past one year
Diagnosed as having major or minor depressive disorders
Of those who responded to the 2-year follow-up assessment, 107 passed away within 2 years from the follow-up assessment. Among the non-responders, 181 and 99 passed away before and after the 2-year follow-up assessment, respectively. Compared to the participants with NC, at the baseline assessment, those with MCI showed approximately a 1.5-fold higher risk of 4-year mortality (HR = 1.49, 95% confidence intervals [CI] = 1.16-1.92) and those with dementia showed about a 2.7-fold higher risk of 4-year mortality (HR = 2.67 95% CI = 1.90-3.74). The HR for 4-year mortality of dementia was reduced to about 2.14 (95% CI 1.57-2.90) when we employed the non-demented people, i.e., people with NC or MCI, as the reference group.
Of 5,097 participants who responded to the 2-year follow-up assessment, 150 participants had dementia in both the baseline and follow-up assessments (hereafter, prevalent dementia), and 95 participants who were not demented in the baseline assessment converted to dementia in the follow-up assessment (hereafter, incident dementia). The participants with incident dementia showed about a 3-fold higher risk of 2-year mortality than those with prevalent dementia (Table 2). Compared to the participants with prevalent dementia, those with incident dementia were more educated (3.79 ± 4.49 vs 5.58 ± 5.20, p = 0.005), and had fewer smoker (33.0% vs 20.4%, p = 0.030) and higher CIRS scores (4.94 ± 2.82 vs 6.19 ± 3.42, p = 0.003) at the baseline assessment. At the 2-year follow-up assessment, however, the participants with incident dementia had more very mild (clinical dementia rating [CDR] = 0.5) or mild (CDR = 1) cases, relative to those with prevalent dementia (90.0% vs 71.0%, p = 0.001). There were no significant differences in terms of the other demographic and clinical characteristics, including age, sex, MIHS, alcohol consumption status, diagnosis of depression, and the distribution of the dementia subtypes (p > 0.1), between the groups. The distributions of the dementia subtypes were also comparable between the prevalent and incident cases; 74% of the prevalent dementia and 69% of the incident dementia cases had AD (χ2= 1.650, p = 0.199). The participants with incident AD also showed about a 3-fold higher risk of 2-year mortality than those with prevalent AD. The participants with incident dementia, who passed away within 2 years from the diagnosis, were more likely to be male (p = 0.043) and alcohol drinkers (p = 0.002) than those who survived for 2 years after the diagnosis. However, the other demographic and clinical characteristics, including age, years of education, smoking status, CIRS score, MIHS, and diagnosis of depression were comparable between the 2 groups. Although the 2-year ROM of incident MCI was also higher than that of prevalent MCI, the difference was statistically insignificant.
Table 2.
Comparison of the mortality risks between prevalent and incident cases.
| Diagnosis | Type | Number of participants | Person-years | Number of deaths | HR (95% CI)* |
|---|---|---|---|---|---|
| Dementia | Prevalent cases | 150 | 251.8 | 13 | 1.00 |
| Incident cases | 95 | 158.5 | 15 | 3.04 (1.34 - 6.91) | |
| Alzheimer’s disease | Prevalent cases | 117 | 201.5 | 9 | 1.00 |
| Incident cases | 67 | 118.0 | 9 | 2.90 (1.06 - 7.97) | |
| Mild cognitive impairment | Prevalent cases | 744 | 1285.0 | 23 | 1.00 |
| Incident cases | 502 | 848.5 | 17 | 1.24 (0.65 - 2.34) |
HR = hazard ratio; CI = confidence intervals
Adjusted by age, educational level, sex, alcohol consumption, smoking status, Cumulative Illness Rating Scale score, Modified Hachinski Ischemic Score and the presence of a depressive disorder
At the 2-year follow-up assessment, 18 and 77 individuals, who had NC and MCI, respectively, at the baseline assessment, were converted to dementia, and 502 participants who had NC, at the baseline assessment, were converted to MCI. Of the participants with MCI, at the baseline, 527 cases reverted to NC (hereafter, reverted MCI) and in 722, the status did not change (hereafter, stable MCI). Compared with the participants who had NC at both the baseline and 2-year follow-up assessments (hereafter, stable NC), those with incident dementia showed about an 8-fold increased risk of 2-year mortality (HR = 8.37 95 % CI = 4.23-16.54). The mortality HR of incident dementia was 8.20 (95% CI = 2.39-28.14) in the participants who were NC at the baseline, and 8.41 (95% CI = 4.05-17.50) in those who were MCI at the baseline. The HR for 2-year mortality of the incident dementia cases was reduced to about 5.53 (95% CI 3.06-9.99) when we employed the non-demented people, i.e., people with stable NC, prevalent or incident MCI, as the reference group. Compared to the participants with stable NC, the participants with incident MCI and stable MCI showed about a 2-fold increased risk of 2-year mortality. However, the mortality of the participants with reverted MCI was comparable to that of the participants with stable NC (Table 3).
Table 3.
The risk of mortality according to the diagnosis at baseline and 2-year follow-up assessment.
| Diagnosis | No. of participants | Deaths
|
||
|---|---|---|---|---|
| Person-years | No. | HR (95% CI)* | ||
| NC at both baseline and follow-up | 3079 | 5406.6 | 28 | 1.00 |
| Prevalent MCI† | 744 | 1285.0 | 23 | 1.94 (1.06 - 3.52) |
| Incident MCI‡ | 502 | 848.5 | 17 | 2.22 (1.14 - 4.30) |
| Prevalent dementia§ | 150 | 251.8 | 13 | 2.82 (1.28 - 6.22) |
| Incident dementia§§ | 95 | 158.5 | 15 | 8.37 (4.23 - 16.54) |
| Not demented at both baseline and follow-up | 4849 | 8494.1 | 79 | 1.00 |
| Prevalent dementia§ | 150 | 251.8 | 13 | 1.82 (0.90 - 3.69) |
| Incident dementia§§ | 95 | 158.5 | 15 | 5.53 (3.06 - 9.98) |
HR = hazard ratio; CI = confidence interval; NC = normal cognition; MCI = mild cognitive impairment
Adjusted by age, educational level, sex, alcohol consumption, smoking status, Cumulative Illness Rating Scale score, Modified Hachinski Ischemic Score, and the presence of a depressive disorder
MCI in both the baseline and follow-up assessments
NC in the baseline assessment and converted to MCI in the follow-up assessment
Dementia in both the baseline and follow-up assessment
Not demented in the baseline assessment but was converted to dementia in the follow-up assessment
Compared to the participants with stable NC, those with incident dementia showed the least favorable rates of survival (log-rank test = 161.326, p < 0.001) followed by those with prevalent dementia (log-rank test = 71.982, p < 0.001). The participants with prevalent and incident MCI showed less favorable rates of survival than those with stable NC or reverted MCI (log-rank test = 22.318 and 22.207, p < 0.001), but more favorable rates of survival than those with incident dementia (log-rank test = 23.593 and 31.515, p < 0.001) or prevalent dementia (log-rank test = 7.174 and 10.200, p = 0.007 and 0.001) (Fig. 3).
Figure 3.
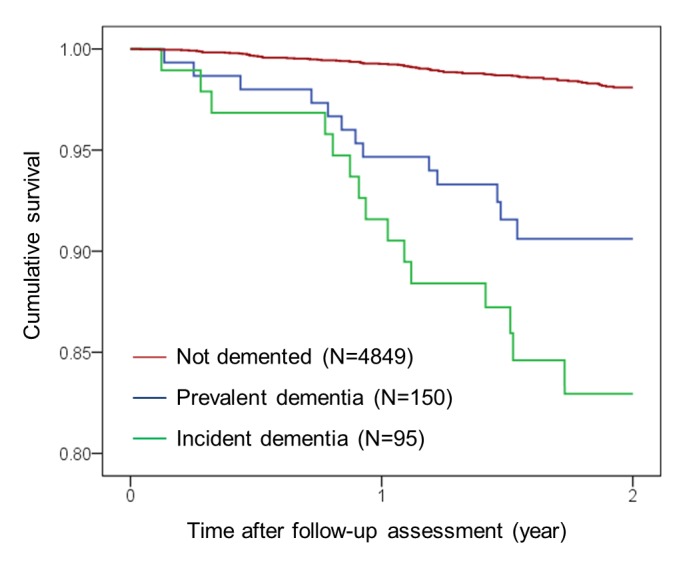
Kaplan-Meier survival curves of the prevalent and incident cases with dementia.
DISCUSSION
This study showed that the ROM in the elderly with newly incident dementia was higher than the ROM in those with previously diagnosed dementia, and incident dementia increased the ROM of elderly people more than previously reported. To our knowledge, no study has directly compared the ROM of dementia between the prevalent and incident cases in a population. As summarized in Table 4, the HRs for mortality reported in incident dementia cases ranged from 1.7 to 3.1 [13-18], which were rather at the lower end of the scale when compared to the HRs reported in studies which enrolled prevalent cases (2.2-6.3) [2-12] in previous studies. Guhne et al.[16] assumed that the studies using prevalent cases for estimating mortality were biased in so far as they included more severe cases. However, in this study, the 2-year HR for mortality in the incident dementia cases was about 3 times higher than that in prevalent dementia cases, despite the fact that the severity of dementia, in the incident cases, was milder than that in the prevalent cases.
Table 4.
Studies investigating the risk of mortality of dementia or Alzheimer’s disease.
| Study (year of publication) |
Number | Age (years) |
Sex (F, %) |
Diagnosis | Reference group | HR of dementia (or AD) |
Duration of follow-up |
Follow-up assessment | Interval of follow-up assessment (years) |
|---|---|---|---|---|---|---|---|---|---|
| Aguero-Torres et al. (1998) |
989 | 77+ | 77 | Incident dementia | Non-demented | 2.0 (1.5-2.7) | 5.0 | Yes | 3.4 |
| Aevarsson et al. (1998) |
494 | 95+ | 71 | Prevalent dementia, AD |
Non-demented | 2.6 (male) 2.9 (female) | 7.0 | No | |
| Baldereschi et al. (1999) |
5632 | 65+ | 49 | Prevalent dementia | Non-demented | 3.56 (2.52-5.04) | 2.3 | No | |
| Helmer et al. (2001) |
3777 | 65+ | Incident dementia | Non-demented | 1.80 (1.46-2.21) | 8.0 | Yes | 2.2 | |
| Noale et al. (2003) |
5632 | 65+ | 49 | Prevalent dementia | Non-demented | 3.72 (3.01-4.60) | 4.0 | No | |
| Tschanz et al. (2004) |
4683 | 65+ | 57 | Prevalent dementia | Non-demented | 2.99 (2.53-3.53) | 5.0 | No | |
| Fitzpatrick et al. (2005) |
3602 | 65+ | 59 | Incident dementia, AD |
Non-demented | Dementia: 2.8 (2.3-3.4) AD: 2.1 (1.6-2.7) |
6.5 | Yes | 1.0 |
| Nitrini et al. (2005) |
1956 | 65+ | Prevalent dementia | Non-demented | 3.92 (2.80-5.48) | 4.0 | No | ||
| Ganguli et al. (2005) |
1681 | 65+ | 58 | Prevalent AD + Incident AD |
Non-demented | 1.7 (1.4-2.0) | 10.3 | Yes | 2.0 |
| Guhne et al. (2006) |
1124 | 75+ | 75 | Incident dementia | Non-demented | 2.42 (1.62-3.63) | 4.5 | Yes | 1.6 |
| Scarmeas et al. (2007) |
338 | 65+ | 78 | Prevalent AD | Non-demented | 2.38 (1.86-3.04) | 4.4 | No | |
| Llinàs-Regla et al. (2008) |
1153 | 70+ | 57 | Prevalent dementia | Non-demented | 2.3 (1.7-3.2) | 4.3 | No | |
| Wilson et al. (2009) |
1715 | 65+ | 62 | Prevalent AD | Normal cognition | 2.84 (2.29-3.52) | 4.7 | No | |
| Villarejo et al. (2011) |
5262 | 65+ | 58 | Prevalent dementia | Non-demented | 3.16 (2.74-3.65) | 13 | No | |
| Wu et al. (2011) |
2788 | Prevalent dementia | Non-demented | 2.18 (1.75-2.71) | 7.3 | No | |||
| James et al. (2014) |
2566 | 65+ | 72 | Incident AD | Non-demented | 3.13 (2.74-3.58) | 8.0 | Yes | 1.0 |
| Chen et al. (2014) |
2978 | 60+ | Prevalent dementia | Non-demented | 2.69 (2.11-3.42) | 5.0 | No | ||
| Park et al. (2014) |
1035 | 65+ | 58 | Prevalent dementia | Normal cognition | 3.20 (2.30-4.44) | 8.0 | No | |
| Paddick et al. (2015) |
1198 | 70+ | 71 | Prevalent dementia | Normal cognition | 6.33 (3.19-12.58) | 4.0 | No |
HR = hazard ratio; AD = Alzheimer’s disease; F= female
These results directly showed that the estimation of the ROM in dementia may be subject to length bias. Length bias can lead to an underestimation of the deleterious effects of diseases because of the failure to include persons with rapidly progressive diseases, who died before they could be included in the study [26, 27]. In a population-based cohort study in Netherlands, 8-13% of the dementia patients died within 2 years after diagnosis and their mean survival was 12 months [41]. In the dementia cases from the Canadian Study of Health and Aging, the estimated median survival was markedly reduced, from 6.6 years to 3.3 years, when the length bias was adjusted [27]. The studies using incident cases may also have been subject to length bias. Some participants with rapidly progressive diseases may progress to dementia during the follow-up period and die before follow-up assessment. The population-attributable risks (PARs) of AD, estimated using incident cases in 3 previously conducted studies, were different according to the intervals of the follow-up assessments. The PARs of AD were estimated to be 37% in a study which conducted annual follow-ups [14], while the value was 18.3% in a study with biannual follow-ups and 15% in a study with triannual follow-ups [15, 17].
In the present study, the 2-year HR of the mortality of the incident dementia cases was 8.37, which was much higher than those estimated in previously conducted studies [13-18]. Since the 2-year HR of mortality of the prevalent dementia cases, estimated in the present study, was comparable to those estimated in other studies [2-12], the high estimated HR of the incident dementia cases could be attributed to the following reasons, rather than the differences in the study samples, between the present and previous studies. First, 6 previous studies on the ROM of incident dementia cases employed non-demented individuals as their reference groups, instead of individuals with NC. The enrollment of individuals with MCI, who were potentially included in the non-demented control groups, might have reduced the estimated HR of mortality in those studies [13-17]. In the present study, the HR of mortality of the incident dementia cases reduced from 8.37 to 5.53 when both NC and MCI cases were included in the reference group. Second, the duration of the follow-ups in the previous studies was longer than that in the current study. Of the 6 studies which enrolled incident dementia cases, the average follow-up duration was 4-8 years in 3 studies [16-18] and over 8 years in the rest [13-15]. As the duration of the follow-up increases, the proportion of dementia cases with longer survival times after dementia onset, may increase; thus, the estimated ROM may decrease.
This study did not directly investigate why newly incident dementia had high mortality. However, the participants with incident dementia had higher CIRS scores at baseline than those with prevalent dementia. In future studies, it should be investigated whether comorbid medical illnesses that may increase mortality may accelerate the progression of dementing illness from preclinical stage to clinical stage, or the speed of cognitive decline may result in the different ROM between prevalent and incident dementia. Rate of cognitive decline was strongly associated with the ROM in AD patients [42]. Because the participants who developed dementia within 2 years were classified as incident dementia in the present study, they might have faster cognitive decline than those with prevalent dementia. There are risk factors that increased both dementia and mortality risks. Smoking increased risk of incident AD and vascular dementia [43], and it also elevated ROM from all cause, cardiovascular disease and cancer [44]. Medical illnesses such as cardiovascular disease and diabetes increased the risk of conversion from MCI to dementia [45] as well as the ROM [46]. Depression is closely related with the development of dementia [47], and high levels of depressive symptoms were risk factor for mortality in the elderly [48]. However, these factors were adjusted in our Cox proportional hazard model. Physicians may need to inform the caregivers or family members of the people with newly incident dementia that the patients may not be able to manage pre-existing chronic disease as properly as before.
This study showed that the ROM of MCI was not susceptible to length bias; the HR of mortality of both incident and prevalent MCI cases was about 2. Only 1 other study reported the ROM in both incident and prevalent MCI cases. In that study, the HR of mortality was also about 2, in both prevalent and incident MCI cases [22].
This study found that newly incident dementia patients were high risk group for mortality, and their ROM was higher than those with dementia for a certain period of time.
This study has several strengths worth mentioning. This study was conducted on a large, randomly sampled, nationwide elderly population, and mortality was identified by the National Mortality Database, which provides reliable information on mortality and encompasses 100% of the Korean population. Therefore, the results of this study could be generalizable to the Korean elderly population. In addition, all the participants were evaluated by geropsychiatrists, who were experts in dementia research, using structured and standardized clinical and neuropsychological evaluations. Potential confounding factors were rigorously adjusted in the Cox proportional hazard models. However, there are limitations in this study. First, some information such as chronic illness was obtained by self-report of participant and/or informants. Therefore, this information might not be accurate, and some participants might not recognize their disease. Second, although we adjusted potential confounding factors in analysis, there might be other confounding factors that affect the association between dementia and mortality. Third, we did not adjust for the influence of apolipoprotein E genotype because this was assessed in only some of the participants. Fourth, this study did not compare the causes of death between the diagnostic groups. Fifth, the total duration of follow-up was too short to estimate the disease-specific median survivals. The median survival time after dementia onset ranged from 3.1 to 5.9 years, in other studies [13-17].
The ROM due to dementia may be much higher than previously expected. Considering that dementia is often omitted as an underlying cause of death, on death certificates [14], the number of deaths attributable to dementia may be much higher than that reported on death certificates. In clinical settings, the ROM warrants the attention of physicians, particularly in recently incident dementia cases.
Acknowledgements
This study was supported by a grant from the Korean Health Technology R&D Project, Ministry for Health, Welfare, and Family Affairs, Republic of Korea [grant number HI09C1379 (A092077)].
References
- [1].Sagare A, Deane R, Bell RD, Johnson B, Hamm K, Pendu R, et al. (2007). Clearance of amyloid-beta by circulating lipoprotein receptors. Nat Med, 13:1029-1031. [DOI] [PMC free article] [PubMed] [Google Scholar]
- [2].Scarmeas N, Luchsinger JA, Mayeux R, Stern Y (2007). Mediterranean diet and Alzheimer disease mortality. Neurology, 69:1084-1093. [DOI] [PMC free article] [PubMed] [Google Scholar]
- [3].Nitrini R, Caramelli P, Herrera E Jr., de Castro I, Bahia VS, Anghinah R, et al. (2005). Mortality from dementia in a community-dwelling Brazilian population. Int J Geriatr Psychiatry, 20:247-253. [DOI] [PubMed] [Google Scholar]
- [4].Tschanz J, Corcoran C, Skoog I, Khachaturian A, Herrick J, Hayden K, et al. (2004). Dementia: The leading predictor of death in a defined elderly population The Cache County Study. Neurology, 62:1156-1162. [DOI] [PubMed] [Google Scholar]
- [5].Baldereschi M, Carlo AD, Maggi S, Grigoletto F, Scarlato G, Amaducci L, et al. (1999). Dementia is a major predictor of death among the Italian elderly. Neurology, 52:709-709. [DOI] [PubMed] [Google Scholar]
- [6].Wilson RS, Aggarwal NT, Barnes LL, Bienias JL, de Leon CFM, Evans DA (2009). Biracial population study of mortality in mild cognitive impairment and Alzheimer disease. Arch Neurol, 66:767-772. [DOI] [PMC free article] [PubMed] [Google Scholar]
- [7].Aevarsson Ó, Svanborg A, Skoog I (1998). Seven-year survival rate after age 85 years: relation to Alzheimer disease and vascular dementia. Arch Neurol, 55:1226-1232. [DOI] [PubMed] [Google Scholar]
- [8].Noale M, Maggi S, Minicuci N, Marzari C, Destro C, Farchi G, et al. (2003). Dementia and disability: Impact on mortality. Dement Geriatr Cogn Disord, 16:7-14. [DOI] [PubMed] [Google Scholar]
- [9].Wu X, Tang Z, Fang X, Guan S, Liu H, Diao L, et al. (2011). A cohort study on mortality and risk of death among population diagnosis as dementia, at base-line survey, in Beijing. Zhonghua Liu Xing Bing Xue Za Zhi, 32:973-977. [PubMed] [Google Scholar]
- [10].Park JE, Lee JY, Suh GH, Kim BS, Cho MJ (2014). Mortality rates and predictors in community-dwelling elderly individuals with cognitive impairment: an eight-year follow-up after initial assessment. Int Psychogeriatr, 26:1295-1304. [DOI] [PubMed] [Google Scholar]
- [11].Paddick SM, Kisoli A, Dotchin CL, Gray WK, Chaote P, Longdon A, et al. (2015). Mortality rates in community-dwelling Tanzanians with dementia and mild cognitive impairment: a 4-year follow-up study. Age Ageing, 44:636-641. [DOI] [PubMed] [Google Scholar]
- [12].Chen R, Hu Z, Wei L, Wilson K (2014). Socioeconomic status and survival among older adults with dementia and depression. Br J Psychiatry, 204:436-440. [DOI] [PubMed] [Google Scholar]
- [13].Helmer C, Joly P, Letenneur L, Commenges D, Dartigues J (2001). Mortality with dementia: results from a French prospective community-based cohort. Am J Epidemiol, 154:642-648. [DOI] [PubMed] [Google Scholar]
- [14].James BD, Leurgans SE, Hebert LE, Scherr PA, Yaffe K, Bennett DA (2014). Contribution of Alzheimer disease to mortality in the United States. Neurology, 82:1045-1050. [DOI] [PMC free article] [PubMed] [Google Scholar]
- [15].Ganguli M, Dodge HH, Shen C, Pandav RS, DeKosky ST (2005). Alzheimer disease and mortality: a 15-year epidemiological study. Arch Neurol, 62:779-784. [DOI] [PubMed] [Google Scholar]
- [16].Guhne U, Matschinger H, Angermeyer MC, Riedel-Heller SG (2006). Incident dementia cases and mortality. Results of the leipzig Longitudinal Study of the Aged (LEILA75+). Dement Geriatr Cogn Disord, 22:185-193. [DOI] [PubMed] [Google Scholar]
- [17].Agüero-Torres H, Fratiglioni L, Guo Z, Viitanen M, Winblad B (1999). Mortality from dementia in advanced age: a 5-year follow-up study of incident dementia cases. J Clin Epidemiol, 52:737-743. [DOI] [PubMed] [Google Scholar]
- [18].Fitzpatrick AL, Kuller LH, Lopez OL, Kawas CH, Jagust W (2005). Survival following dementia onset: Alzheimer’s disease and vascular dementia. J Neurol Sci, 229-230:43-49. [DOI] [PubMed] [Google Scholar]
- [19].Llin, agrave, s-Regla J, oacute, pez-Pousa S, Vilalta-Franch J, et al. (2008). Mortality after a Diagnosis of Dementia in a Population Aged 75 and Over in Spain. Neuroepidemiology, 31:80-88. [DOI] [PubMed] [Google Scholar]
- [20].Villarejo A, Benito-Leon J, Trincado R, Posada IJ, Puertas-Martin V, Boix R, et al. (2011). Dementia-associated mortality at thirteen years in the NEDICES Cohort Study. J Alzheimers Dis, 26:543-551. [DOI] [PubMed] [Google Scholar]
- [21].Fisk JD, Merry HR, Rockwood K (2003). Variations in case definition affect prevalence but not outcomes of mild cognitive impairment. Neurology, 61:1179-1184. [DOI] [PubMed] [Google Scholar]
- [22].Vassilaki M, Cha RH, Geda YE, Mielke MM, Knopman DS, Petersen RC, et al. (2015). Mortality in mild cognitive impairment varies by subtype, sex, and lifestyle factors: the mayo clinic study of aging. J Alzheimers Dis, 45:1237-1245. [DOI] [PMC free article] [PubMed] [Google Scholar]
- [23].Santabarbara J, Gracia-Garcia P, Pirez G, Lopez-Anton R, De La Camara C, Ventura T, et al. (2016). Mortality in Mild Cognitive Impairment Diagnosed with DSM-5 Criteria and with Petersen’s Criteria: A 17-Year Follow-Up in a Community Study. Am J Geriatr Psychiatry, 24:977-986. [DOI] [PubMed] [Google Scholar]
- [24].Helzner E, Scarmeas N, Cosentino S, Tang M, Schupf N, Stern Y (2008). Survival in Alzheimer disease A multiethnic, population-based study of incident cases. Neurology, 71:1489-1495. [DOI] [PMC free article] [PubMed] [Google Scholar]
- [25].Applebaum KM, Malloy EJ, Eisen EA (2011). Left truncation, susceptibility, and bias in occupational cohort studies. Epidemiology, 22:599-606. [DOI] [PMC free article] [PubMed] [Google Scholar]
- [26].Delgado-Rodriguez M, Llorca J (2004). Bias. J Epidemiol Community Health, 58:635-641. [DOI] [PMC free article] [PubMed] [Google Scholar]
- [27].Wolfson C, Wolfson DB, Asgharian M, M’Lan CE, Østbye T, Rockwood K, et al. (2001). A Reevaluation of the Duration of Survival after the Onset of Dementia. N Engl J Med, 344:1111-1116. [DOI] [PubMed] [Google Scholar]
- [28].Little DM, Crooks VC, Petitti DB, Chiu V, Schellenberg GD, Slezak JM, et al. (2009). Mortality, dementia, and apolipoprotein E genotype in elderly white women in the United States. J Am Geriatr Soc, 57:231-236. [DOI] [PubMed] [Google Scholar]
- [29].Guehne U, Luck T, Busse A, Angermeyer MC, Riedel-Heller SG (2007). Mortality in individuals with mild cognitive impairment. Results of the Leipzig Longitudinal Study of the Aged (LEILA75+). Neuroepidemiology, 29:226-234. [DOI] [PubMed] [Google Scholar]
- [30].Yaffe K, Petersen RC, Lindquist K, Kramer J, Miller B (2006). Subtype of mild cognitive impairment and progression to dementia and death. Dement Geriatr Cogn Disord, 22:312-319. [DOI] [PubMed] [Google Scholar]
- [31].Agüero-Torres H, Fratiglioni L, Guo Z, Viitanen M, Winblad B (1998). Prognostic factors in very old demented adults: a seven-year follow-up from a population-based survey in Stockholm. J Am Geriatr Soc, 46:444-452. [DOI] [PubMed] [Google Scholar]
- [32].Kim TH, Park JH, Lee JJ, Jhoo JH, Kim B-J, Kim J-L, et al. (2013). Overview of the Korean Longitudinal Study on Cognitive Aging and Dementia. Alzheimers Dement, 9:P626-P627. [Google Scholar]
- [33].Yoo S-W, Kim Y-S, Noh J-S, Oh K-S, Kim C-H, NamKoong K, et al. (2006). Validity of Korean version of the mini-international neuropsychiatric interview. Anxiety Mood, 2. [Google Scholar]
- [34].Fortin M, Bravo G, Hudon C, Vanasse A, Lapointe L (2005). Prevalence of multimorbidity among adults seen in family practice. Ann Fam Med, 3:223-228. [DOI] [PMC free article] [PubMed] [Google Scholar]
- [35].Rosen WG, Terry RD, Fuld PA, Katzman R, Peck A (1980). Pathological verification of ischemic score in differentiation of dementias. Ann Neurol, 7:486-488. [DOI] [PubMed] [Google Scholar]
- [36].American Psychiatric Association A, Association AP (1994). Diagnostic and statistical manual of mental disorders. [Google Scholar]
- [37].McKhann G, Drachman D, Folstein M, Katzman R, Price D, Stadlan EM (1984). Clinical diagnosis of Alzheimer’s disease Report of the NINCDS-ADRDA Work Group* under the auspices of Department of Health and Human Services Task Force on Alzheimer’s Disease. Neurology, 34:939-939. [DOI] [PubMed] [Google Scholar]
- [38].Petersen RC (2004). Mild cognitive impairment as a diagnostic entity. J Intern Med, 256:183-194. [DOI] [PubMed] [Google Scholar]
- [39].Lacor PN, Buniel MC, Chang L, Fernandez SJ, Gong Y, Viola KL, et al. (2004). Synaptic targeting by Alzheimer’s-related amyloid β oligomers. J Neurosci, 24:10191-10200. [DOI] [PMC free article] [PubMed] [Google Scholar]
- [40].2012. Is increasing private expenditure, especially in tertiary education, associated with less public funding and less equitable access? In Education Indicators in Focus: OECD. 1-4. [Google Scholar]
- [41].Staekenborg SS, Pijnenburg YA, Lemstra AW, Scheltens P, Vd Flier WM (2016). Dementia and Rapid Mortality: Who is at Risk? J Alzheimers Dis, 53:135-142. [DOI] [PubMed] [Google Scholar]
- [42].Hui J, Wilson R, Bennett D, Bienias J, Gilley D, Evans D (2003). Rate of cognitive decline and mortality in Alzheimer’s disease. Neurology, 61:1356-1361. [DOI] [PubMed] [Google Scholar]
- [43].Anstey KJ, von Sanden C, Salim A, O’kearney R (2007). Smoking as a risk factor for dementia and cognitive decline: a meta-analysis of prospective studies. Am J Epidemiol, 166:367-378. [DOI] [PubMed] [Google Scholar]
- [44].Jacobs DR, Adachi H, Mulder I, Kromhout D, Menotti A, Nissinen A, et al. (1999). Cigarette smoking and mortality risk: twenty-five-year follow-up of the seven countries study. Arch Intern Med, 159:733-740. [DOI] [PubMed] [Google Scholar]
- [45].Velayudhan L, Poppe M, Archer N, Proitsi P, Brown RG, Lovestone S (2010). Risk of developing dementia in people with diabetes and mild cognitive impairment. Br J Psychiatry, 196:36-40. [DOI] [PubMed] [Google Scholar]
- [46].Feil D, Marmon T, Unützer J (2003). Cognitive Impairment, Chronic Medical Illness, and Risk of Mortality in an Elderly Cohort. Am J Geriatr Psychiatry, 11:551-560. [PubMed] [Google Scholar]
- [47].Byers AL, Yaffe K (2011). Depression and risk of developing dementia. Nat Rev Neurol, 7:323-331. [DOI] [PMC free article] [PubMed] [Google Scholar]
- [48].Schulz R, Beach SR, Ives DG, Martire LM, Ariyo AA, Kop WJ (2000). Association between depression and mortality in older adults: the Cardiovascular Health Study. Arch Intern Med, 160:1761-1768. [DOI] [PubMed] [Google Scholar]