Abstract
Regulatory T cells (Treg cells), a distinct subset of CD4+ T cells, are necessary for the maintenance of immune self-tolerance and homeostasis1,2. Recent studies have demonstrated that Treg cells exhibit a unique metabolic profile characterized by an increase in mitochondrial metabolism relative to other CD4+ effector subsets3,4. Furthermore, the Treg cell lineage-defining transcription factor, Foxp3, has been shown to promote respiration5,6; however, it remains unknown whether the mitochondrial respiratory chain is required for Treg cell suppressive capacity, stability, and survival. Here we report that Treg cell-specific ablation of mitochondrial respiratory chain complex III results in the development of a fatal inflammatory disease early in life, without impacting Treg cell number. Mice lacking mitochondrial complex III specifically in Treg cells displayed a loss of Treg cell suppressive capacity without altering Treg cell proliferation and survival. Treg cells deficient in complex III had decreased expression of genes associated with Treg function while maintaining stable Foxp3 expression. Loss of complex III in Treg cells increased DNA methylation as well as the metabolites 2-hydroxyglutarate (2-HG) and succinate that inhibit the ten-eleven translocation (TET) family of DNA demethylases7. Thus, Treg cells require mitochondrial complex III to maintain immune regulatory gene expression and suppressive function.
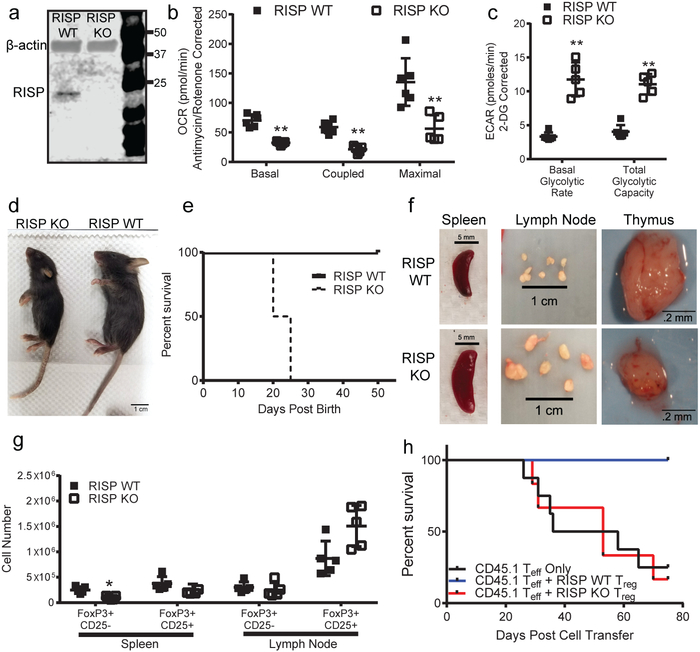
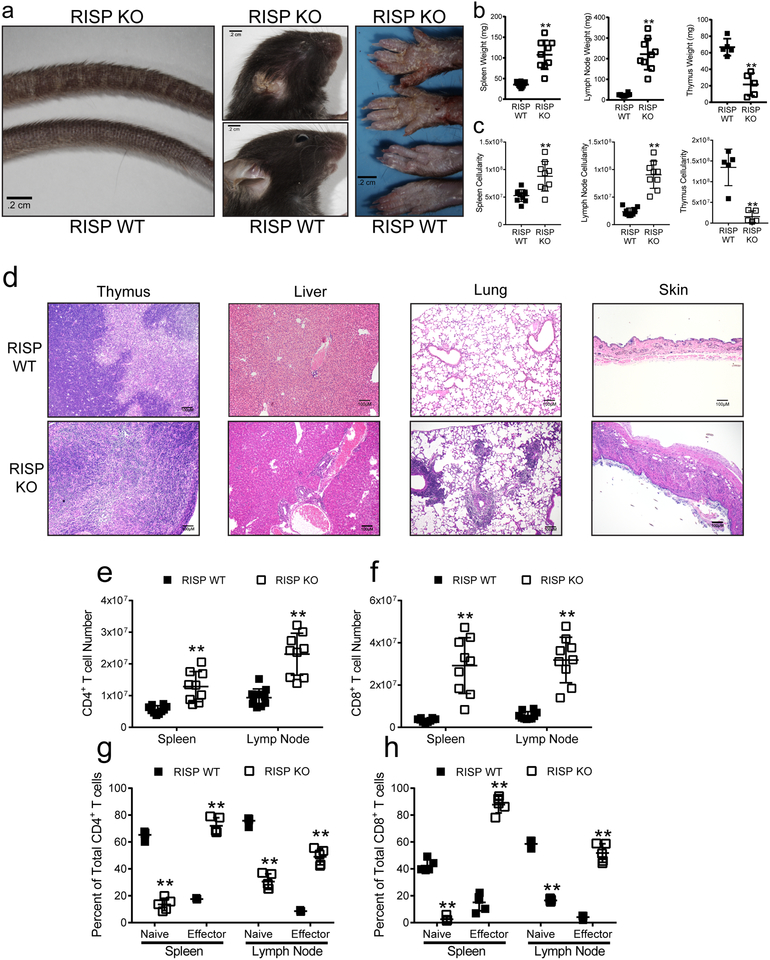
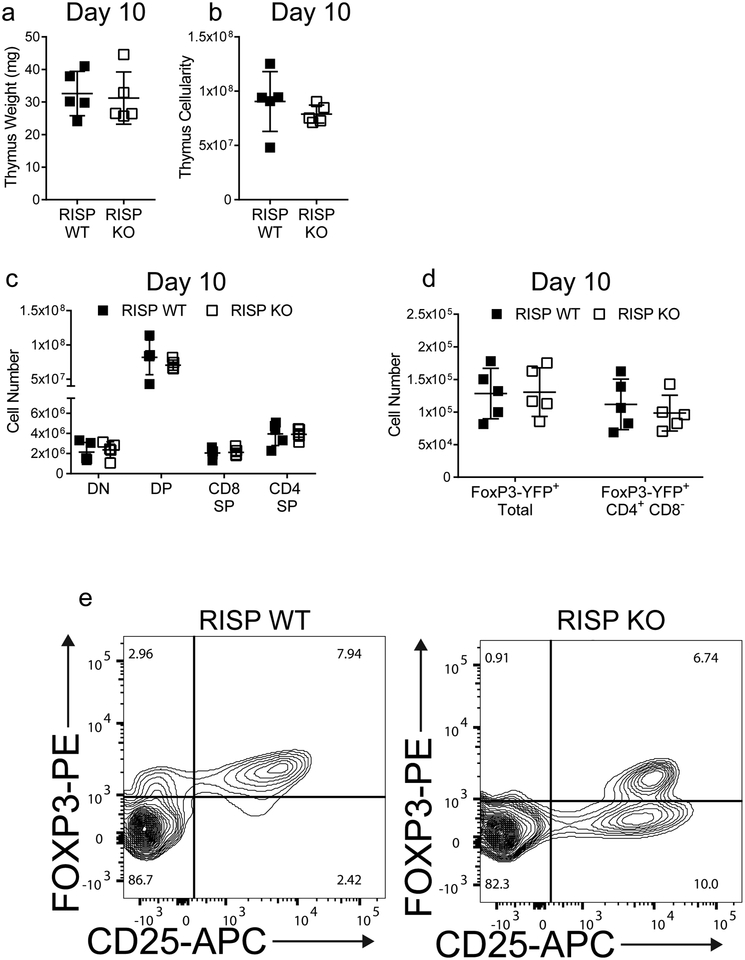
To test whether the mitochondrial respiratory chain complex III is necessary for Treg cell survival, proliferation, or function, we crossed animals harboring a loxP-flanked Uqcsrf1 gene, which encodes the Rieske iron-sulfur protein (RISP), an essential subunit of mitochondrial complex III8, with Foxp3YFP-Cre mice9 to generate animals specifically lacking RISP in Treg cells (RISP KO). Efficient loss of RISP in Treg cells was confirmed by immunoblot (Fig. 1a, For gel source data, see Supplementary Figure 1), accompanied by diminished oxygen consumption rate (OCR) with concomitant increase in glycolytic flux (ECAR) (Fig. 1b,c). RISP KO mice did not survive past the fourth week of life and exhibited signs of significant inflammation by 3 weeks of age including thymic atrophy, enlargement of lymph nodes and spleens along with lymphocytic infiltration into multiple organs (Figure 1d–f, Extended Data Fig. 1a–d). Moreover, RISP KO mice displayed substantial increases in activated CD4+ and CD8+ T cells in the lymph nodes and spleen (Extended Data Fig. 1e–h). RISP KO mice at 10 days post-natal did not display any inflammatory changes or thymic atrophy (Extended Data Fig. 2a–d). Overall, the phenotype exhibited by RISP KO animals is reminiscent of mice completely deficient in Treg cells10–12; however, the number of CD4+ Foxp3+ CD25+ cells was unchanged in the spleen and modestly elevated in the lymph nodes in RISP KO animals (Fig. 1g, Extended Data Fig. 2e).
Figure 1: Loss of complex III in Treg cells results in a lethal inflammatory disorder and loss of Treg cell suppressive function.
a, RISP and β-actin protein expression in CD4+ Foxp3-YFP+ CD25+ cells isolated from 3-week-old RISP WT and RISP KO mice. b,c, (b) Oxygen consumption rate (OCR) and (c) extracellular acidification rate (ECAR) of CD4+ Foxp3-YFP+ CD25+ cells isolated from 3-week old RISP WT (n=6) and RISP KO mice (n=5). d, Representative image of 3-week-old RISP WT and RISP KO mice. e, Survival of RISP WT (n=8) and RISP KO (n=11) animals (p=.0009 using one-sided log-rank test). f, Representative images of spleens, lymph nodes, and thymuses from 3-week-old animals. g, Number of Treg cells in the spleen and lymph nodes in 3-week-old RISP KO (n=5) and RISP WT (n=5) mice. h, Survival of Rag1-deficient mice following adoptive transfer of CD4+ CD45rbhi CD25− cells (Teff) alone (n=8) or with CD4+ Foxp3-YFP+ CD25+ cells isolated from 3-week-old RISP WT (n=6) and RISP KO mice (n=6). Animals were removed from the experiment after losing 20% of their pre-transfer body weights (p=.0156 using one-sided log-rank test). Images are representative of at least three mice harvested on independent days. Data (b,c,g) represent mean ± SD and were analyzed with multiple two-tailed t-tests using a two-stage linear step-up procedure of Benjamini, Krieger and Yekutieli, with Q = 1% unless otherwise stated. Each cell type was analyzed individually, without assuming a consistent SD (*Q<.01, **Q<.001, specific q-values displayed in supplemental source data). All data points on graphs represent individual animals isolated and analyzed on at least 2 separate days.
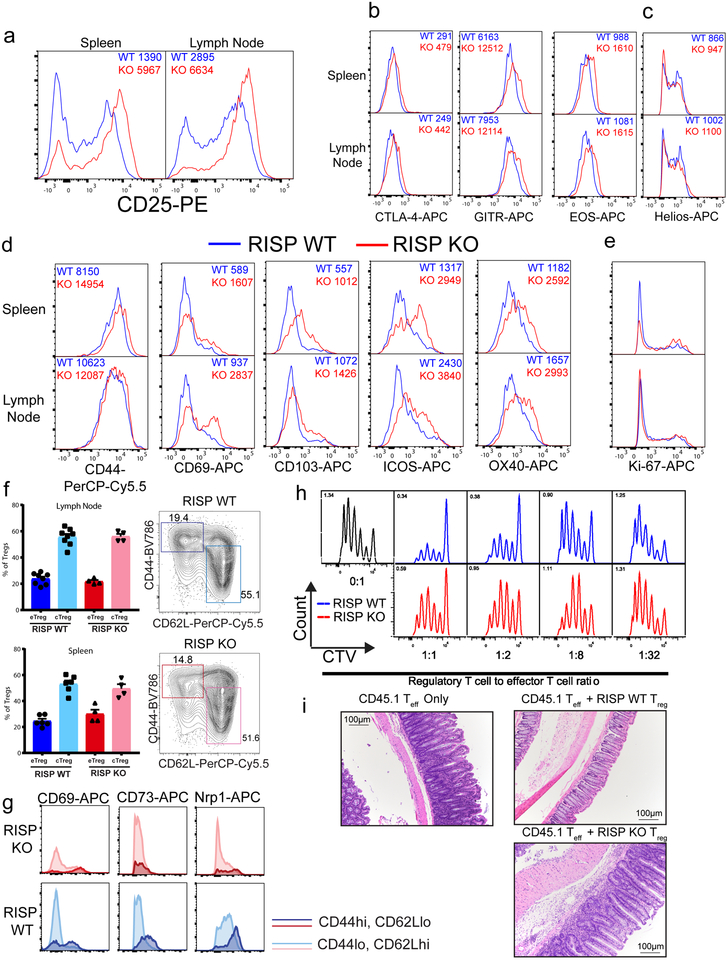
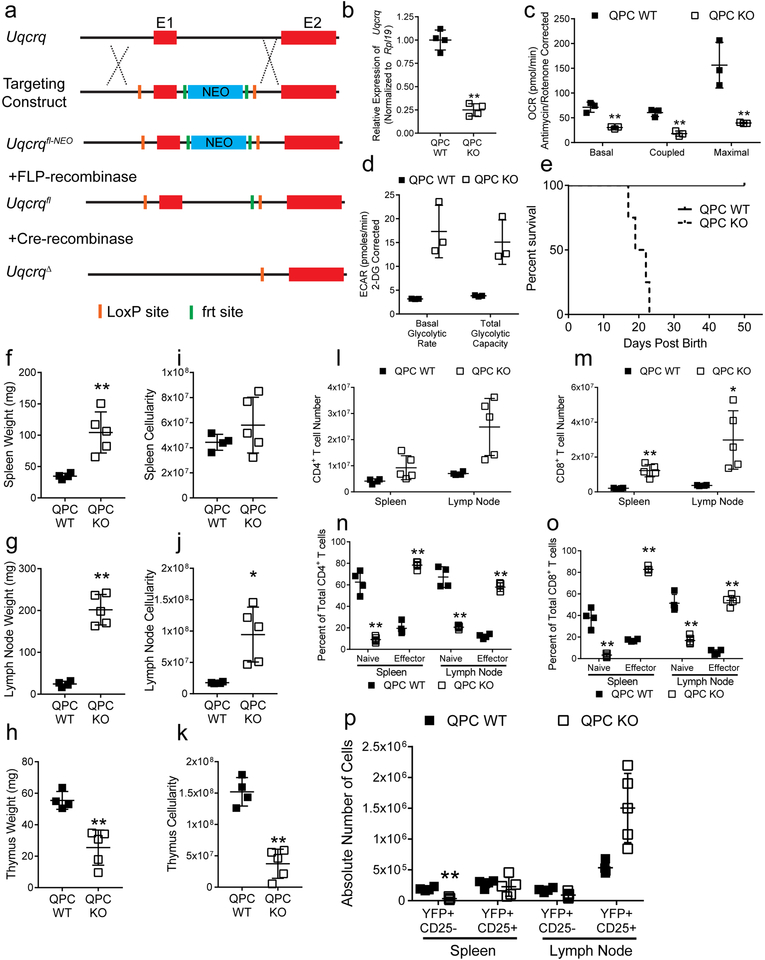
RISP KO animals had fewer CD25lo Treg cells, while CD25 expression was elevated on RISP KO CD25+ Foxp3+ cells compared to wild-type cells (Fig. 1g, Extended Data Fig. 2e, 3a). Expression of additional hallmark Treg cell markers, CTLA-4, GITR, and EOS were also increased in RISP-deficient Treg cells relative to wild-type cells while HELIOS expression was unchanged (Extended Data Fig. 3b,c). Furthermore, Treg cells deficient in RISP displayed increased surface expression of activation markers and similar rates of proliferation, by Ki-67 staining, relative to wild-type cells (Extended Data Fig. 3d,e) and had similar percentages of central and effector Treg cells (Extended Data Fig. 3f,g). Interestingly, Treg cells from RISP KO animals had significantly reduced suppressive capacity in vivo and in vitro compared to wild-type cells (Fig. 1h, Extended Data Fig. 3h,i). To further corroborate these results, we crossed animals harboring a floxed Uqcrq gene (encodes for QPC protein, Extended Data Fig. 4a), another subunit of complex III, to the Foxp3YFP-Cre animals. As with Treg cell specific loss of RISP, loss of QPC in Treg cells diminishes OCR and increases ECAR, and results in premature death of the mouse but maintains Treg cell numbers (Extended Data Fig. 4b-p).
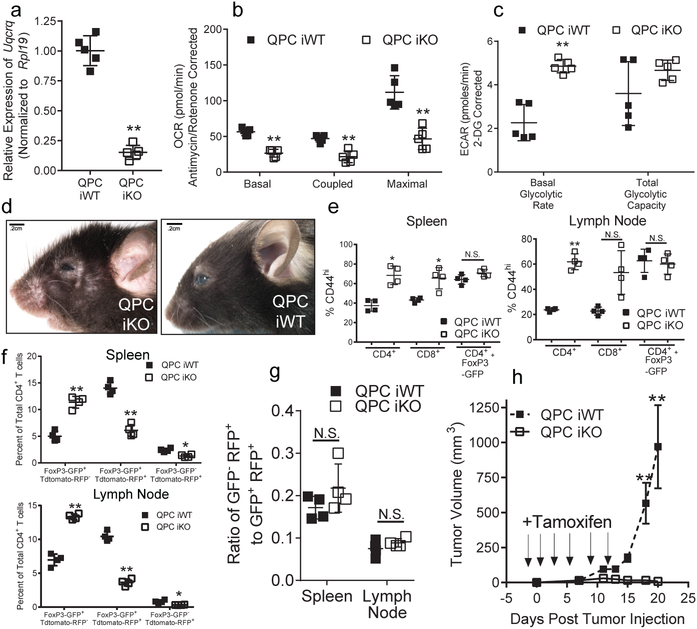
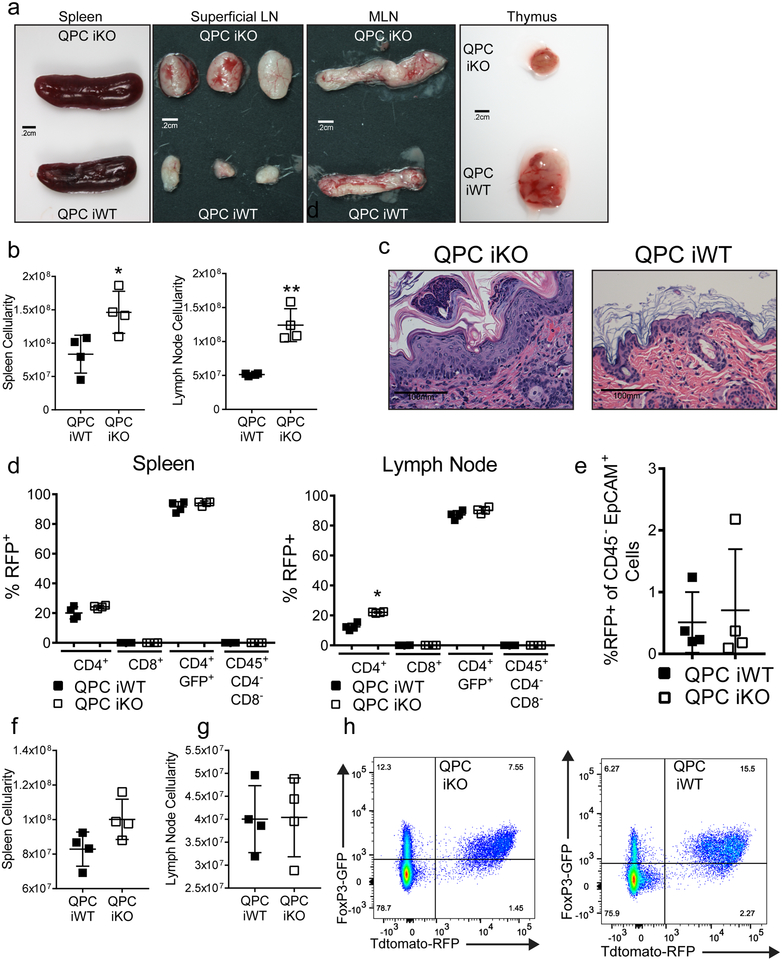
To further examine whether loss of complex III after development impairs Treg cell function, we generated mice harboring the Uqcrq floxed, Foxp3GFP-CreERT2, and ROSA26SorCAG-tdTomato alleles (QPC iKO). In these animals, GFP marks cells actively expressing Foxp3 while tdtomato-RFP identifies cells which have undergone cre-recombinase-mediated loss of Uqcrq. Six weeks after 8-week-old mice where treated with 3 doses of tamoxifen, Treg cells exhibited diminished levels of QPC mRNA and OCR concomitant with an increase in ECAR (Fig. 2a–c). Furthermore, upon continuous tamoxifen treatment these animals developed signs of systemic inflammation and significant elevations in activated CD4+ and CD8+ T cells within 28 days (Fig. 2d,e; Extended Data Fig. 5a–d). RFP expression was observed in Treg cells, but not in other immune cell types or thymic epithelial cells, suggesting that a loss of Treg cell suppressive function drives the observed inflammatory changes (Extended Data Fig. 5e,f).
Figure 2: Loss of complex III in Treg cells impairs suppressive function without altering Foxp3 expression.
a-c, Uqcrq mRNA expression (a), OCR (b) and ECAR (c) of CD4+ Foxp3-GFP+ TdTomato-RFP+ cells isolated from QPC iKO (n=5) and QPC iWT (n=5) mice 6-weeks after 3 doses of tamoxifen. d, Representative images of QPC iKO animals compared to QPC iWT treated with tamoxifen for 28 days. e, Percentage of CD4+, CD8+, and CD4+ Foxp3-GFP+ in the spleen and lymph nodes expressing high levels of CD44 from QPC iWT (n=4) and QPC iKO (n=4) mice treated with tamoxifen. f, Percentage of post-tamoxifen generated (Foxp3-GFP+ tdTomato-RFP−) Treg cells, pre-tamoxifen generated stable (Foxp3-GFP+ tdTomato-RFP+) Treg cells, and previously expressing Foxp3+ (Foxp3-GFP− tdTomato-RFP+) T cells of the total CD4+ T cell compartment from QPC iWT (n=4) and iKO (n=4) mice 3 months after 3 doses of tamoxifen. g, Ratio of Foxp3-GFP− tdTomato-RFP+ to Foxp3-GFP+ tdTomato-RFP+ cells from QPC iWT (n=4) and QPC iKO (n=4) mice 3 months after tamoxifen. h, Growth of B16 melanoma cells in QPC iWT and QPC iKO mice (n=10 for both groups). Tamoxifen was administered on day −1, 1, 3, 6, 9, and 12 post tumor injection. Images are representative of at least three mice collected on 3 different days. Data represent mean ± SD and were analyzed with (a) two-tailed t-test (** P˂.001, specific p-values displayed in supplemental source data), with (b,c,e-g) multiple two-tailed t-tests using a two-stage linear step-up procedure of Benjamini, Krieger and Yekutieli, with Q = 1%. Each cell type was analyzed individually, without assuming a consistent SD (*Q<.01, **Q<.001, specific q-values displayed in supplemental source data) Data in panel h was analyzed with two-way ANOVA with a Turkey test for multiple comparisons (** Adj-p˂.0001, specific p-values displayed in supplemental source data). All data points on graphs represent individual animals isolated and analyzed on at least 2 separate days
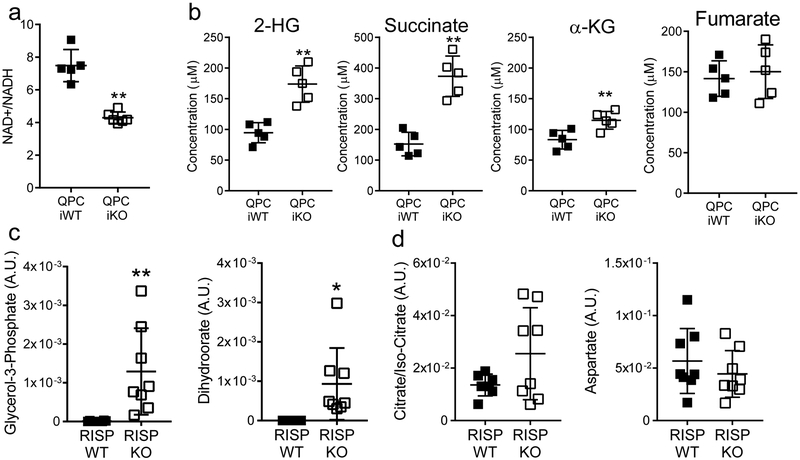
To determine if loss of Foxp3 expression was driving the pathology observed in these mice, we administered adult mice 3 doses of tamoxifen and assessed for tdtomato-RFP+ and Foxp3-GFP+ co-expression 12 weeks later. QPC iKO animals displayed no alteration in spleen and lymph node cellularity after 3 months (Extended Data Fig. 5g,h). However, QPC iKO mice did have a decrease in the percentage of GFP+RFP+ cells with a concurrent increase in the GFP+RFP− cells suggesting QPC iKO animals produce more new Treg cells after the discontinuation of tamoxifen relative to WT animals (Fig. 2f, Extended Data Fig. 5i). Importantly, the ratio of GFP−RFP+ cells to GFP+RFP+ cells was unchanged in the iKO animals demonstrating that the stability of Foxp3 expression was not altered by loss of complex III (Fig. 2g). Next, we examined the suppressive function of QPC-null Treg cells in the context of tumor immunity. B16 melanoma cells were able to generate tumors in WT mice following tamoxifen treatment, but not in mice that harbor Treg cells deficient in QPC (Fig. 2h). Collectively, these data demonstrate that complex III function is necessary for Treg cell suppressive function independent of Foxp3.
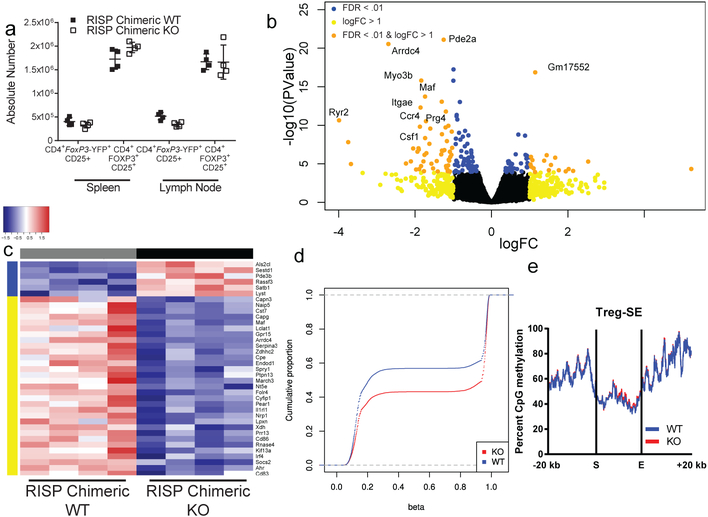
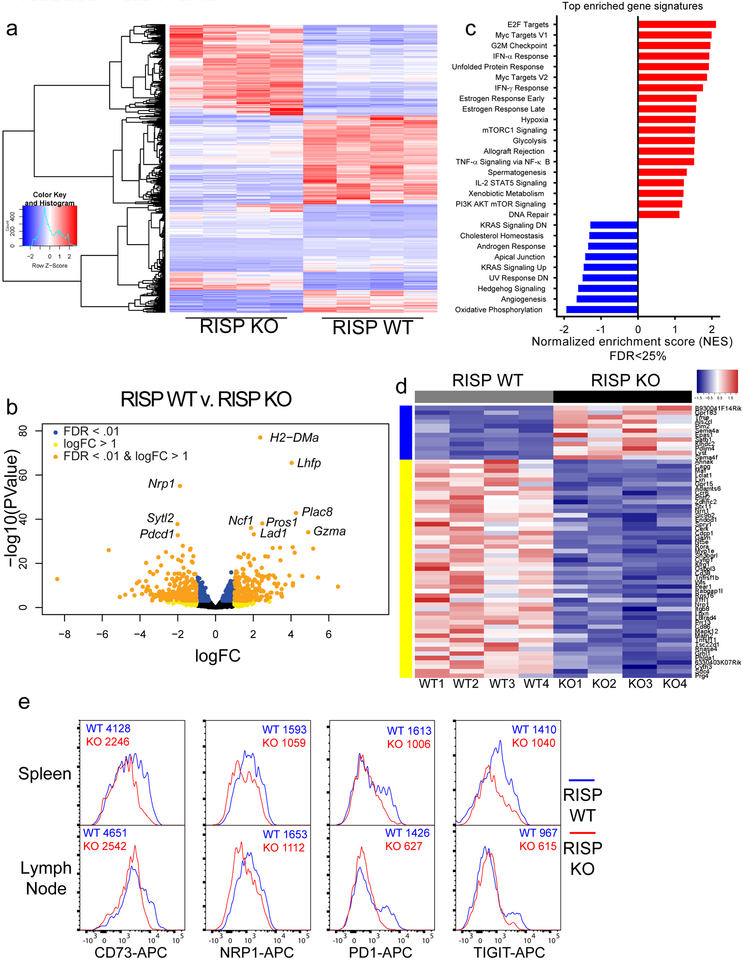
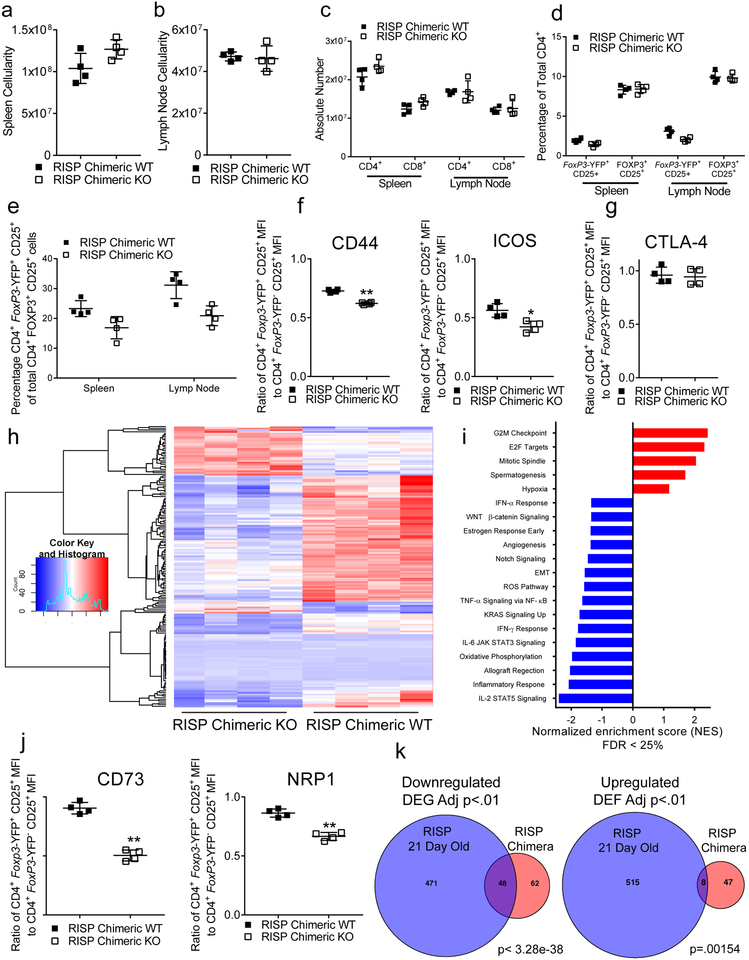
To investigate mechanisms of impaired suppressive function in complex III-deficient Treg cells, we performed transcriptional profiling of CD4+ Foxp3-YFP+ CD25+ cells isolated from RISP KO and WT mice. We observed extensive alterations in gene expression due to loss of RISP in Treg cells (Extended Data Fig. 6a–c). Importantly, numerous genes including Nrp113, Pdcd1 (encodes PD-1)14, Nt5e (encodes CD73)15, Tigit16 and Flg217 were significantly reduced (Adj. p<1 × 10⁻⁷) in Treg cells lacking RISP (Extended Data Fig. 6d). Surface expression of Nrp1, PD-1, CD73 and Tigit was reduced on Treg cells lacking RISP relative to wild-type cells and occurred independently of changes in activation status (Extended Data Fig. 6e, Extended Data Fig. 3g). To verify that these changes in gene expression were a cell autonomous effect of complex III deficiency and not a secondary consequence of the profound inflammation observed in RISP KO mice, we generated chimeric animals by producing female mice that were homozygous for the floxed Uqcrsf1 allele and heterozygous for Foxp3YFP-Cre (RISP chimeric KO, YFP marks cells with active cre-recombinase). Following random inactivation of the X-chromosome in these mice, the Treg cell compartment contains a mix of RISP-sufficient Foxp3-YFP− and RISP-deficient Foxp3-YFP+ cells. RISP chimeric KO mice display no obvious inflammatory phenotype and had normal spleen and lymph node cellularity (Extended Data Fig. 7a,b). In addition, the number of CD4+, CD8+, Foxp3-YFP+ Treg cells, and Foxp3-YFP− Treg cells was unchanged in RISP chimeric KO relative to RISP wild-type chimeric animals (Fig. 3a; Extended Data Fig. 7c,d). However, the ratio of Foxp3-YFP+ to Foxp3-YFP− Treg cells and the ratio of expression of activation markers CD44 and ICOS on these cells were decreased in RISP chimeric KO mice compared to RISP chimeric WT suggesting that RISP KO Treg cells may be outcompeted by wild-type Treg cells in vivo (Extended Data Fig. 7e,f). Interestingly, the expression of CTLA-4 was unchanged between the knockout and wild-type cells in RISP chimeric KO and RISP chimeric WT mice (Extended Data Fig. 7g). RNA sequencing revealed changes in gene expression due to loss of RISP in the chimeric mice including genes associated with Treg cells (Fig. 3b,c; Extended Data Fig. 7h–j). Importantly, only a subset of downregulated genes in RISP deficient Treg cells isolated from chimeric mice overlapped with the RISP KO Treg cells demonstrating that the decreased expression of these particular genes is a cell autonomous effect due to loss of mitochondrial complex III, independent of host inflammatory conditions (Extended Data Fig. 7k).
Figure 3: Complex III deficiency in Treg cells results in a cell autonomous impairment in expression of genes associated with Treg cell suppressive function along with DNA hypermethylation.
a, The absolute number of CD4+ Foxp3-YFP+ CD25+ (chimeric Treg cells) and CD4+ Foxp3+ CD25+ (total Treg cells) from adult RISP chimeric KO (n=4) and RISP chimeric WT (n=4) mice. b, Volcano plot showing differential gene expression in CD4+ Foxp3-YFP+ CD25+ cells isolated from adult RISP chimeric KO (n=4) and RISP chimeric WT (n=4) mice. c, Heat map of Treg cell signatures genes that are differentially expressed (adj. P<.01) in RISP chimeric KO (n=4) versus RISP chimeric WT (n=4) animals. d, Cumulative distribution function of 17,588 differentially methylated CpGs comparing chimeric Treg cells from RISP chimeric WT (n=4) and Treg-specific RISP-deficient chimeric KO (n=4) mice. Estimated CpG methylation is expressed as beta scores with 0 being unmethylated and 1 fully methylated. e, Metagene analysis of Treg cell-specific super-enhancer methylation from dataset in panel d. Data (a) represent mean ± SD and were analyzed with multiple two-tailed t-tests using a two-stage linear step-up procedure of Benjamini, Krieger and Yekutieli, with Q = 1%. Each cell type was analyzed individually, without assuming a consistent SD (Specific q-values displayed in supplemental source data). Data points on graphs represent individual animals isolated and analyzed on at least 2 separate days. Data in panels b-e are from one RNA sequencing (b,c) and one mRRBS (d,e) experiment respectively. CD4+ Foxp3-YFP+ CD25+ cells from RISP chimeric WT (n=4) and RISP chimeric KO (n=4) animals were isolated on different days. Further processing and sequencing was performed with all 8 samples together.
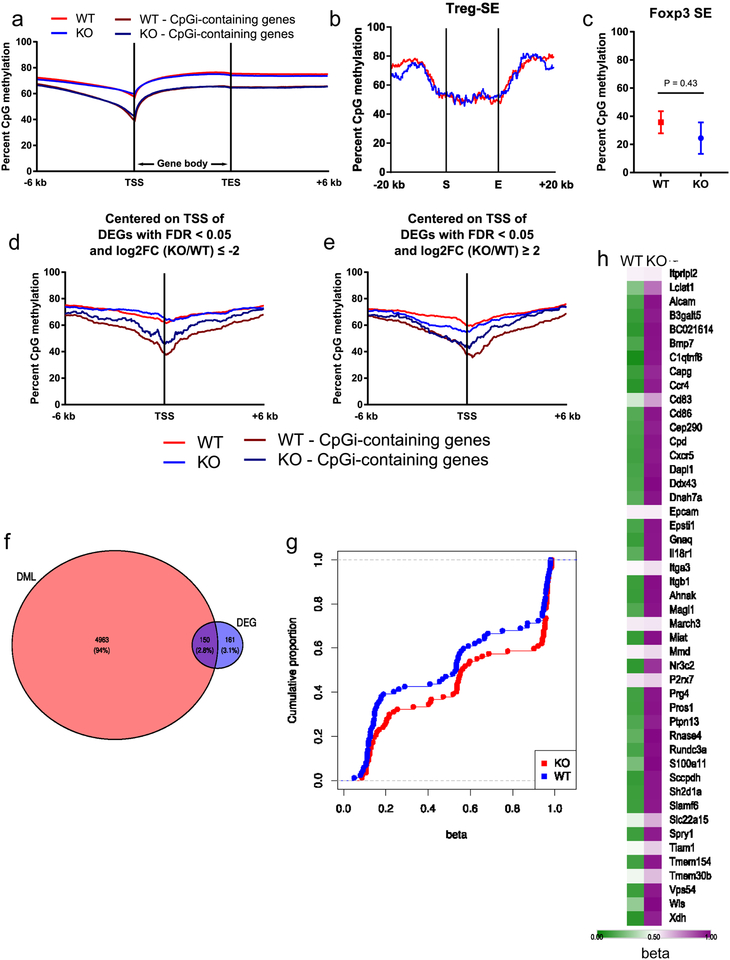
DNA methylation has been shown to critically influence Treg cell fate and function through Foxp3-dependent and -independent mechanisms18,19. Thus, to assess DNA methylation we performed modified reduced representation bisulfite sequencing (mRRBS)20 on CD25+ Treg cells from RISP KO and RISP WT mice. Globally, DNA methylation around gene loci was not altered in Treg cells deficient in RISP (Extended Fig. 8a). In addition, RISP KO Treg cells did not display a global change in CpG methylation at Treg-specific super-enhancers or at the Foxp3 locus super-enhancer specifically (Extended Data Fig. 8b,c)21. DNA methylation was mildly increased around the transcription start site (TSS) of genes determined to be differentially downregulated by RNA-seq (logFC≤2, FDR<.05), and further increased around differentially downregulated genes that contained CpG islands near their TSS (Extended Data Fig. 8d,e). Next, we examined DNA methylation in Treg cells isolated from RISP chimeric KO and WT mice. mRRBS and an unsupervised analysis identified 17,588 differentially methylated CpGs (DMCs); chimeric KO Treg cells were predominantly hypermethylated compared to chimeric WT Treg cells at these positions (Fig. 3d). Of the gene loci associated with DMCs, 150 loci were differentially expressed (Extended Data Fig. 8f). Treg-specific super-enhancer elements did not display differential methylation (Fig. 3e); however, chimeric RISP KO Treg cells showed hypermethylation at gene loci whose expression was down-regulated (Extended Data Fig. 8g). Extended data figure 8h shows the methylation status of gene loci hypermethylated in chimeric RISP KO Treg cells. Collectively, these data suggest that loss of mitochondrial complex III results in DNA hypermethylation and altered gene expression without affecting the methylation status of canonical Treg cell genes, including Foxp3.
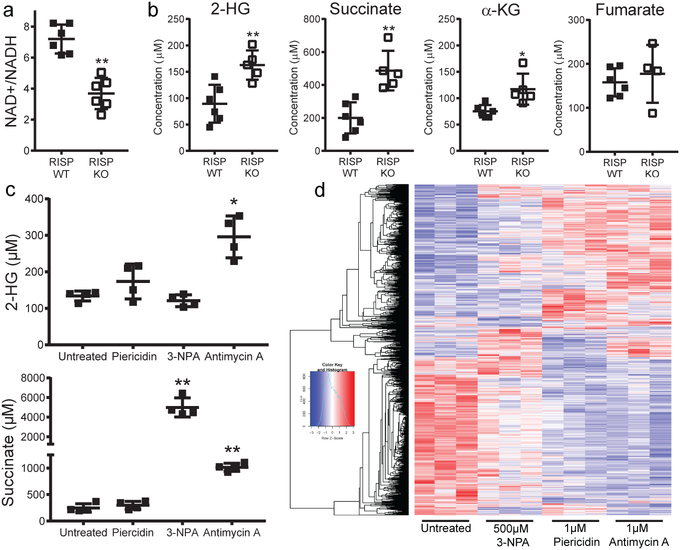
We have previously demonstrated that loss of mitochondrial complex III in cancer and hematopoietic stem cells results in elevated levels of 2-hydroxyglutarate (2-HG) and succinate22. IDH1 and IDH2 mutant cancer cells produce high levels of D(R)-2-HG, while normal cells produce L(S)-2-HG from promiscuous substrate usage of α-KG by lactate dehydrogenase or malate dehydrogenase under hypoxia, loss of VHL or mitochondrial electron transport chain inhibition due to a decrease in NAD+/NADH ratio23–26. Succinate and 2-HG function as antagonists of the α-KG-dependent dioxygenases including the TETs27,28. We examined metabolite levels in CD25+ Treg cells from RISP KO mice. NAD+/NADH ratio was decreased while succinate and 2-HG levels were significantly elevated in RISP and QPC KO Treg cells relative to wild-type cells (Fig. 4a,b; Extended Data Fig. 9a,b). The levels of dihydroorate and glycerol-3-phosphate were elevated in RISP KO cells consistent with a loss of complex III function (Extended Data Fig. 9c). Citrate and aspartate are necessary for de novo lipogenesis and nucleotides, respectively were unchanged consistent with the lack of a proliferation defect seen in RISP KO Treg cells (Extended Data Fig. 9d).
Figure 4: Inhibition of different electron transport chain complexes in regulatory T cells results in distinct alterations in metabolites and gene expression.
a, The ratio of NAD+/NADH in Treg cells isolated from 21-day-old RISP WT (n=6) or RISP KO (n=6) mice. b, Calculated intracellular concentration of 2-HG, succinate, α-KG, and fumarate in Treg cells isolated from 21-day-old RISP WT (n=6) or RISP KO (n=5, n=4 for fumarate) mice. c, Calculated intracellular concentration of 2-hydroxyglutarate (2-HG) and succinate in untreated Treg cells (n=4) or treated with 1μM Piericidin (n=4), 500μM 3-NPA (n=4), or 1μM antimycin A (n=4) for 24 hours in vitro. d, Hierarchical clustering showing changes in gene expression (adj-p<.01) in CD4+ Foxp3-YFP+ CD25+ cells treated with mitochondrial inhibitors for 24 hours. Data represent mean ± SD (a-c) and were analyzed with (a,b) two-tailed t-test (*p<.05 **p˂.01, respectively; specific p-values displayed in supplemental source data), with (c) 1-way ANOVA with Dunnett’s test for multiple comparisons (*adj-p<.05 **adj-p˂.01, respectively; specific p-values displayed in supplemental source data). All data points on graphs represent individual animals isolated and analyzed on at least 2 separate days. Data in panels d is from one RNA sequencing experiment. CD4+ Foxp3-YFP+ CD25+ cells from RISP WT (n=4) animals were isolated and treated with inhibitors on two different days. cDNA library production and sequencing was performed only one time and all 16 RNA samples were prepared together.
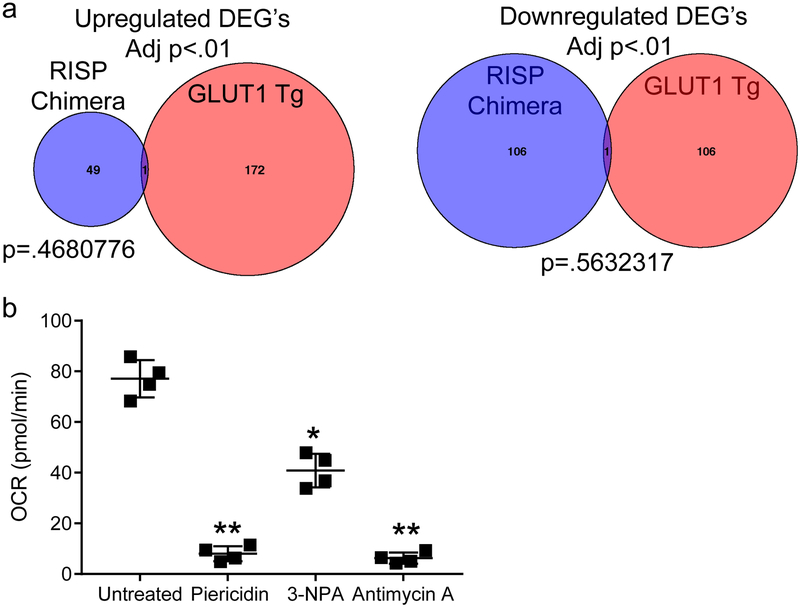
It is possible that the increase in glycolysis might have resulted in gene expression changes in RISP-deficient Treg cells. However, GLUT1-overexpressing Treg cells that display high glycolytic flux and reduced suppressive capacity had very little overlap with the RISP-deficient Treg cells isolated from chimeric mice (Extended Data Fig. 10a)5. Furthermore, WT Treg cells ex vivo treated for 24 hours with individual mitochondrial respiratory chain inhibitors targeting complex I (Piercidin), II (3-NPA), and III (Antimycin A) displayed diminished OCR yet different levels of 2-HG and succinate accumulation along with differential gene expression (Fig. 4c,d; Extended Data Fig. 10b). Complex III inhibition by antimycin A was the only inhibitor that caused an increase in both succinate and 2-HG levels (Fig. 4c) and displayed the most profound changes in gene expression (Fig. 4d). These results suggest respiratory chain inhibition at different complexes results in differential metabolite changes to cause distinct gene expression changes. It will be interesting in future studies to determine whether the conditional loss of different respiratory chain complexes within Treg cells causes distinct pathologies in mice.
Methods
Animal Models
C57BL/6 Uqcrfsfl/fl (RISPfl/fl) are previously described8. C57BL/6 mice harboring a loxp-flanked exon 1 of the Uqcrq gene (encodes QPC, QPCfl/fl mice) were generated by Ozgene (locus map in Extended Data Figure 4a). The frt-flanked neomycin resistance cassette was removed by crossing QPCfl/fl mice to mice expressing FLP-recombinase (FLPo Mice Jackson Lab, Stock no. 011065). Loss of the Neo-cassette was confirmed using PCR. QPCfl/fl mice were genotyped using the following primers: 1. 5’-CTTCCGCTCCTCCCGGAAGT-3’, 2. 5’-TTCCCAAACTCGCGGCCCATG-3’ and 3. 5’-CAATTCCAGCCAACAGTCCC-3’ which allow identification of the Uqcrq wild-type, loxp-flanked, and excised alleles. RISPfl/fl and QPCfl/fl mice were checked for C57BL/6 status and both are >99% C57BL/J using the genome scanning service from Jackson Laboratories. Foxp3YFP-Cre (stock no. 016959), Foxp3eGFP-Cr-eERT2 (stock no. 016961), and ROSA26SorCAG-tdTomato (Ai14, stock no. 007908) mice were obtained from Jackson Laboratory. 40 mg/ml tamoxifen dissolved in corn oil was administered to mice every third day using oral gavage to reach an effective dose of 320mg/kg in 8 to 12-week old mice. All animal procedures were approved by Institutional Animal Care and Use Committee (IACUC) at Northwestern University.
Flow cytometry and Cell Sorting
Spleen, lymph nodes (always included all superficial and periaortic lymph nodes) and thymus were harvested from 10-day post-natal, 3-week-old and adult (8–12-week-old) mice. To obtain a single-cell suspension, tissues were disrupted using scored 60-mm petri dishes in PBS containing 2% FBS and filtered through a 70-μM nylon mesh filter. Total spleen, lymph node, and thymus counts were obtained using the Cellometer K2 Counter using AOPI stain (Nexcelom). Single cell suspensions were stained with antibodies against CD45.2 (Clone: 104), CD4 (Clone: RM4–5), CD8 (Clone: 53–6.7), CD25 (Clone: PC61.5), CD44 (Clone: IM7), CD62L (Clone: MEL-14) to obtain absolute cell numbers. For intracellular protein expression, samples were fixed using the Foxp3/Transcription Factor Staining Buffer Set (Invitrogen Catalog no. 00-5523-00) according to the manufactures instructions and stained with Foxp3 (Clone: NRRF-30), HELIOS (Clone: 22F6), and EOS (Clone: ESB7C2) and Ki-67 (Clone: SalA15). CD4+ T cells were purified from single cell suspension using the EasySep™ mouse CD4+ T cell isolation Kit (Stemcell, Catalog no. 19852) according to the manufactures instructions. CD4+ T cells were further stained with antibodies against CTLA-4 (Clone: UC10–4B9), GITR (Clone: DTA-1), ICOS (Clone: C398.4A), OX40 (Clone: OX-86), CD69 (Clone: H1.2F3), CD103 (Clone: 2E7), Nrp1 (Clone: 3DS304M), CD73 (Clone: TY/11.8), PD-1 (Clone: 29F.1A12), and Tigit (Clone: GIGD7). All samples were analyzed on LSR Fortessa flow cytometers (BD) and data was analyzed using FlowJo software. Cells were sorted using a custom SORP FASC Aria II (BD).
Cell Culture
In vitro Treg cell suppression assays were performed using the protocol described by Collison et al.29 Briefly, CD4+ Foxp3-YFP+ CD25+ cells were isolated and co-cultured with differing quantities of CD8+ T cell cells labeled with Cell Trace Violet (ThermoFisher, Catalog no. C34557) according to the manufactures instructions. Treg cell-CD8+ T cell co-cultures were activated using CD3/CD28 MACSiBead particles (Miltenyi) at a ratio of three beads to one CD8+ T effector cell. After 72 hours, cells were harvested and analyzed by flow cytometry. The division index of each samples was calculated using the proliferation function in FlowJo software. For Treg cell culture in vitro, CD4+ Foxp3-YFP+ CD25+ cells were freshly isolated using FACS sorting and cultured using the Mouse Treg Expansion Kit beads (Miltenyi, Catalog no. 130-095-925) following the manufacture’s protocol. In short, 100,000 CD25+ Treg cells were cultured with 300,000 pre-loaded CD3/CD28 MACSiBead particles and 4000U/ml recombinant human IL-2 (NCI at Frederick Preclinical Repository. All cell culture experiments were performed in RPMI 1640 (Corning) supplemented with 10% Nu-Serum (Corning), 1% Hepes (Corning), 1% Glutamax (Gibco), 1% Antibiotic/Antimycotic (Corning), 1% MEM non-essential amino acids (Corning), 1 mM methyl pyruvate (Sigma, Catalog no. 371173), 400 μM Uridine and 50 μM β-mercaptoethanol. Mitochondrial inhibitors Piericidin, 3-NPA and Antimycin A were all obtained from Sigma.
Protein extraction and Immunblot
CD4+ Foxp3-YFP+ CD25+ cells were collected using fluorescence-activated cell sorting. Following isolation, cells were lysed in cell lysis buffer (Cell Signaling), resolved on 12% polyacrylamide gels (Bio-Rad) and transferred to nitrocellulose membranes. Membranes were blocked using 5% milk for 1 hour and then incubated with anti-RISP (Mitosciences, catalog no. ab14746; used at 1:250 dilution) and anti-β-actin (Sigma, catalog no. T9026; used at 1:2000 dilution) overnight. Membranes were washed with TBST the next day and then incubated with goat anti-mouse IRDye 680RD (Li-cor, catalog no. C50721, 1:5,000 dilution) and goat anti-rabbit IRDye 800CW (Li-cor, catalog no. C60321; 1:10,000 dilution) for one hour. Following another TBST wash the membranes were directly imaged using the Odyssey Fc Analyzer (Li-cor).
RNA Isolation and real time PCR
RNA was isolated using the RNeasy plus micro kit (Qiagen) following the manufacturer’s instructions. RNA was converted to cDNA using the RETROscript Reverse Transcription Kit in accordance with the manufactures instruction. Real time PCR was performed on the CFX384 Real Time System (Bio-rad) using iQ SYBR Green Supermix (Bio-rad) and 200 nM (final concentration) of the follow primers: Uqcrq-F 5’-CACGCGTCTATCTTCTGTCC −3’, Uqcrq-R 5’-CTGAAATAGCTTGGGAAGGC-3’, Rpl19-F 5’-GAAGGTCAAAGGGAATGTGTTCAA-3’ Rpl19-R 5’-TTTCGTGCTTCCTTGGTCTTAGA-3’. Data were analyzed using the comparative CT method (ΔΔCt method)30.
RNA-seq analysis
Cells were lysed with RLT Buffer from the Qiagen RNeasy Plus Mini kit (Qiagen). Cell lysates were stored at −80°C until RNA was extracted. RNA isolations were performed using Qiagen RNeasy Plus Micro/Mini kit (Qiagen) (Extended Data Fig. 6) or the AllPrep DNA/RNA Micro Kit (Qiagen) (Figure 3 and 4, Extended Data Fig. 7,8) following the manufacturer’s protocol with an additional on-column DNase treatment using the RNase-Free DNase Set (Qiagen). RNA quality and quantity were measured using Agilent 4200 Tapestation using the high-sensitivity RNA ScreenTape System (Agilent Technologies). mRNA libraries were prepared using the SMART-Seq v4 Ultra Low Input RNA Kit (Takara Bio USA, Inc) +Nextera XT DNA sample preparation kit (Illumina Inc) (Extended Data Fig. 6) or the NEBNext Ultra I RNA Library Prep Kit for Illumina with poly (A) mRNA selection (NEB Inc) (Figure 3,4, Extended Data 7). DNA libraries were sequenced on an Illumina NextSeq 500 instrument (Illumina Inc) with a target read depth of approximately 30 million aligned reads per sample. The pool was denatured and diluted, resulting in a 2.5 pM DNA solution. PhiX control was spiked at 1% and the pool was sequenced by 1×75 cycles using NextSeq 500 High Output reagent kit V2 (Illumina Inc). FASTQ reads were trimmed using Trimmomatic to remove end nucleotides with a PHRED score less than 30 and requiring a minimum length of 20 bp. Reads were then aligned to the mm10 genome using tophat version 2.1.031 using the following options --no-novel-juncs --read-mismatches 2 --read-edit-dist 2 --max-multihits 20–library-type fr-unstranded. The generated bam files were then used to count the reads only at the exons of genes using htseq-count32 with the following parameters -q -m intersection-nonempty -s no -t exon. Differential expression analysis was performed using the R/Bioconductor package edgeR33. Bigwig tracks of RNA-Seq expression were generated by using the GenomicAlignments package in R in order to calculate the coverage of reads in counts per million (CPM) normalized to the total number of uniquely mapped reads for each sample in the library. Gene set enrichment analysis was done using the Broad Institute GSEA software34. In brief, the gene list output from edgeR was ranked by calculating a rank score of each gene as −log 10 (PValue)*sign(logFC). A pre-ranked GSEA analysis was done using 3000 permutations and the Hallmark pathway database. To specifically assess the alterations in Treg cell signature gene expression, we used a Treg cell gene expression pattern defined in a previous study35.
DNA methylation analysis
Genomic DNA was isolated using the AllPrep DNA/RNA Micro Kit (Qiagen). To assess genome-wide DNA methylation status, we performed reduced representation bisulfite sequencing with modifications (mRRBS)36. Following fluorometric quantification with a Qubit 3.0 instrument, genomic DNA was subjected to restriction endonuclease digestion with MspI (New England Biolabs) and size selected for fragments approximately 100–250 base pairs in length using solid phase reversible immobilization (SPRI) beads (MagBio Genomics). Resulting DNA underwent bisulfite conversion with the EZ DNA Methylation-Lightning Kit (Zymo Research) per the manufacturer’s protocol. The efficiency of our bisulfite conversion reaction averaged > 99% as assessed by C→T conversion at CpG motifs in un-methylated λ-bacteriophage DNA spike-in controls (New England BioLabs N3013S). We then used the Pico Methyl-Seq Library Prep Kit (Zymo Research) to create indexed Illumina-compatible non-directional libraries from bisulfite-converted single-stranded DNA. The libraries were then pooled for sequencing on an Illumina NextSeq 500 instrument using the NextSeq 500/550 V2 High Output reagent kit (1 × 75 cycles) to obtain a minimum read depth of 50 million reads/sample.
Demultiplexing was accomplished with bcl2fastq v2.17.1.14 followed by trimming (using TrimGalore!37 v0.4.3) of 10 base pairs from the 5’ end to remove primer and adapter sequences. Sequence alignment to the GRCm38/mm10 reference genome and methylation calls were performed with Bismark38 v0.16.3. Bismark coverage (counts) files for cytosines in CpG context were generated using Bismark. These files were then analyzed with the DSS v2.14.0 R/Bioconductor package39 (R v3.4.1) for differential methylation and quantification. Cumulative distribution plots were generated with the ecdf base R function, and Venn diagrams were created with the VennDiagram v1.6.17 R package. K-means clustering and heatmaps were generated using the Morpheus web interface (The Broad Institute)40.
SeqMonk v1.38.2 was used for data visualization and quantitation using the bisulphite methylation over features pipeline for the sliding window approach as described in the text and figure legends where applicable. Transcriptional start sites (TSS) were obtained from the Ensembl Genes 90 database and filtered for those with a Consensus CDS ID. Methylation around CpG island-containing genes was determined by filtering for windows overlapping less than 0.1 kb from a CpG island (MGI database) and examining behavior around TSSs of differentially expressed genes. All computational analysis was performed using “Genomics Nodes” on Quest, Northwestern University’s High-Performance Computing Cluster. Specific statistical testing procedures are elaborated in the text and figure legends, performed either in R using packages specified above or in GraphPad Prism v7.02.
Metabolite measurements and analysis
CD4+ Foxp3-YFP+ CD25+ were isolated, washed once with .9% NaCl which was subsequently removed, and frozen in liquid nitrogen. Following collection of all samples over multiple days, samples were thawed on ice and suspended in 50 μl of ice-cold 80% methanol per 200,000 cells. Samples were frozen in liquid nitrogen and thawed in a 37C water bath three times. Following that, cells were centrifuged at 18,000×g for 10 minutes at 4C. The supernatant was transferred to fresh tubes and dried. Samples were resuspended in 10 μl per 150,000 cells. Samples were analyzed by High-Performance Liquid Chromatography and High-Resolution Mass Spectrometry and Tandem Mass Spectrometry (HPLC-MS/MS). Specifically, the system consisted of a Thermo Q-Exactive in line with an electrospray source and an Ultimate3000 (Thermo) series HPLC consisting of a binary pump, degasser, and auto-sampler outfitted with an Xbridge Amide column (Waters; dimensions of 4.6 mm × 100 mm and a 3.5-μm particle size). The mobile phase A contained 95% (vol/vol) water, 5% (vol/vol) acetonitrile, 20 mM ammonium hydroxide, 20 mM ammonium acetate, pH = 9.0; B was 100% acetonitrile. The gradient was as following: 0–1 min, 15% A; 18.5 min, 76% A; 18.5–20.4 min, 24% A; 20.4–20.5 min, 15% A; 20.5–28 min, 15% A with a flow rate of 400 μL/min. The capillary of the ESI source was set to 275 °C, with sheath gas at 45 arbitrary units, auxiliary gas at 5 arbitrary units and the spray voltage at 4.0 kV. In positive/negative polarity switching mode, an m/z scan range from 70 to 850 was chosen and MS1 data was collected at a resolution of 70,000. The automatic gain control (AGC) target was set at 1 × 10⁶ and the maximum injection time was 200 ms. The top 5 precursor ions were subsequently fragmented, in a data-dependent manner, using the higher energy collisional dissociation (HCD) cell set to 30% normalized collision energy in MS2 at a resolution power of 17,500. The sample volumes of 10 μl were injected which contained 150,000 cells. Data acquisition and analysis were carried out by Xcalibur 4.0 software and Tracefinder 2.1 software, respectively (both from Thermo Fisher Scientific). For metabolite concentrations, the samples (containing dried extraction of 500,000 cells) were resuspended in 70 μl of 50% acetonitrile containing 25 pg/μl D5-2-hydroxyglutarate disodium salt (Toronto Research Chemical). 25 μl of each sample were analyzed by High-Performance Liquid Chromatography and High-Resolution Mass Spectrometry and Tandem Mass Spectrometry (HPLC-MS/MS) as described above. Cellular quantities of 2-HG, succinate, α-KG, and fumarate were calculated using the ratio measured metabolite to the known amount of D5-2-hydroxyglutarate disodium salt spiked into the samples. Concentrations where determined using the average cellular diameter of each sample which was measured with the Cellometer K2 Counter (Nexcelon) and assuming 70% of the volume of the cell was water.
Oxygen consumption (OCR) and extracellular acidification rate (ECAR) measurements
OCR and ECAR were measured using the XF96 extracellular flux analyzers (Seahorse Bioscience). Basal mitochondrial respiration was measured by subtracting the OCR values after treatment with 1 μM antimycin A (Sigma) and 1 μM rotenone (Sigma) from the initial cellular measurements. ATP-coupled respiration was determined by treatment with 1 μM oligomycin A (Sigma), by the subtraction of oligomycin A values from basal respiration. Maximal mitochondrial respiration (post-CCCP respiration) was determined by subtracting the OCR after treatment with antimycin and rotenone as above from the OCR measured following treatment with 10μM Carbonyl cyanide 3-chlorophenylhydrazone (CCCP-Sigma). Experiments were performed in RPMI lacking phenol red and bicarbonate supplemented with 0.5% dialyzed serum, 11 mM glucose and 2 mM glutamine according to Seahorse Bioscience’s instructions. Basal glycolytic rate was determined by subtracting ECAR measurement after treatment with 25mM 2-deoxyglucose (2-DG, Sigma) from the initial measured ECAR. Total glycolytic capacity was obtained by subtracting the ECAR following treatment with 25mM 2-DG from the ECAR measured after treatment with 1 μM oligomycin A. All OCR and ECAR measurements were performed on 300,000 freshly FASC sorted Treg cells (CD4+ Foxp3-YFP+ CD25+ cells for 3-week-old mice; CD4+ Foxp3-GFP+ TdTomato-RFP+ for adult QFi animals). Freshly sorted Treg cells were adhered to the seahorse analysis plate using Cell Tak (Corning) per the Seahorse Biosciences instructions.
NAD+/NADH Measurements
NAD+/NADH measurements were done using the NAD/NADH Glo Assay kit from (Promega). 200.000 cells were extracted in 50 μL ice cold lysis buffer (1% Dodecyltrimethylammonium bromide (DTAB) in 0.2 N NaOH diluted 1:1 with PBS), and immediately frozen at −80°C. To measure NADH, 25 μL of samples were incubated at 75°C for 30 min where basic conditions selectively degrade NAD+. To measure NAD+, 25 μL of samples and 12.5 μL 0.4 N HCl were incubated at 60°C for 15 min, where acidic conditions selectively degrade NADH. Following incubations, samples were allowed to equilibrate to room temperature and then quenched by neutralizing with 25 μL 0.25 M Tris in 0.2 N HCl (NADH) or 12.5 μL 0.5 M Tris base (NAD+). 50μl of NAD/NADH-Glo™ Detection Reagent was added to each well. Luminescence was measured after 3h incubation at room temperature.
Adoptive transfer colitis model
Rag-1-deficient animals where acquired from Jackson lab (Cat# 002216) and colitis was induced based on the protocol described by Workman and collegues41. In brief, CD45.1+ CD4+ CD45rbhi CD25− (Teff) and CD45.2+ CD4+ Foxp3-YFP+ CD25+ (Treg) cells were isolated and 400,000 Teff cells with or without 100,000 Treg cells were injected into Rag-1-deficient mice. Mice were weighed at the time of injection and monitored 3 times weekly for 12 weeks or until mice lost 20% of their initial body weight. Colons were isolated and fixed overnight in 10% neutral-buffered formalin. Following overnight fixations, colons were wrapped and stored in PBS at 4C until embedding in paraffin.
B16 Melanoma Model
100,000 B16-F10 (ATCC) were subcutaneously injected into the flank of 8–12-week old mice. One day prior (−1) to tumor injection and 1, 3, 6, 9, and 12 days after injection of tumors mice were treated with 320mg/kg of tamoxifen dissolved in corn oil by oral gavage. Tumor development and progression was monitored by caliper measurement 3 times per week. Mice were euthanized prior to tumors reaching 1500mm3.
Statistics and reproducibility
P values were calculated as described in each individual figure legend using Graphpad Prism 7 (Graphpad Software) or R. Data are presented as mean ± standard deviation unless specifically stated in the figure legend. Numbers of biological and/or technical replicates are stated in the figure legends. Randomization was not performed in animal experiments; however, littermates were used whenever possible. The investigators were not blinded to allocation during experiments and outcome assessment. All images are representative of at least three independent experiments on mice of the same genotype. Immunoblots are representative of two independent experiments total >6 individual mice of each genotype pooled in at least 4 samples. No statistical method was used to predetermine sample size and experiments were not randomized.
Data availability
All RNA-seq and DNA methylation data have been deposited Gene Expression Omnibus (GEO) under accession code GSE120452. All other data from the manuscript are available from the corresponding author on request.
Extended Data
Extended Data Figure 1: Loss of RISP in Treg cells results in T cell proliferation, activation and immune infiltration into multiple organs.
a, Representative images of skin changes observed in RISP KO (top) animals compared to RISP WT. b,c, Weight (b) and total cellularity (c) of the spleen (RISP WT n=10, RISP KO n=9), lymph nodes (RISP WT n=10, RISP KO n=9), and thymus (RISP WT n=5, RISP KO n=5) in RISP WT and KO mice at 3 weeks of age. d, Representative 10X-images from 3-week-old RISP WT and KO animals. The RISP KO thymuses show thinning of the thymic cortex secondary to lymphoid depletion. Significant perivascular inflammation can be observed in the lung and liver, while dermal thickening and profound inflammation was seen in the skin. e, f, CD4+ (e, RISP WT n=10, RISP KO n=9) and CD8+ (f, RISP WT n=10, RISP KO n=9) T cell numbers in the spleen and lymph nodes in 3-week-old mice. g, h, Percentage of naïve (CD62L+ CD44−) and effector (CD62L− CD44+) cells of the total CD4+ (g, RISP WT n=5, RISP KO n=5) and CD8+ (h, RISP WT n=5, RISP KO n=5) T cells. Images are representative of at least three mice harvested on independent days. Data represent mean ± SD and were analyzed with (b, c) two-tailed t-test (**p<.001, specific p-values displayed in supplemental source data) or with (e-h) multiple two-tailed t-tests using a two-stage linear step-up procedure of Benjamini, Krieger and Yekutieli, with Q = 1%. Each cell type was analyzed individually, without assuming a consistent SD (**q<.001, specific q-values displayed in supplemental source data). All data points on graphs represent individual animals isolated and analyzed on at least 2 separate days.
Extended Data Figure 2: Mice with regulatory T cells deficient in RISP do not display thymic dysfunction early in life.
a, b, Thymic weight (a) and total thymocyte number (b) observed from 10-day-old RISP KO (n=5) and WT (n=5) mice. c, Absolute cell numbers of double-negative (CD4− CD8−, DN), double-positive (CD4+ CD8+, DP), CD8 single-positive (CD4− CD8+, CD8 SP), and CD4 single-positive (CD4+ CD8−, CD4 SP) populations from the thymuses of 10-day old RISP KO (n=5) and WT (n=5) mice. d, Foxp3-YFP+ and Foxp3-YFP+ CD4 SP absolute cell numbers in the thymuses of 10-day old RISP KO (n=5) and WT (n=5) animals..e, Representative contour plot of the Treg cell compartment in the superficial lymph nodes at 3 weeks of age. Contour plots are representative of at least three independent experiments totaling at least 5 mice. Numbers in dot plot quadrants indicate percentage of cells. Images are representative of at least three mice harvested on independent days. Data represent mean ± SD and were analyzed with (a, b) two-tailed t-test (specific p-values displayed in supplemental source data) or with (c, d) multiple two-tailed t-tests using a two-stage linear step-up procedure of Benjamini, Krieger and Yekutieli, with Q = 1%. Each cell type was analyzed individually, without assuming a consistent SD (specific q-values displayed in supplemental source data). All data points on graphs represent individual animals isolated and analyzed on at least 2 separate days.
Extended Data Figure 3: Loss of RISP does not significantly impair expression of classic Treg cell markers, activation markers and proliferation, but impairs Treg suppressive function.
a, Expression of CD25 on CD4+ Foxp3-YFP+ cells isolated from the spleen and lymph nodes of 21-day-old RISP KO and RISP WT animals. b, Surface expression of CTLA-4 and GITR on CD4+ Foxp3-YFP+ CD25+ cells from 3-week-old RISP KO and WT mice. c, Cellular expression of EOS and Helios from CD4+ Foxp3+ CD25+ cells isolated from the spleen and lymph nodes. d, Surface expression of activation makers CD44, CD69, CD103, ICOS, and OX40 on CD4+ Foxp3-YFP+ CD25+ cells isolated from the spleen and lymph nodes. e, Ki-67 expression in CD4+ Foxp3+ CD25+ from the spleen and lymph nodes. f, Percentage of central (cTreg) verses effector Treg (eTreg) cells in the spleen and lymph nodes of 3-week-old RISP KO (n=4 for both tissues) and RISP WT (spleen n=6, LN n=8) mice with representative contour plot. g, Representative histograms of CD69, CD73, and Nrp1 expression on cTreg and eTreg cells isolated from lymph nodes of 3-week-old RISP KO and RISP WT mice. h, Cell trace violet (CTV) dilution in CD8+ effector T cells stimulated to proliferate with varying ratios of RISP WT and RISP KO CD4+ Foxp3-YFP+ CD25+ cells isolated from the lymph nodes of 3-week old mice. i, Representative images of the colons from Rag1-null mice 1 month following adoptive transfer. Images are representative of at least three mice harvested on independent days. Contour plots are representative at least three independent experiments totaling at least 4 mice. Numbers in dot plot quadrants indicate percentage of cells. Histograms are representative of at least three independent experiments totaling at least five mice (WT=Blue, KO=Red). Numbers on histograms represent mean fluorescence intensity (MFI) of depicted samples. Y-axis of all histograms represents % of max. Data in panel (f) analyzed with multiple two-tailed t-tests using a two-stage linear step-up procedure of Benjamini, Krieger and Yekutieli, with Q = 1%. Each cell type was analyzed individually, without assuming a consistent SD (specific q-values displayed in supplemental source data). All data points on graphs represent individual animals isolated and analyzed on at least 2 separate days.
Extended Data Figure 4: Loss of complex III subunit QPC in Treg cells gives rise to a lethal inflammatory disorder.
a, Scheme illustrating the strategy utilized to generate Uqcrq floxed and excised alleles. b, Expression of Uqcrq mRNA in CD4+ Foxp3-YFP+ CD25+ cells from 21-day-old QPC KO (n=4) relative to QPC WT (n=4) mice. Uqcrq expression was normalized to expression of Rpl19. c,d, Oxygen consumption rate (OCR) (c) and extracellular acidification rate (ECAR) (d) of CD4+ Foxp3-YFP+ CD25+ cells isolated from 3-week-old QPC WT (n=3) and QPC KO (n=3) mice e, Survival of QPC WT (n=8) and QPC KO (n=9) animals (p=.0002 using one-sided log-rank test). f-h, Weights of spleens (f), lymph nodes (g), and thymuses (g) from 3-week-old QPC WT (n=4) and KO (n=5) mice. i-j, Total cellularity of the spleen (i), lymph nodes (j), and thymuses (k) from 3-week-old QPC WT (n=4) and KO (n=5) mice. l,m, CD4+ (l) and CD8+ (m) T cell numbers in the spleen and lymph nodes in 3-week-old QPC WT (n=4) and QPC KO (n=5) animals. n,o, Percentage of naïve (CD62L+ CD44−) and effector (CD62L− CD44+) cells of the total CD4+ (n) and CD8+ (o) T cells in 3-week-old QPC WT (n=4) and QPC KO (n=5) animals. p, Absolute number of Treg cells in the spleen and lymph nodes from 3-week-old QPC WT (n=4) and KO (n=5) animals. Data represent mean ± SD and were analyzed with (b, f-k) two-tailed t-test (*p<.01, **p<.001, specific p-values displayed in supplemental source data) or with (c,d, l-p) multiple two-tailed t-tests using a two-stage linear step-up procedure of Benjamini, Krieger and Yekutieli, with Q = 1%. Each cell type was analyzed individually, without assuming a consistent SD (*q<.01, **q<.001, specific q-values displayed in supplemental source data). All data points on graphs represent individual animals isolated and analyzed on at least 2 separate days.
Extended Data Figure 5: Loss of QPC in Treg cells impairs suppressive function without altering Foxp3 expression.
a, Representative images of the spleen, superficial lymph nodes, mesenteric lymph nodes, and thymuses from QPC iKO animals compared to QPC iWT treated with tamoxifen for 28 days. b, c, Cellularity of the spleen (b) and lymph nodes (c) from QPC iWT (n=4) and QPC iKO (n=4) mice treated with tamoxifen for 28 days. d, 40X histological images of the skin from QPC iKO and QPC iWT animals. e, Percentage of CD4+ T cells (CD45+ CD4+), CD8+ T cells (CD45+ CD8+), Treg cells (CD45+ CD4+ Foxp3-GFP+) and non-T leukocytes (CD45+ CD4− CD8−) from the spleen and lymph nodes of QPC iWT (n=4) and QPC iKO (n=4) expressing tdTomato-RFP after 2 weeks of tamoxifen treatment every third day. f, Percentage of thymic epithelial cells (CD45− EpCAM+) expressing tdTomato-RFP after 2 weeks of tamoxifen treatment every third day from QPC iWT (n=4) and QPC iKO (n=4). g, h, Total cellularity of the spleen (g) and lymph nodes (h) 3 months after 3 doses of tamoxifen from QPC iWT (n=4) and QPC iKO (n=4) animals. i, Representative dot plots of the splenic Treg cell compartment in QPC iKO and QPC iWT at 3 months after tamoxifen treatment. Images are representative of at least three mice collected on 3 different days. (f) Numbers in quadrants indicate percentage of cells. (b,c,e-h) Data represent mean ± SD and were analyzed with (b,c,f-h) two-tailed t-test (*P˂.05, **P˂.01, specific p-values displayed in supplemental source data) or (e) multiple two-tailed t-tests using a two-stage linear step-up procedure of Benjamini, Krieger and Yekutieli, with Q = 1%. Each cell type was analyzed individually, without assuming a consistent SD (**q<.001, specific q-values displayed in supplemental source data). All data points on graphs represent individual animals isolated and analyzed on at least 2 separate days.
Extended Data Figure 6: Loss of RISP in Treg cells results in major alterations in gene expression including downregulation of known Treg cell suppressive genes in 21-day-old mice.
a, Hierarchical clustering showing changes in gene expression in CD4+ Foxp3-YFP+ CD25+ cells isolated from 3-week-old RISP KO (n=4) and RISP WT (n=4) mice. b, Volcano plot showing differential gene expression in CD4+ Foxp3-YFP+ CD25+ cells isolated from 3-week-old RISP KO (n=4) and RISP WT (n=4) mice. Uqcrsf1 (gene encoding for RISP) not shown on plot (logFC=−4.83, −log10(p-value)=203). c, Normalized enrichment scores from gene set enrichment analysis from the hallmark gene set in the molecular signatures database v6.0 comparing gene-set generated from panel a. d, Heat map of Treg cell signatures genes that are differentially expressed (adj. P<.01) in RISP KO (n=4) versus RISP WT (n=4) animals. e, Surface expression of CD73, Nrp1, PD1, and Tigit on CD4+ Foxp3-YFP+ CD25+ cells isolated from the spleen and lymph nodes of 3-week-old RISP KO and RISP WT animals. Histograms are representative at least two independent experiments totaling at least 4 mice. Numbers above histograms represent mean fluorescence intensity (MFI) of depicted samples. Data in panels a-d, are from one RNA sequencing experiment. CD4+ Foxp3-YFP+ CD25+ cells from RISP WT (n=4) and RISP KO (n=4) animals were isolated on different days. cDNA library production and sequencing was performed only one time and all 8 RNA samples were prepared together.
Extended Data Figure 7: Mice that contain a Treg cell compartment with chimeric RISP-loss do not develop an inflammatory disease but do display a cell autonomous impairment in expression of a Treg-specific transcription profile.
a,b, Total number of cells in the spleen (a) and lymph nodes (b) of adult (8–12 weeks) RISP chimeric KO (n=4) and chimeric WT (n=4) mice. c, CD4+ and CD8+ T cell numbers in the spleen and lymph nodes of adult RISP chimeric KO (n=4) and chimeric WT (n=4) mice. d, Percentage of total CD4+ cells that are either CD4+ Foxp3-YFP+ CD25+ (chimeric Treg cells) and CD4+ Foxp3+ CD25+ (total Treg cells) from adult RISP chimeric KO (n=4) and RISP chimeric WT (n=4) mice. e, Percentage of chimeric Treg cells of all Treg cells present in adult RISP chimeric KO (n=4) and chimeric WT (n=4) animals. f,g, Ratio of surface expression of CD44, ICOS (d) and CTLA-4 (e) on chimeric Treg cells (CD4+ Foxp3-YFP+ CD25+) relative to CD4+ Foxp3-YFP− CD25+ (wild-type Treg cells) cells from pooled samples of the spleen and lymph node in adult RISP chimeric KO (n=4) and RISP chimeric WT mice (n=4). h, Hierarchical clustering showing changes in gene expression in CD4+ Foxp3-YFP+ CD25+ cells isolated from adult RISP chimeric KO (n=4) and chimeric WT mice (n=4). i, Normalized enrichment scores from gene set enrichment analysis from the hallmark gene set in the molecular signatures database v6.0 on data set shown in panel h. j, Ratio of surface expression of CD73 and Nrp1, on chimeric Treg cells relative wild-type Treg cells from pooled samples of the spleen and lymph node in adult RISP chimeric KO (n=4) and RISP chimeric WT (n=4) mice. k, Venn-diagram displaying overlap of differential expressed genes (adj. p<.01) from Treg cells (CD4+ Foxp3-YFP+ CD25+) isolated from 21-day-old RISP KO (n=4) and RISP WT (n=4) animals (RISP 21-day-old) versus chimeric Treg cells (CD4+ Foxp3-YFP+ CD25+) isolated from adult RISP chimeric KO (n=4) and RISP chimeric WT (n=4) mice. P values were calculated using hypergeometric similarity measure. (a-f,g,j) Data represent mean ± SD and were analyzed with (a,b,f,g,j) two-tailed t-test (*P˂.05, ** P˂.01, specific p-values displayed in supplemental source data) or (c,d,e) multiple two-tailed t-tests using a two-stage linear step-up procedure of Benjamini, Krieger and Yekutieli, with Q = 1%. Each cell type was analyzed individually, without assuming a consistent SD (**q<.001, specific q-values displayed in supplemental source data). All data points on graphs represent individual animals isolated and analyzed on at least 2 separate days. Data in panels h,i are from one RNA sequencing experiment. CD4+ Foxp3-YFP+ CD25+ cells from RISP chimeric WT (n=4) and RISP chimeric KO (n=4) animals were isolated on different days. cDNA library production and sequencing was performed only one time and all 8 RNA samples were prepared together.
Extended Data Figure 8: Loss of RISP in Treg cells alters DNA methylation without affecting the Foxp3 locus in 3-week-old mice.
a, b, CpG methylation around the transcriptional start site (TSS) and transcriptional end site (TES) (a) and the start (S) and end (E) of Treg cell-specific super-enhancer elements with 20 kb of flanking sequence (b) in CD4+ Foxp3-YFP+ CD25+ cells from 3-week-old RISP KO (n=4) and RISP WT (n=4) animals. c, DNA methylation status of the super-enhancer associated with the Foxp3 locus in RISP KO and RISP WT Treg cells. d,e, Percentage of methylated CpGs around the TSS of differentially downregulated (d) and upregulated (e) genes (log2FC≥2, FDR q-value<.05) from Extended Data Figure 6. (a,d,e) mRRBS data were smoothed with sliding window size of 20 CpGs and a step of 10 CpGs for sites with >5X coverage. (b) Treg cell-specific super-enhancer data were normalized over 1-kb windows. Average CpG methylation of n=3 biological replicates per group is shown. f, Venn diagram analysis partitioning differentially methylated loci (DML) and differentially expressed genes (DEG). g, Cumulative distribution function of differentially methylated CpGs within 100 kilobases of 87 DEG that were down-regulated (log2 fold-change≤0) in chimeric KO Treg cells. Data points represent average methylation at each gene locus. h, Heatmap displaying the methylation state (beta) of differentially methylated CpGs at gene loci that were both hypermethylated and differentially down-regulated (adj-p<.01) in the chimeric KO Treg cells. (c) Data represent mean ± SEM and were analyzed with two-tailed t-test. (a-e) CD4+ Foxp3-YFP+ CD25+ cells from RISP WT (n=3) and RISP KO (n=3) animals were isolated on different days. Further processing and sequencing was performed with all 6 samples together. (f-h) CD4+ Foxp3-YFP+ CD25+ cells from RISP chimeric WT (n=4) and RISP chimeric KO (n=4) animals were isolated on different days. Further processing and sequencing was performed with all 8 samples together.
Extended Data Figure 9: Metabolite alterations in complex III-deficient Treg cells.
a, The ratio of NAD+/NADH in Treg (CD4+ Foxp3-GFP+ tdTomato-RFP+) cells isolated from QPC iWT (n=5) or QPC iKO (n=6) 6 weeks after receiving 3 doses of tamoxifen. b, Calculated intracellular concentration of 2-HG, succinate, α-KG, and fumarate in Treg (CD4+ Foxp3-GFP+ tdTomato-RFP+) cells isolated from QPC iWT (5) or QPC iKO (5) 6 weeks after receiving 3 doses of tamoxifen. c,d, LC-MS quantified levels of specific complex III dependent (c), and TCA cycle (d) metabolites in CD4+ Foxp3-YFP+ CD25+ cells isolated from 3-week-old RISP KO and WT mice. Data represent mean ± SD and were analyzed by (a,b) two-tailed t-test (**p˂.01, respectively; specific p-values displayed in supplemental source data) or (c,d) multiple two-tailed t-tests using a two-stage linear step-up procedure of Benjamini, Krieger and Yekutieli, with Q = 1%. Each metabolite was analyzed individually, without assuming a consistent SD (*Q<.01, **Q<.001; specific q-values displayed in supplemental source data). All data points on graphs represent individual animals isolated and analyzed on at least 2 separate days.
Extended Data Figure 10: Elevated glycolytic flux does not phenocopy complex III inhibition in regulatory T cells.
a, Venn diagram displaying overlap of differentially expressed genes (adj. p<.01) from Treg cells (CD4+ Foxp3-YFP+ CD25+) isolated from 8-to-12-week-old RISP chimeric KO and RISP chimeric WT mice Treg cells (CD4+ Foxp3-YFP+ CD25+) verses Treg cells overexpressing GLUT1 isolated from adult animals. P values were calculated using hypergeometric similarity measure. b, Oxygen consumption rate (OCR) of Treg (CD4+ Foxp3-YFP+ CD25+) cells treated with 1μM Piericidin, 500μM 3-NPA, or 1μM antimycin A for 4 hours. Data represent mean ± SD and were analyzed 1-way ANOVA with Dunnett’s test for multiple comparisons (*adj-p<.05 **adj-p˂.01, respectively; specific p-values displayed in supplemental source data). All data points on graphs represent individual animals isolated and analyzed on at least 2 separate days.
Supplementary Material
Acknowledgements
We thank Robert H. Lurie Cancer Center Flow Cytometry facility and Metabolomics Core as well as the High Throughput RNA-Seq Center, within the Division of Pulmonary and Critical Care and the Mouse Histology and Phenotyping Laboratory at Northwestern University. We thank Kiwon Nam for processing of RNA sequencing samples. This research was supported in part through the computational resources and staff contributions provided by Quest high performance computing cluster. This work was supported by the NIH (R35CA197532, 5P01AG049665, 5P01HL071643) to N.S.C., and NIH (T32 T32HL076139) to S.E.W. B.D.S was supported by NIH K08HL128867 and the Francis Family Foundation’s Parker B. Francis Research Opportunity Award. E.M.S is a Cancer Research Institute Irvington Fellow supported by the Cancer Research Institute.
References
- 1.Lu L, Barbi J & Pan F The regulation of immune tolerance by FOXP3. Nat. Rev. Immunol (2017). doi: 10.1038/nri.2017.75 [DOI] [PMC free article] [PubMed] [Google Scholar]
- 2.Josefowicz SZ, Lu L-F & Rudensky AY Regulatory T Cells: Mechanisms of Differentiation and Function. Annu. Rev. Immunol 30, 531–564 (2012). [DOI] [PMC free article] [PubMed] [Google Scholar]
- 3.Gerriets VA et al. Metabolic programming and PDHK1 control CD4+ T cell subsets and inflammation. J. Clin. Invest 125, 194–207 (2014). [DOI] [PMC free article] [PubMed] [Google Scholar]
- 4.Michalek RD et al. Cutting edge: distinct glycolytic and lipid oxidative metabolic programs are essential for effector and regulatory CD4+ T cell subsets. J. Immunol 186, 3299–303 (2011). [DOI] [PMC free article] [PubMed] [Google Scholar]
- 5.Gerriets VA et al. Foxp3 and Toll-like receptor signaling balance Treg cell anabolic metabolism for suppression. Nat. Immunol 17, 1459–1466 (2016). [DOI] [PMC free article] [PubMed] [Google Scholar]
- 6.Angelin A et al. Foxp3 Reprograms T Cell Metabolism to Function in Low-Glucose, High-Lactate Environments. Cell Metab 25, 1282–1293.e7 (2017). [DOI] [PMC free article] [PubMed] [Google Scholar]
- 7.Pastor WA, Aravind L & Rao A TETonic shift: biological roles of TET proteins in DNA demethylation and transcription. Nat. Rev. Mol. Cell Biol 14, 341–356 (2013). [DOI] [PMC free article] [PubMed] [Google Scholar]
- 8.Sena LA et al. Mitochondria Are Required for Antigen-Specific T Cell Activation through Reactive Oxygen Species Signaling. Immunity 38, 225–36 (2013). [DOI] [PMC free article] [PubMed] [Google Scholar]
- 9.Rubtsov YP et al. Regulatory T cell-derived interleukin-10 limits inflammation at environmental interfaces. Immunity 28, 546–58 (2008). [DOI] [PubMed] [Google Scholar]
- 10.Brunkow ME et al. Disruption of a new forkhead/winged-helix protein, scurfin, results in the fatal lymphoproliferative disorder of the scurfy mouse. Nat. Genet 27, 68–73 (2001). [DOI] [PubMed] [Google Scholar]
- 11.Liston A et al. Lack of Foxp3 function and expression in the thymic epithelium. J. Exp. Med 204, 475–480 (2007). [DOI] [PMC free article] [PubMed] [Google Scholar]
- 12.Fontenot JD, Gavin MA & Rudensky AY Foxp3 programs the development and function of CD4+CD25+ regulatory T cells. Nat. Immunol 4, 330–6 (2003). [DOI] [PubMed] [Google Scholar]
- 13.Delgoffe GM et al. Stability and function of regulatory T cells is maintained by a neuropilin-1–semaphorin-4a axis. Nature 501, 252–256 (2013). [DOI] [PMC free article] [PubMed] [Google Scholar]
- 14.Zhang B, Chikuma S, Hori S, Fagarasan S & Honjo T Nonoverlapping roles of PD-1 and FoxP3 in maintaining immune tolerance in a novel autoimmune pancreatitis mouse model. Proc. Natl. Acad. Sci. U. S. A 113, 8490–5 (2016). [DOI] [PMC free article] [PubMed] [Google Scholar]
- 15.Sauer AV et al. Alterations in the adenosine metabolism and CD39/CD73 adenosinergic machinery cause loss of Treg cell function and autoimmunity in ADA-deficient SCID doi: 10.1182/blood-2011 [DOI] [PMC free article] [PubMed] [Google Scholar]
- 16.Joller N et al. Treg Cells Expressing the Coinhibitory Molecule TIGIT Selectively Inhibit Proinflammatory Th1 and Th17 Cell Responses. Immunity 40, 569–581 (2014). [DOI] [PMC free article] [PubMed] [Google Scholar]
- 17.Shalev I et al. Targeted deletion of fgl2 leads to impaired regulatory T cell activity and development of autoimmune glomerulonephritis. J. Immunol 180, 249–60 (2008). [DOI] [PubMed] [Google Scholar]
- 18.Ohkura N et al. T cell receptor stimulation-induced epigenetic changes and Foxp3 expression are independent and complementary events required for Treg cell development. Immunity 37, 785–99 (2012). [DOI] [PubMed] [Google Scholar]
- 19.Ohkura N, Kitagawa Y & Sakaguchi S Development and Maintenance of Regulatory T cells. Immunity 38, 414–423 (2013). [DOI] [PubMed] [Google Scholar]
- 20.McGrath-Morrow SA et al. DNA methylation regulates the neonatal CD4+ T-cell response to pneumonia in mice. J. Biol. Chem 293, 11772–11783 (2018). [DOI] [PMC free article] [PubMed] [Google Scholar]
- 21.Kitagawa Y et al. Guidance of regulatory T cell development by Satb1-dependent super-enhancer establishment. Nat. Immunol 18, 173–183 (2016). [DOI] [PMC free article] [PubMed] [Google Scholar]
- 22.Ansó E et al. The mitochondrial respiratory chain is essential for haematopoietic stem cell function. Nat. Cell Biol 19, 614–625 (2017). [DOI] [PMC free article] [PubMed] [Google Scholar]
- 23.Oldham WM, Clish CB, Yang Y & Loscalzo J Hypoxia-Mediated Increases in l-2-hydroxyglutarate Coordinate the Metabolic Response to Reductive Stress. Cell Metab 22, 291–303 (2015). [DOI] [PMC free article] [PubMed] [Google Scholar]
- 24.Intlekofer AM et al. Hypoxia Induces Production of L-2-Hydroxyglutarate. Cell Metab 22, 304–11 (2015). [DOI] [PMC free article] [PubMed] [Google Scholar]
- 25.Mullen AR et al. Oxidation of Alpha-Ketoglutarate Is Required for Reductive Carboxylation in Cancer Cells with Mitochondrial Defects. Cell Rep 7, 1679–1690 (2014). [DOI] [PMC free article] [PubMed] [Google Scholar]
- 26.Tyrakis PA et al. S-2-hydroxyglutarate regulates CD8+ T-lymphocyte fate. Nature 540, 236–241 (2016). [DOI] [PMC free article] [PubMed] [Google Scholar]
- 27.Xu W et al. Oncometabolite 2-hydroxyglutarate is a competitive inhibitor of α-ketoglutarate-dependent dioxygenases. Cancer Cell 19, 17–30 (2011). [DOI] [PMC free article] [PubMed] [Google Scholar]
- 28.Xiao M et al. Inhibition of α-KG-dependent histone and DNA demethylases by fumarate and succinate that are accumulated in mutations of FH and SDH tumor suppressors. Genes Dev 26, 1326–38 (2012). [DOI] [PMC free article] [PubMed] [Google Scholar]
- 29.Collison LW & Vignali DAA In vitro Treg suppression assays. Methods Mol. Biol 707, 21–37 (2011). [DOI] [PMC free article] [PubMed] [Google Scholar]
- 30.Schmittgen TD & Livak KJ Analyzing real-time PCR data by the comparative C(T) method. Nat. Protoc 3, 1101–8 (2008). [DOI] [PubMed] [Google Scholar]
- 31.Trapnell C, Pachter L & Salzberg SL TopHat: discovering splice junctions with RNA-Seq. Bioinformatics 25, 1105–1111 (2009). [DOI] [PMC free article] [PubMed] [Google Scholar]
- 32.Anders S, Pyl PT & Huber W HTSeq--a Python framework to work with high-throughput sequencing data. Bioinformatics 31, 166–9 (2015). [DOI] [PMC free article] [PubMed] [Google Scholar]
- 33.Robinson MD, McCarthy DJ & Smyth GK edgeR: a Bioconductor package for differential expression analysis of digital gene expression data. Bioinformatics 26, 139–140 (2010). [DOI] [PMC free article] [PubMed] [Google Scholar]
- 34.Subramanian A et al. Gene set enrichment analysis: A knowledge-based approach for interpreting genome-wide expression profiles. Proc. Natl. Acad. Sci 102, 15545–15550 (2005). [DOI] [PMC free article] [PubMed] [Google Scholar]
- 35.Hill JA et al. Foxp3 Transcription-Factor-Dependent and -Independent Regulation of the Regulatory T Cell Transcriptional Signature. Immunity 27, 786–800 (2007). [DOI] [PubMed] [Google Scholar]
- 36.Meissner A et al. Reduced representation bisulfite sequencing for comparative high-resolution DNA methylation analysis. Nucleic Acids Res 33, 5868–77 (2005). [DOI] [PMC free article] [PubMed] [Google Scholar]
- 37.Krueger F Trim Galore! (2017). Available at: http://www.bioinformatics.babraham.ac.uk/projects/trim_galore/. (Accessed: 19th September 2017)
- 38.Krueger F & Andrews SR Bismark: a flexible aligner and methylation caller for Bisulfite-Seq applications. Bioinformatics 27, 1571–1572 (2011). [DOI] [PMC free article] [PubMed] [Google Scholar]
- 39.Feng H, Conneely KN & Wu H A Bayesian hierarchical model to detect differentially methylated loci from single nucleotide resolution sequencing data. Nucleic Acids Res 42, e69–e69 (2014). [DOI] [PMC free article] [PubMed] [Google Scholar]
- 40.The Broad Institute. MORPHEUS: Versatile matrix visualization and analysis software Available at: https://software.broadinstitute.org/morpheus/. (Accessed: 7th May 2018)
- 41.Workman CJ et al. in Methods in molecular biology (Clifton, N.J.) 707, 119–156 (2011). [DOI] [PMC free article] [PubMed] [Google Scholar]
Associated Data
This section collects any data citations, data availability statements, or supplementary materials included in this article.
Supplementary Materials
Data Availability Statement
All RNA-seq and DNA methylation data have been deposited Gene Expression Omnibus (GEO) under accession code GSE120452. All other data from the manuscript are available from the corresponding author on request.


