

Abstract
Background and Purpose
Posttranslational modifications of cysteine residues represent a major aspect of redox biology, and their reliable detection is key in providing mechanistic insights. The metastable character of these modifications and cell lysis‐induced artifactual oxidation render current state‐of‐the‐art protocols to rely on alkylation‐based stabilization of labile cysteine derivatives before cell/tissue rupture. An untested assumption in these procedures is that for all cysteine derivatives, alkylation rates are faster than their dynamic interchange. However, when the interconversion of cysteine derivatives is not rate limiting, electrophilic labelling is under Curtin–Hammett control; hence, the final alkylated mixture may not represent the speciation that prevailed before alkylation.
Experimental Approach
Buffered aqueous solutions of inorganic, organic, cysteine, GSH and GAPDH polysulfide species were used. Additional experiments in human plasma and serum revealed that monobromobimane can extract sulfide from the endogenous sulfur pool by shifting speciation equilibria, suggesting caution should be exercised when interpreting experimental results using this tool.
Key Results
In the majority of cases, the speciation of alkylated polysulfide/thiol derivatives depended on the experimental conditions. Alkylation perturbed sulfur speciation in both a concentration‐ and time‐dependent manner and strong alkylating agents cleaved polysulfur chains. Moreover, the labelling of sulfenic acids with dimedone also affected cysteine speciation, suggesting that part of the endogenous pool of products previously believed to represent sulfenic acid species may represent polysulfides.
Conclusions and Implications
We highlight methodological caveats potentially arising from these pitfalls and conclude that current derivatization strategies often fail to adequately capture physiological speciation of sulfur species.
Linked Articles
This article is part of a themed section on Chemical Biology of Reactive Sulfur Species. To view the other articles in this section visit http://onlinelibrary.wiley.com/doi/10.1111/bph.v176.4/issuetoc
Abbreviations
- DTNB
5‐5′‐dithiobis(2‐nitrobenzoic acid)
- ESI
electrospray ionization
- IAM
iodoacetamide
- MBB
monobromobimane
- NEM
N‐ethylmaleimide
- UV–Vis
UV–visible
Introduction
Hydrogen sulfide (H2S) (From now on, we will use the term sulfide to refer to the sum of its different protonated forms that exist in solution, that is, H2S, HS− and S2 −.) is now regarded as an important small bioactive molecule that orchestrates signalling events hand in hand with NO (Kevil et al., 2017). A seminal paper by Mustafa et al. (2009), as well as subsequent work by others, provided evidence that persulfide (–SSH) and longer‐chain polysulfide (–SnH) moieties on regulatory or functional protein cysteine residues play a key role in transmitting sulfide‐triggered biological events (Paul and Snyder, 2012; Ono et al., 2014; Nagy, 2015). In addition, inorganic polysulfide species are thought to serve as important mediators in sulfide‐based redox biology (e.g. Nagy and Winterbourn, 2010a; Toohey, 2011; Greiner et al., 2013; Cortese‐Krott et al., 2015; Kimura, 2017; Miyamoto et al., 2017). Although it is clear that sulfide/polysulfide‐mediated cellular regulation is driven by redox chemistry, many mechanistic details remain elusive; this includes, for example, questions about the nature of the precursor molecule in a particular biological event and what drives the redox interconversion of sulfide/polysulfide/polythionate species. This uncertainty is partly due to the fact that, despite accumulating evidence underlying the importance of these reactive sulfur species (RSS) in biology, their reliable analysis still poses major challenges. On a more positive note, there has been a rapid evolution of sulfide and polysulfide detection protocols in the last few years, enabling a better understanding of the chemical biology of these species (Nagy et al., 2014). For protein cysteine polysulfide detection, the initially developed ‘switch techniques’ (modified biotin switch assay, Mustafa et al., 2009, and tag‐switch techniques, Zhang et al., 2014) were followed by ProPerDP (Doka et al., 2016; Doka et al., 2017), which separates cysteine thiols from cysteine polysulfides (after specifically pulling them down with biotinylated alkylating agents) by utilizing the reducibility of alkylated polysulfides as opposed to the non‐reducible nature of alkylated thiols. This method was published along with conceptually similar techniques introduced by other groups (Gao et al., 2015; Longen et al., 2016). Furthermore, a recent protocol called polyethylene glycol (PEG)‐conjugated maleimide‐labelling gel shift assay (PMSA) utilizes the cleavability of polysulfide chains by strong electrophiles and detection of protein polysulfide species based on mobility shifts on gels as a result of binding or cleavage of PEGylated alkylating agents (Akaike et al., 2017).
Each of these techniques relies on initial electrophilic labelling of thiols and polysulfides with a particular alkylating agent, attempting to ‘freeze’ their dynamic redox chemical reactions by generating relatively stable thioether or dialkyl polysulfide species. However, an understanding of the basic chemistry involved with these assays indicates that caution must be exercised when interpreting data from experiments utilizing these reagents. Specifically, if sulfur species are in a dynamic redox equilibrium, then the levels of the various alkylated species will be a function of the relative rates of electrophilic trapping versus the redox equilibrium interconversions of the trappable species (which depend on a number of different parameters, e.g. concentrations, pH and temperature). In essence, one would expect the electrophilic labelling of these polysulfides to be under Curtin–Hammett control (Seeman, 1986), meaning that due to the fast interconversion between different polysulfides, the mixture of alkyl polysulfides observed is a reflection of the relative rates of quenching rather than a representation of the true equilibrium. In other words, the observed labelled species may indicate the relative reactivity of the individual polysulfides rather than their actual concentrations (for a more detailed interpretation of this notion supported with chemical equations (Reactions S1–S7), please consult the Supporting Information). Hence, the initial electrophilic alkylation is a crucial step regarding the adequacy of the readouts of the particular method in light of the real speciation of the sulfur species to be detected. Similar problems were noticed in the early days of redox biology when methods were developed for cysteine thiol and disulfide species detection. For example, acidification was used initially to slow down redox events of thiol groups during cell lysis or tissue homogenization, although this is not necessarily sufficient to fully prevent artifactual redox reactions. This led to the use of cell permeable alkylating agents to avoid lysis‐induced oxidation of reactive thiols. However, both the identity and concentration of the applied alkylating agent [e.g. N‐ethylmaleimide (NEM), iodoacetamide (IAM) or S‐methyl methanethiosulfonate] make a difference in the detected oxidation state of protein thiol species, which was demonstrated for peroxiredoxins (Kumar et al., 2013; Sobotta et al., 2013). Despite these observations, a large body of the redox biology literature tends to ignore these phenomena.
Here, we highlight important chemical aspects of alkylation steps from a mechanistic viewpoint and experimentally demonstrate their impact particularly on the detection of polysulfides. Using inorganic polysulfides as well as cysteine, GSH and protein polysulfide systems, the speciation of polysulfide species of different chain lengths was investigated in a time‐ and concentration‐resolved manner using different alkylating agents. Our investigations focused on two important chemical phenomena: (i) speciation is likely to be under Curtin–Hammett control, so when alkylation is rate determining, the equilibria that describe sulfur species speciation can be shifted during the alkylation process and confine the measurements and (ii) certain alkylating agents have the ability to cleave polysulfur chains, even in already alkylated dialkyl polysulfide species.
Importantly, we obtained evidence that specific labelling of cysteine sulfenic acids (cysteine‐SOH) with dimedone can also affect cysteine speciation. Specifically, we detected larger amounts of dimedone‐labelled protein cysteine upon treatment of GAPDH with inorganic polysulfides (which is not expected to directly induce cysteine‐SOH formation) compared with when the protein was untreated or treated with H2O2 (which is known to induce cysteine‐SOH formation).
Speciation in biological systems is further complicated by the interplay between inorganic and organic sulfur species and the compartmentalization of concurrent reactions.
Finally, using the state‐of‐the‐art monobromobimane (MBB) derivatization‐based H2S detection protocol in human serum and plasma, we demonstrated that the amounts of sulfide detected largely depend on the concentration of MBB applied and the time of incubation with the alkylating agent. This observation is consistent with our previous proposal that speciation equilibria in biological sulfide pools are expected to be shifted towards sulfide production when sulfide is irreversibly derivatized during the detection protocol (Nagy et al., 2014).
Methods
Speciation of inorganic polysulfides
Direct infusion experiments
(Figures 1–2 and Table 1) Polysulfide solutions were prepared in either ultra‐pure water or pH 7.4 ammonium phosphate buffer from different starting salts, mixed potassium polysulfide (K2Sx), sodium disulfide (Na2S2), sodium trisulfide (Na2S3) and sodium tetrasulfide (Na2S4) to an approximate concentration of 10 mM and diluted 100‐fold before being infused into the electrospray ionization (ESI) source of the mass spectrometer for recording of the resulting mass spectra. IAM was then added to the remaining polysulfide solution from a 100 mM IAM stock (1% of polysulfide solution volume, resulting in a final concentration of 1 mM IAM) and allowed to react for at least 30 min before analysis. Either solution was infused for 1 min at a flow rate of 8 μL·min−1 and scanned at a rate of one scan s−1 in the presence of ammonium acetate to enhance ionization efficiency. Underivatized polysulfide solutions were analysed in negative ionization mode, while derivatized polysulfide solutions were monitored in both negative and positive ionization modes. Negative ionization mode was used to confirm the absence of unreacted polysulfides, and positive mode was used to monitor the presence of alkylated polysulfide species. High‐resolution mass spectra were recorded using a Waters SYNAPT G2‐Si ESI‐ToF‐MS (time‐of‐flight mass spectrometer) calibrated using sodium formate clusters and using standard conditions in the same manner as for the triple quadrupole analysis.
Figure 1.

Direct infusion MS‐based detection of inorganic polysulfide speciation in water. Spectra (A–C) were collected using a Xevo TQ‐S detector. Polysulfide solutions were prepared from different polysulfide salts: (A) mixed potassium polysulfide (K2Sx), (B) sodium trisulfide (Na2S3) and (C) sodium tetrasulfide (Na2S4). The polysulfide m/z calculated are as follows: S2 •− 63.9, S3 •− 95.9 and S4 •− 127.7, and the m/z measured varies slightly due to the low resolution of the mass spectrometer. Spectra (D–F) were collected using a Waters SYNAPT G2‐Si ESI‐ToF‐MS high‐resolution mass spectrometer. (D) Full spectrum of potassium polsulfide (K2Sx) in water shows S2 •−, S3 •− and S4 •− radical anions and thiosulfate. (E and F) Zoomed scan spectra of S3 •− and S4 •− radical anion peaks and their associated +2 isotope peaks respectively. Conditions: temperature (T) = 20οC, pH 7.4 (ammonium phosphate buffer), 100 μM polysulfide solutions, 8 μL·min−1, one scan s−1 for 1 min. All spectra were recorded in negative ionization mode. Figures are representative of n = 4, 2, 4, 5, 5 and 5 experiments with similar results that were conducted under identical conditions for (A–F) respectively.
Figure 2.

Direct infusion, MS‐based detection of inorganic polysulfide species in water before (C) and after addition of IAM (A and B). (B) The absence of polysulfide peaks in negative ionization mode and (A) the presence of derivatized polysulfide species (and sodiated peaks) in positive ionization mode after 10 min incubation of the polysulfide solutions with the alkylating agent. Conditions: temperature (T)= 20οC, pH 7.4 (ammonium phosphate buffer), 100 μM polysulfide solutions, 100 mM IAM, 8 μL·min−1, one scan s−1 for 1 min. Spectra are representative of n = 4 experiments that were conducted under identical conditions for (A–C).
Table 1.
Theoretical and observed masses for polysulfide radical ions, thiosulfate and other observed species in the experiment depicted in Figure 1D–F
| Exact mass (amu) | Measured mass (amu) | Difference (amu) | Difference (ppm) | |
|---|---|---|---|---|
| S2 ·− | 63.9448 | 63.9469 | 0.0021 | 33 |
| S3 ·− | 95.9168 | 95.917 | 0.0002 | 2 |
| S4 ·− | 127.889 | 127.9057 | 0.0167 | 131 |
| S2O3 ·− | 111.9294 | 111.9312 | 0.0018 | 16 |
| HS2O3 − | 112.9367 | 112.9398 | 0.0031 | 27 |
| HSO4 − | 96.9596 | 96.9599 | 0.0003 | 3 |
UltraHPLC‐MS/MS set‐up
(Figure 3, Supporting Information Figures S1–S4, Scheme S1 and Table S1) Polysulfide solutions were prepared as before by addition of pre‐weighed dry powder standards to ultra‐pure water using either K2Sx, Na2S2, Na2S3 or Na2S4. The polysulfide solution was then diluted 100‐fold in different concentrations of either NEM or IAM (0.5, 1.0, 2.0, 5.0, 9.9, 39.6, 79.2 and 99.0 mM) in pH 7.4 ammonium phosphate buffer. In a separate set of experiments aimed at providing insight into the speed and pH sensitivity of polysulfide equilibration before derivatization, NEM and IAM alkylation reactions of polysulfide solutions were compared side by side using three different procedures: (i) direct addition of accurately weighed dry polysulfide material to an appropriate volume of NEM‐ or IAM‐containing buffer pH 7.4; (ii) dissolution of dry polysulfides in ultrapure water (yielding an alkaline stock solution), dilution in buffer pH 7.4, followed by derivatization; and (iii) dissolution of dry polysulfides in buffer pH 7.4, followed by derivatization after a defined period of equilibration (see the Supporting Information for details).
Figure 3.

UHPLC‐MS detection of alkylated inorganic polysulfides. (A) Exemplary chromatograms for NEM‐derivatized polysulfides in stacked view, in the order of increasing sulfurs from S1 at the bottom to S4 at the top. (B) Exemplary chromatograms for IAM‐derivatized polysulfides in stacked view, in order of increasing sulfurs from S1 at the bottom to S7 at the top. Relative amounts of different chain length polysulfide species derivatized with increasing concentrations (0.5–98 mM) of (C) NEM or (D) IAM. Difference in polysulfide speciation using different preparation methods of Na2S4 with NEM (E) and IAM (F). Conditions: (A–D) Polysulfide solutions were made by dissolving 10 mM Na2S3 in ultra‐pure water at 20°C. Alkylating agent (NEM or IAM) concentrations were 0.5, 1.0, 2.0, 4.9, 9.8, 9.8, 39.2 and 98 mM respectively. Alkylating agents were added 5 min after dissolving the inorganic polysulfide salt. Data were recorded after 10 min incubation with the alkylating agents and are representative of n = 5 experiments with similar results. (E and F) Condition 1: Na2S3 dissolved directly in NEM or IAM containing buffer. Condition 2: Na2S3 dissolved in ultra‐pure water then diluted in NEM or IAM containing buffer. Condition 3: Na2S3 dissolved in ultra‐pure water then diluted in buffer then diluted in NEM or IAM containing buffer. For specific details, see the Supporting Information.
To test the potential ability of NEM to attack the middle of, or break up polysulfide chains, 1.9 mg Na2S4 was added to 10 mL IAM in ammonium phosphate buffer (10 mM IAM, final concentration of Na2S4 1.09 mM) and allowed to react at room temperature (RT) for 10 min. An extension of the incubation time for IAM alkylation to 60 min did not change the outcome of the results. One hundred microlitres of this solution was then added to 900 μL of 10 mM NEM and left at RT for a further 10 min and analysed.
The polysulfide composition was analysed by ultra‐high performance liquid chromatography (UHPLC)‐MS/MS using a Waters Aquity UPLC system coupled with a Xevo TQ‐S detector. Mobile phase A consisted of H2O with 5 mM ammonium acetate; mobile phase B was 95% acetonitrile and 5% H2O with 5 mM ammonium acetate. An Aquity UPLC CSH C18 (1.7 μm), 2.1 × 100 mm column was used for the separation using a chromatographic gradient starting at 95% A and decreased to 40% A over 5 min; the gradient then returned to 95% A over 1 min and was held for a further min to equilibrate the column. The flow rate was 0.2 mL·min−1, column temperature was 30°C and the injection volume was 5 μL. Alkylated polysulfide species were detected using multiple reaction monitoring (MRM) mode using the precursor and product ion pairs described in the Supporting Information. For the NEM‐derivatized species, a cone energy of 8 V and a collision energy of 14 V were used. For the IAM‐derivatized species, the cone energy was 8 V, and collision energy was 12 V.
Alternate chromatographic separation for validation purposes (Figure 3E, F, Supporting Information Figures S2 and S3 and Supporting Information Scheme S1) was performed using the same chromatographic system and utilizing the same MS detection. Mobile phase A consisted of H2O with 5 mM ammonium formate and 0.15% formic acid, and mobile phase B consisted of 95% acetonitrile, 5% H2O with 5 mM ammonium formate and 0.15% formic acid. A 1.6 μm Modus 100 × 2.1 mm Aqua mixed mode UHPLC column was used for the separation using a chromatographic gradient starting at 99% A and decreasing to 60% A over 4.5 min; the gradient was then decreased to 0% A over 0.5 min and held for 1.5 min before increasing back to 99% A over 0.5 min and being held at 99% A for a further 1.0 min to equilibrate the column. The flow rate was 0.2 mL·min−1, column temperature 30°C and the injection volume 5 μL. For MRM parameters, see Supporting Information Table S1A.
Quantitative HPLC/MS‐MS analysis of alkylated cysteine and GSH polysulfur species
(Figures 4, 5, 6 and Supporting Information Figures S5–S8) ß‐(4‐Hydroxyphenyl)ethyl iodoacetamide (HPE‐IAM), MBB and NEM stock solutions (1 M) were prepared by dissolving the appropriate amount of solid chemicals in DMSO with further dilution in the indicated aqueous media. Polysulfidated cysteine or GSH species were prepared by mixing 100 μM cysteine or GSH with 300 μM Na2S2 in 30 mM HEPES/KOH buffer (pH 7.5) at RT for 5 min. Then, samples were incubated with 0.1–10 mM alkylating agent (0.1, 0.5, 1, 5 and 10 mM HPE‐IAM, MBB or NEM, respectively) at RT for 30 min, 60 min, 3 h or 6 h. After alkylation, samples were diluted with 0.1% formic acid (25‐fold dilution), and LC‐ESI‐MS/MS analysis was performed on a triple quadrupole (Q) mass spectrometer LCMS‐8050 (Shimadzu, Kyoto, Japan) coupled to the Nexera UHPLC system (Shimadzu) after addition of the appropriate internal standards. Persulfide/polysulfide derivatives were separated by a Nexera UHPLC with a YMC‐Triart C18 column (50 × 2.0 mm inner diameter) under the following elution conditions: mobile phases A (0.1% formic acid) with a linear gradient of mobile phases B (0.1% formic acid in methanol) from 5 to 90% for 15 min at a flow rate of 0.2 mL·min−1 at 40°C. The temperatures of the ESI probe, desolvation line and heat block were 300, 250 and 400°C, respectively, and the nebulizer, heating and drying nitrogen gas flows were set to 3, 10 and 10 L·min−1 respectively. Various persulfide/polysulfide derivatives were identified and quantified by means of MRM according to our previous report (Akaike et al., 2017). MRM parameters of various persulfide/polysulfide derivatives used for LC‐MS/MS analyses are shown in Supporting Information Table S1. Three different samples were prepared on three independent days for each condition.
Figure 4.

Quantitative measurement of derivatized cysteine (Cys), GSH and inorganic polysulfide species, where derivatization was by 0.1–10 mM HPE‐IAM (A–D) or by 0.1–10 mM NEM (E–H). Thiol, persulfide and trisulfide adducts of (A) cysteine or (B) GSH, treated with Na2S2 and then incubated with HPE‐IAM for 3 h. (C and D) The corresponding dialkyl sulfide or inorganic polysulfide adducts in the solutions of (A and B) respectively. HPE‐IAM had little effect on the speciation of the alkylated cysteine and GSH persulfide species, but the alkylated trisulfide concentrations detected increased with the added HPE‐IAM concentration. Thiol, persulfide and trisulfide adducts of (E) cysteine or (F) GSH, treated with Na2S2 and then incubated with NEM for 3 h. Higher concentrations of NEM‐captured GSH persulfides were observed than cysteine persulfides, with only a negligible effect of the concentration of NEM. (G and H) The corresponding dialkyl sulfide or inorganic polysulfide adducts in solutions of (E and F) respectively. Quantitation of sulfur species was achieved by using isotopically labelled internal standards as detailed in Methods. Data points represent the average of n = 3 independent experiments with the corresponding error bars showing the SD. (Three different samples were prepared on three independent days for each condition.) Conditions: 100 μM cysteine/GSH was treated with 300 μM Na2S2, at RT for 5 min, then incubated with 0.1–10 mM HPE‐IAM or NEM at RT for 3 h. Samples were prepared in 30 mM HEPES/KOH buffer (pH 7.5).
Figure 5.

Relative quantities of derivatized cysteine and GSH and their persulfide and trisulfide analogues measured using different alkylating agents. (A) HPE‐IAM and MBB alkylated cysteine persulfides and trisulfides were readily detected, while NEM is likely to cleave polysulfur chains and form thiol adducts instead. (B) The same phenomenon was observed in the case of the respective GSH species, except NEM showed increased affinity and less S–S bond cleaving potential for GSH persulfide compared with cysteine persulfide. Quantitation of sulfur species was achieved by using isotopically labelled internal standards as detailed in Methods. Data points represent the average of n = 3 independent experiments with the corresponding error bars showing the SD. (Three different samples were prepared on three independent days for each condition.) Conditions: 100 μM cysteine/GSH was treated with 300 μM Na2S2, at RT for 5 min, then incubated with 10 mM alkylating agent at RT for 3 h. Samples were prepared in 30 mM HEPES/KOH buffer (pH 7.5).
Figure 6.

MBB‐induced changes in sulfur speciation can confine sulfide detection in blood serum or plasma samples. (A) Representative kinetic trace for the sulfide levels measured using the monobromobimane method in a 100 μM sulfide solution. The reaction was carried out at pH 8.2 with a final concentration of 1.1 mM MBB at RT. The data points measured fit perfectly to a first‐order kinetic equation (black line), and it is clearly seen that the reaction completes in less than 10 min. (B) Kinetics of sulfide dibimane formation in blood serum or plasma samples during sulfide measurement with the monobromobimane method. Five different plasma or serum samples were derivatized under similar conditions as the sulfide standard solution in (A). The constantly increasing amounts of sulfide detected compared with (A) suggest that the kinetic curves observed represent the extraction of sulfide from the biological sulfide pool (Nagy et al., 2014) instead of direct alkylation of free sulfide. Moreover, the MBB concentration‐dependence of sulfide dibimane formation in a representative blood serum sample (inset in B) indicates that the sulfide levels detected using the monobromobimane method depend not only on the incubation time but also on the concentration of the alkylating agent. Conditions are detailed in the Methods section.
Detection of sulfide in human serum or plasma
(Figure 6) Peripheral venous blood was collected from the antecubital vein of healthy human adults following informed consent using a procedure approved by the Hungarian National Ethics Committee (file number BPR‐021/00084‐2/2014). Blood samples were collected into serum or EDTA collection tubes. EDTA blood was immediately centrifuged at 3000× g for 10 min, and serum was obtained after centrifugation of blood that was allowed to clot at RT for 30 min. The supernatant serum or plasma samples were aliquoted into equal volumes and stored at −80°C until use.
To follow the kinetics of sulfide–dibimane formation (the product of MBB‐derivatized sulfide, which is measured during the monobromobimane method for sulfide detection, Nagy et al., 2014) in blood samples or standard sulfide solutions, 250 μL of plasma, serum or 100 μM H2S stock solution was mixed with 650 μL of 200 mM HEPES buffer, pH 8.2, and 10 μL of 100 mM MBB in acetonitrile. The derivatization reaction proceeded in the dark at RT. After defined time periods, 70 μL aliquots from the reaction mixtures were withdrawn and mixed vigorously with 5 μL 50% trichloroacetic acid to stop the alkylation process. Samples were centrifuged (30 000× g per 5 min), and the supernatants were stored in the autosampler in dark vials at 5°C.
A Thermo Ultimate 3000 HLPC system equipped with fluorescent detector was used with a Zorbax Eclipse XDB‐C18 column (250 × 4.6 mm, 5 μm; Agilent Technologies, Santa Clara, CA, USA) for the separation of the analytes. Ten microlitres of the derivatized sample was injected and eluted using a 35 min long gradient profile consisting of 0.1% of formic acid (A) and 0.1% of formic acid in acetonitrile (B) at a 1 mL·min−1 flow rate. The gradient profile started with 15% B and increased to 30% in 3 min. After 8 min of isocratic elution, the composition increased to 90% B in 2 min and stayed there for another minute before returning to the initial 5% B. The fluorescence detector was set to 390 nm (excitation wavelength) and 475 nm (emission wavelength) to detect and quantitate the product sulfide dibimane. Sulfide concentrations were calculated based on calibration curves established using derivatized standard sulfide solutions in water together with calibration blanks (deionized water). Standards (1–5 μM) were prepared by serial dilution of a 50 μM derivatized stock using deionized water.
Biotin–polyethylene glycol‐conjugated–maleimide labelling gel shift assay for GAPDH
(Figure 7) The assay was performed as reported previously with slight modifications (Jung et al., 2016; Akaike et al., 2017). Briefly, purified recombinant human GAPDH (stored at −80°C) was applied to a PD SpinTrap G‐25 column (GE Healthcare, Little Chalfont, UK) previously equilibrated with RIPA buffer (10 mM Tris–HCl, 1% NP‐40, 0.1% sodium deoxycholate, 0.1% SDS and 150 mM NaCl, pH 7.4) to remove reductants. Desalted protein samples were incubated with 1 or 10 mM Na2S2 or Na2S3 at 37°C for 1 h. After incubation, excess inorganic polysulfides were removed by a second desalting step (same conditions as the first). Protein quantification was performed by the bicinchoninic acid assay to normalize the total protein content of each sample. Sulfhydryl groups were labelled by incubation with 2 mM biotin–PEG36–maleimide (Dojindo Laboratories) reagent in RIPA buffer at 37°C for 1 h. The labelled protein samples were subsequently incubated with various electrophile agents (IAM, MBB, NEM and DTNB, 3 mM each) at 37°C for 1 h. Samples were stored at −20°C after heating them to 95°C for 5 min in the presence or absence of 5% 2–mercaptoethanol (2‐ME). The next day, SDS‐PAGE and CBB staining were performed to assess the ability of the electrophiles (added after the biotin–PEG 36–maleimide labelling) to cleave dialkyl polysulfur chains as reported previously (Jung et al., 2016; Akaike et al., 2017).
Figure 7.

PMSA performed on human recombinant GAPDH showing the abilities of different chemicals to cleave alkylated protein polysulfide chains. All SDS‐PAGE gels, developed to detect GAPDH polysulfide species that were generated under different conditions, showed similar patterns, indicating that the initial polysulfide treatment had no impact on the polysulfide speciation observed. NEM was the most efficient among the alkylating agents applied to cleave the already alkylated cysteine polysulfide residues on the protein, MBB came next and IAM had no cleaving effect. The fact that NEM and 2‐mercaptoethanol or DTNB treatments showed a similar pattern suggests that NEM cleaved all cysteine polysulfide chains, corroborating our previous observations. Human recombinant GAPDH (A) control sample with no polysulfide treatment or treated with (B) 0.1 mM Na2S2, (C) 1 mM Na2S2, (D) 0.1 mM Na2S3 or (E) 1 mM Na2S3 then labelled with biotin–PEG–maleimide, followed by incubation with various electrophile agents (IAM, MBB, NEM and DTNB respectively) or 2‐mercaptoethanol. Conditions: 1 h incubation with 0.1 mM or 1 mM Na2S2/Na2S3 at 37°C followed by 1 h incubation with 2 mM biotin–PEG–maleimide at 37°C, then 1 h incubation with 3 mM alkylation agent (IAM, MBB, NEM and DTNB) at 37°C. Samples were heated in the presence or absence of 5% 2‐mercaptoethanol, then separated by SDS‐PAGE and stained using CBB. Samples were prepared in 10 mM RIPA buffer (pH 7.4).
Dimedone labelling of GAPDH‐(S)n‐OH species and their detection
(Figure 8) GAPDH was incubated with 5 mM DTT at 4°C for 30 min and then desalted with a Zeba desalting spin column. Protein content was quantified by the Bradford assay, before and after the prereduction step. Fifty millimolar dimedone (final concentration) was added to the protein samples at RT. Within 1 min, samples were treated with 200 μM of H2O2 or Na2S2 or equal volume of buffer and incubated at RT for 60 min. Samples were digested with 14.4 mg·mL−1 pronase at 37°C for 60 min, then 50% TCA was added, followed by vortexing and centrifuging at 3000× g for 5 min. Supernatants were collected, and LC/MS‐MS analysis was performed on a Thermo LTQ‐XL linear ion‐trap mass spectrometer coupled to the Thermo Ultimate 3000 HPLC system. Fifty microlitres of the samples were injected onto a Kinetex C18 column (50 × 2.1 mm, 2.6 μm; Phenomenex, Torrance, CA, USA) and eluted using 0.1% formic acid in water (A) and 0.1% formic acid in methanol (B). The gradient started with 5% B linearly increasing to 95% in 15 min. Dimedone products were identified in positive ionization mode and quantified by single‐ion monitoring.
Figure 8.

Normalized levels of cysteine‐dimedone (CysSDim) and cysteine–persulfide/polysulfide‐dimedone (CysS‐SxDim x = 1–3) adducts in digested GAPDH samples after treatment with hydrogen peroxide or inorganic polysulfides with or without prealkylation with IAM. (A) More dimedone‐labelled cysteine polysulfide derivatives were detected when the isolated protein was treated with inorganic polysulfides compared with H2O2‐treated or untreated samples. Remarkably, significant amounts of cysteine persulfide dimedone adducts were measured, despite a prereduction, which could be attributed to GAPDH cysteine residues that are not exposed to the solution (and hence not reduced during the prealkylation step, see Figure 7). Data points represent the average of n = 5 independent experiments with the corresponding error bars showing the SEM. (Samples were prepared on three independent days for each condition.) (B) A decrease, by several orders of magnitude, in all dimedone adducts was observed in prealkylated samples, which suggests that alkylation with IAM can effectively hinder sulfenic acid formation/detection. Data points represent the average of n = 5 independent experiments with the corresponding error bars showing the SEM. All peak areas were normalized to the average areas of the cysteine‐dimedone in untreated samples without prealkylation (Figure 8A, CysSDim). Conditions are detailed in the Methods section.
For the prealkylation experiments, after prereduction with DTT and desalting, samples were treated with 200 μM of H2O2 or Na2S2 at RT for 2 min, then incubated with 20 mM HPE‐IAM at RT for 20 min. HPE‐IAM excess was removed by desalting with a Zeba desalting spin column, and then samples were incubated with 50 mM dimedone at RT for 60 min. Pronase digestion and LC/MS‐MS analysis was performed as previously mentioned. All treatments were carried out at pH 7.40, and dilutions were performed in 100 mM phosphate buffer containing 100 μM 5,5'–dithiobis–(2–nitrobenzoic acid) (DTPA).
Equilibrium analyses and competitive trapping of GSH polysulfur species
NMR analyses
(Figure 9) NMR analyses were performed using an Agilent 400 MHz NMR spectrometer. Water suppression for all samples was achieved using an (1H) Presat method of vnmrj software. All NMR solvents were 10% D2O in phosphate buffer (100 mM, pH 7.4) containing 1 mM 4,4‐dimethyl‐4‐silapentane‐1‐sulfonic acid (DSS) as an internal standard. Stock solutions of glutathione disulfide (GSSG) (100 mM) and NaSH (50 and 100 mM) were prepared in phosphate buffer (100 mM, pH 7.4). DSS (internal standard) stock solutions (10 mM) were prepared in D2O.
Figure 9.
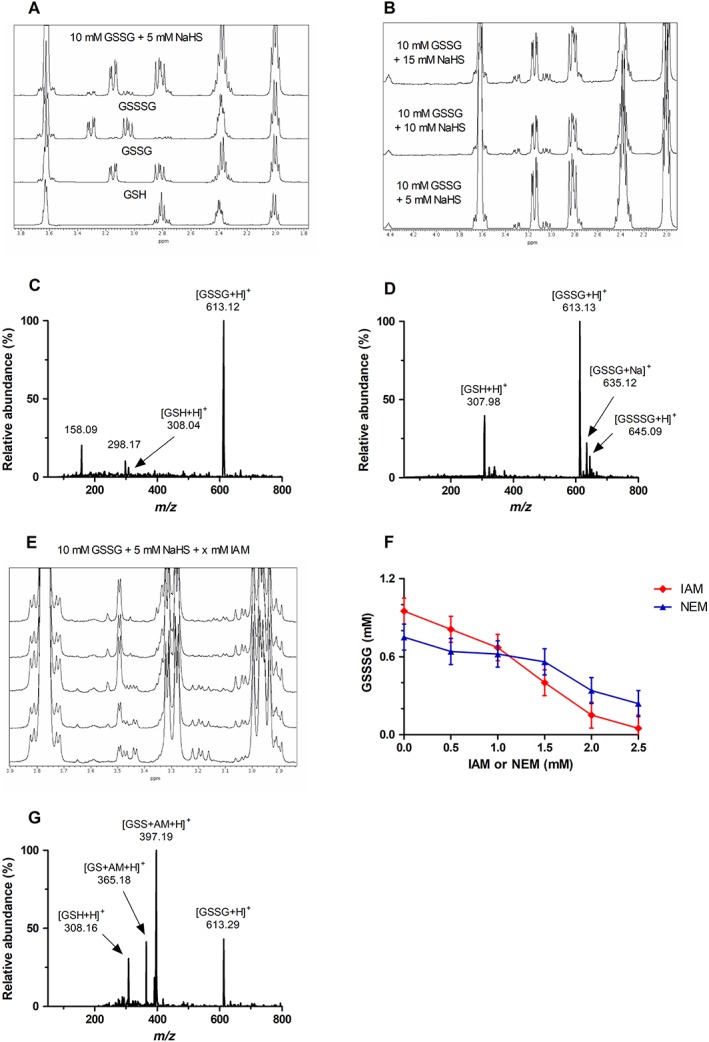
1H‐NMR and direct infusion MS measurements for detecting GSH polysulfide speciation in the absence or in the presence of IAM or NEM. (A) Region selected for the stacked 1H‐NMR spectra of GSH, GSSG, GSSSG and GSSG + NaSH, as indicated. The new peaks formed after equilibration of GSSG with NaSH correspond to GSSSG (δ = 3.16–3.22 and 3.43–3.48 ppm), as indicated by comparison with standard GSSSG. (B) Region selected for the stacked 1H‐NMR spectra of GSSG samples incubated with increasing additions of NaSH. Increasing addition of NaSH caused subsequent increases in the amount of GSSSG (δ = 3.16–3.22 and 3.43–3.48 ppm) and GSH (δ = 4.56 ppm) produced. (C) ESI‐MS spectra of GSSG. (D) ESI‐MS spectra of GSSG equilibrated with NaSH. The species identified are indicated in each spectrum. (E) Region selected for 1H‐NMR spectra of GSSG + NaSH with increasing additions of IAM (bottom to top spectrum, respectively). Increasing addition of IAM causes subsequent decreases in the concentration of GSSSG (δ = 3.16–3.22 and 3.43–3.48 ppm), likely because IAM is competitive with GSSG for the trapping of the intermediate GSSH. (F) Concentration of GSSSG in equilibrated samples of GSSG and NaSH as a result of increasing exogenous addition of the electrophiles IAM and NEM. Data points represent the average of n = 3 independent experiments with the corresponding error bars showing the SEM. (G) ESI‐MS spectrum resulting from the addition of IAM to an equilibrated solution of GSSG + NaSH. Addition of IAM reacts and traps GSH ([GS + AM + H]+) and GSH persulfide (GSSH, [GSS + AM + H]+). Conditions: For 1H‐NMR measurements, 10 mM GSSG was incubated with 5–15 mM NaSH at RT for 30 min, followed by incubation with 1–5 mM IAM at RT for 1 h for derivatization measurements. Spectra were measured in 100 mM phosphate buffer (pH 7.4) with 10% D2O and 1 mM DSS as an internal reference. For ESI‐MS measurements, 1 mM GSSG was incubated with 0.5 mM NaSH at RT for 30 min, followed by the addition of 0.5 mM IAM and incubation at RT for 1 h for derivatization measurements. Spectra were measured in 50 mM ammonium bicarbonate buffer (pH 7.4).
To investigate the NaSH/GSSG equilibrium, 10 mM GSSG was mixed with 5, 10 or 15 mM NaSH in the NMR tube. Measurements were performed after 30 min equilibration at RT.
Competitive trapping of persulfides was achieved by incubating 5 mM NaSH with 10 mM GSSG in phosphate buffer (100 mM, pH 7.4) containing 1 mM DSS in an NMR tube. Reaction mixtures were equilibrated for 30 min at RT. IAM or NEM (0.5, 1, 1.5, 2 or 2.5 mM) was then added, and reactions were allowed to proceed at RT for 1 h, followed by 1H‐NMR analyses.
MS analyses
(Figure 9) Mass spectra were recorded using a Thermo Triple Quadrupole ESI‐MS operating in positive ion mode and controlled with XCalibur 2.1 software. Samples were directly injected via a syringe pump at a flow rate of 5 μL·min−1 using N2 as a sheath gas and Ar as a collision gas. Ion optics were optimized using authentic samples of disulfides. The capillary temperature was 250°C, and spray voltage was 2500 V. Stock solutions of GSSG (100 mM) and NaSH (50 mM) were prepared in ammonium bicarbonate buffer (50 mM, pH 7.4).
The NaSH/RSSR equilibrium was investigated by mixing 1 mM GSSG with 0.5 mM NaSH in ammonium bicarbonate buffer (50 mM, pH 7.4), and solutions were incubated at RT for 30 min before ESI‐MS analysis.
The competitive trapping of persulfides was achieved by adding the indicated amounts of IAM or NEM to the above reaction mixtures and then allowing the reactions to proceed for one more hour at RT, followed by ESI‐MS analysis.
Inorganic polysulfide speciation in non‐aqueous systems
UV–Vis measurements
(Figure 10) UV–visible (UV–Vis) measurements were performed on a Cary 100 spectrophotometer equipped with a Quantum Northwest cuvette temperature controller under anaerobic conditions. A 20 mM stock solution of S8 was prepared in dry, air‐free, deuterated tetrahydrofuran; stock solutions of NBu4SH (20, 40, 60, 80 and 160 mM) were made in dry air‐free deuterated acetonitrile. Inorganic polysulfide solutions were prepared by mixing 0.5 mL of S8 stock solution with 0.5 mL of the NBu4SH solutions. The mixture was charged in either a septum‐sealed short path quartz cuvette or into a small GC vial. Gas‐tight Hamilton syringes were used for all solution transfers. Cuvettes were heated at 60°C until the UV–Vis spectra equilibrated; this was required to fully solvate the polysulfide mixture. Then, spectra were collected at 40 and 25°C after a 15 min equilibration period. Cuvettes were shaken before collecting spectra.
Figure 10.

UV–Vis spectra of polysulfides as a function of temperature in organic media. (A) UV–Vis spectra show changes in speciation of polysulfides as a function of temperature in organic media in a mixture with molar ratios of S8 over NBu4SH of (A) 1:1, (B) 1:2, (C) 1:3 and (D) 1:8. Conditions: 10 mM S8 in dry, air‐free deuterized tetrahydrofuran; 10–80 mM NBu4SH in dry, air‐free deuterized acetonitrile, T = 25, 40 and 60°C.
1H‐NMR measurements
(Table 2) NMR spectra were acquired on a Bruker Avance‐III‐HD 600 spectrometer with a Prodigy multinuclear broadband CryoProbe. Polysulfide solutions in sealed GC vials were heated in a 60°C sand bath while stirring for 1 h. After 1 h, the sand bath temperature was either not changed or set to 40 or 25°C. Once target temperatures were reached, the polysulfides were electrophilically trapped by the addition of triethylamine (6 equivalents) and benzyl chloride (6 equivalents). Dry DCM (1.3 μL) was added as a standard. The reaction mixtures were analysed in an oven‐dried NMR tube sealed with septa caps.
Attempt to trap sulfur‐centred radical species using DMPO upon potential homolytic cleavage of polysulfide species
To trap sulfur‐centred radicals generated by the homolytic cleavage of the sulfur–sulfur bonds in persulfides and polysulfides, 5,5‐dimethyl‐1‐pyrroline‐N‐oxide (DMPO) was used as a trapping agent.
To investigate whether alkylated polysulfide species can undergo homolytic S–S bond cleavage, we used alkylated GSH persulfides and polysulfides, which were prepared by mixing 20 mM GSH with 60 mM Na2S2 in 200 mM HEPES/HCl pH 7.5 for 5 min at RT. Next, the samples were alkylated with 40 mM IAM for 15 min at RT before the addition of 20 mM DMPO. The mixtures were placed in autosampler vials at 5°C, and 50 μL sample aliquots were injected every 40 min for 4 h.
The measurements were carried out on a Thermo Ultimate 3000 HLPC system with a Kinetex C18 column (50 × 2.1 mm, 2.6 μm; Phenomenex) connected to a Thermo LTQ‐XL linear ion‐trap mass spectrometer. The samples were eluted using 0.1% formic acid in water (A) and 0.1% formic acid in methanol (B). The gradient started with 5% B linearly increasing to 95% in 15 min. DMPO adducts were monitored in positive ionization mode. The monitored parent m/z values were the following: 421 and 419 for GS‐DMPO as hydroxylamine and nitrone adducts, respectively, and 114 for DMPO.
To investigate whether non‐alkylated polysulfide species can undergo homolytic S–S bond cleavage, we used (GSH) persulfide and polysulfide species, which were prepared by treating 1 mM GSH with 1 mM Na2S2 in 200 mM HEPES/HCl pH 7.5 for 5 min at RT. Next, 50 mM DMPO was added to the solution. Samples were injected directly into the mass spectrometer, and detection of DMPO adduct formation was attempted in positive ionization mode.
Data analyses
The data and statistical analysis comply with the recommendations on experimental design and analysis in pharmacology (Curtis et al., 2018). Data analysis for the experiments described in Figure 3 and Supporting Information Figure S3 were performed using Microsoft Excel and GraphPad Prism (GraphPad Software Inc., San Diego, CA, USA). For the experiments in Figures 4 and 5 and Supporting Information Figures S5–S8, data analysis was carried out using Microsoft Excel, plotted values show the averages and the corresponding error bars represent their SD. Data for the experiments in Figures 6 and 8 were fitted or evaluated using GraphPad Prism. Values on Figure 8 represent the average of data points, while the error bars show their SEM. Data on Figure 9F show the average of three experiments, and the error bars represent their SD at each data point.
Materials
Most reagents, including anhydrous sodium sulfide (Na2S) and sodium hydrosulfide (NaSH), were purchased from Sigma‐Aldrich (Budapest, Hungary or Gillingham, UK), Nacalai Tesque (Kyoto, Japan), Wako Pure Chemical Industries (Osaka, Japan) or Invitrogen (Carlsbad, CA, USA). The sodium polysulfide salts defined were provided by Dojindo Laboratories (Munich, Germany and Kumamoto, Japan). Tetrabutyl ammonium sulfide (NBu4SH) was prepared as described in the literature (Hartle et al., 2015). Sulfide stock solutions were prepared as previously described (Nagy et al., 2014). Polysulfide stock solutions were prepared in either ultra‐pure water or in the indicated buffer by dissolving technical potassium polysulfide (K2Sx; a mixture of polysulfides of different chain lengths), sodium disulfide (Na2S2), sodium trisulfide (Na2S3) or sodium tetrasulfide (Na2S4) salts. All solutions were prepared fresh immediately before use in experiments.
Nomenclature of targets and ligands
Key protein targets and ligands in this article are hyperlinked to corresponding entries in http://www.guidetopharmacology.org, the common portal for data from the IUPHAR/BPS Guide to PHARMACOLOGY (Harding et al., 2018), and are permanently archived in the Concise Guide to PHARMACOLOGY 2017/18 (Alexander et al., 2017).
Results and discussion
Speciation of inorganic polysulfide species
Inorganic polysulfide species have been suggested to be important mediators in biology (Greiner et al., 2013; Kimura, 2017). They can be generated during mitochondrial oxidative catabolism (Powell and Somero, 1986; Bouillaud and Blachier, 2011; Jackson et al., 2012; Modis et al., 2014; Szabo et al., 2014; Mishanina et al., 2015), by metalloprotein‐catalysed oxidation of sulfide (Palinkas et al., 2015; Bostelaar et al., 2016; Padovani et al., 2016; Garai et al., 2017; Olson et al., 2017; Vitvitsky et al., 2017) or by reaction of sulfide with NO (Cortese‐Krott et al., 2015). Although direct oxidation of sulfide by ROS is relatively slow in many cases (Carballal et al., 2011), the neutrophilic oxidant, hypochlorous acid (HOCl), can oxidize sulfide with a nearly diffusion‐controlled rate to produce inorganic polysulfides, which could be a relevant route of polysulfide production under certain biological conditions (e.g. at sites of inflammation) (Nagy and Winterbourn, 2010a). On mechanistic grounds, sulfide oxidation reactions most likely proceed via a sulfenic acid intermediate species (S–OH, just as in the case of cysteine).
| (1) |
However, HS–OH has not yet been experimentally characterized by any means in biologically relevant oxidation processes of sulfide, likely due to its high reactivity and short‐lived nature, although a recent study claims to have trapped HSOH and other oxidized sulfur species upon sulfide oxidation (Kumar and Farmer, 2018). The trapping methodology with alkylating agents applied in this latter study raises similar issues that are the subject of the present paper (e.g. the trapped HSOH could have originated from the hydrolysis of polysulfides, as proposed in Reaction 11; see below). The sulfenic acid that is generated in Reaction 1 is expected to react rapidly with another sulfide molecule to produce a disulfide species (in analogy to the reaction of cysteine‐SOH with cysteine as we reported earlier, Nagy and Ashby, 2007), which can then further react via disproportionation and/or conproportionation reactions to provide a mixture of longer‐chain polysulfides (Equations (2)–(6) for illustration; many more reactions are possible. Differently charged states of the reactant/product species were not included for the sake of simplicity.):
| (2) |
| (3) |
| (4) |
| (5) |
| (6) |
(11).

Although the first report of inorganic polysulfides by Scheele dates back to 1777 (Scheele, 1777), and Berzelius crystallized the first polysulfide salt as early as 1822 (Berzelius, 1822), the solution inorganic chemistry of polysulfides is still not well understood. For example, the number of sulfur atoms in the longest possible polysulfide chain in aqueous media is still debated. Some say that it should be below 5 (Maronny, 1959; Giggenbach, 1972; Licht et al., 1986; Licht, 1987), and others argue that HS6 − also has measurable stability (Cloke, 1963; Boulegue and Michard, 1978). Based on MS measurements, Gun et al. (2004) recently proposed that the number of sulfurs can reach even up to 9 in inorganic polysulfide chains. One reason for these controversial reports could be that interconversion of polysulfides can rapidly occur. The fact that a number of different polysulfides are typically present in solution at any given condition makes characterization of these species by UV, IR or Raman spectroscopy and chromatographic separation challenging. Hence, most studies that measure polysulfide speciation in solution use a derivatization step before separation and detection. However, MS can in principle distinguish between polysulfides of different chain length even in the absence of chromatographic separation. Therefore, we used ESI‐based MS (for conditions, see Methods) to investigate speciation in polysulfide solutions without derivatization by direct infusion of the solutions into the source. Due to their low pKa (Steudel, 2003a; Steudel, 2003b; Nagy, 2015; and hence good ionizability) polysulfides were detected in negative ionization mode during these experiments. We found that the dissolution of sodium trisulfide, tetrasulfide and mixed potassium polysulfide salts in ultra‐pure water all result in similar speciation patterns (Figure 1A–C).
Consistent with our previous investigations (Cortese‐Krott et al., 2015), the m/z of the most abundant species observed was the trisulfide radical anion (S3 •−). In addition, the peaks at m/z of ~64 and 128 were indicative of disulfide and tetrasulfide radical ion species (S2 •− and S4 •−) formation. In order to confirm the tentative assignment of these polysulfide species as radical anions, we used high‐resolution MS. The resolution of the ToF‐MS used was sufficient to distinguish the additional mass of the electron (0.00054 amu) in a radical ion. Figure 1D shows the full mass spectrum (m/z 50–150) of a similar polysulfide solution as Figure 1A–C, recorded using the high‐resolution SYNAPT G2‐Si ESI‐ToF‐MS.
The peaks for the three polysulfide radical anions observed in the triple quadrupole experiments were detected at m/z 63.9469 for S2 •−, 95.9170 for S3 •− and 127.9057 for S4 •−. There was also a mass peak detected for a thiosulfate radical anion at m/z 111.9312 and the protonated thiosulfate anion at m/z 112.9398. The peak at m/z 96.9599 corresponds closely to HSO4 − (see Table 1 for details), while the peak with m/z = 128.9178 does not appear to be related to any protonated polysulfide anion (based on the exact mass and the isotope distribution pattern).
The exact calculated masses for the three polysulfide radical ions are as follows: S2 •− m/z 63.9448, S3 •− m/z 95.9168 and S4 •− m/z 127.8890. The closest in mass among the detected peaks is the S3 •− with a mass difference of only 0.0002 amu. The larger deviations from the theoretical masses of S2 •− and S4 •− (Table 1) may be due to the lower abundances of these two species; moreover, the mass of S2 •− is close to the lower range of the ToF‐MS (m/z 50) and detection compounded by the associated loss of resolution at that range.
To confirm that the m/z measured indeed represents radical anions as opposed to doubly charged anions with twice the number of sulfurs, we investigated the isotope distribution patterns of these species. Due to the difference in atomic mass between 34S and 32S (1.9958 amu) and the low natural abundance of 33S (0.75%), this can be used as an indicator of the charge states of the species detected, since doubly charged species would show isotope peaks at M + 1 and singly charged species at M + 2. Figure 1E shows an expanded section of the spectrum showing the suggested S3 •− peak and its +2 isotope peak at m/z 97.9128. If the peak at m/z 95.9168 was representative of a doubly charged anion (S6 2−), there would be a +1 isotope peak present with an intensity of ~12% of the parent peak. However, the spectra does not show a +1 isotope peak, but instead shows a +2 isotope peak at m/z 97.9128 with an exact difference of 1.9958 amu from the parent peak. Likewise, Figure 1F shows the same for S4 •−, again with no +1 isotope peak present but a corresponding +2 isotope peak at m/z 127.9001 with a mass difference of 1.9944 amu from the parent peak. This isotope distribution pattern rules out the possibility of the observed m/z originating from doubly charged polysulfide anions. No isotope peak was observed for S2 •−, likely due to its low signal intensity. There were also no M + 4 isotope peaks observed, which is not unexpected as the abundance of these species would be low enough to fall into the noise in the spectrum.
The high‐resolution MS experiments strengthen the previous assignment of the aqueous polysulfide species as radical anions. However, as a point of caution, we note that the SYNAPT G2‐Si ESI‐ToF‐MS uses the same ESI source as the triple quadrupole mass spectrometer used in the previous experiments. Therefore, if the polysulfide radical ions originated in the source or were due to the mechanism of ionization, then no differences in the apparent speciation would be expected between these two experiments. Of note, we observed no major changes in speciation upon changing some MS parameters (source temperature, voltage and flow rate). In agreement with this experimental experience, Gun et al. (2004) also found that the source voltage and temperature had no observable effect on the speciation of polysulfide species. However, at their applied conditions, they detected primarily longer‐chain polysulfides and did not report the presence of any radical species. Their argument for the preferential detection of longer‐chain polysulfides was that the charge of the detected ions is more evenly distributed on longer‐chain polysulfides, which makes them more stable. They also argue that the distribution of the detected species is affected to a larger extent by their gas phase distribution, rather than solution stability. However, they used very long incubation times (12 h) to equilibrate polysulfide speciation. Our own experience with polysulfide solutions indicates that most of the open‐chain polysulfide species are much less stable at pH 7.4 and would not survive these long incubation times. Polysulfides with >5 sulfurs have the ability to reside as homocyclic species, which have larger thermodynamic stabilities than their open‐chain isomers under the applied conditions (Donohue, 1961). Therefore, we speculate that due to the long incubation times applied by Gun et al. (2004), it is conceivable that they mostly detected these more stable species, whereas in our experiments, the open‐chain polysulfides could undergo homolytic cleavage or 1e− oxidation processes in the source of the mass spectrometers to yield polysulfide radical anion species.
Because of the labile nature of polysulfides, in most investigations, these species are derivatized before separation and detection. Kamyshny's group published a series of rigorous investigations on the speciation and detection of inorganic polysulfides under different conditions (Donohue, 1961; Cotgreave and Moldeus, 1986; Kamyshny et al., 2004, 2006, 2007; Kamyshny et al., 2009). They realized that it is of utmost importance to make the derivatization step faster than the interconversion of polysulfide species to derive meaningful readouts. However, the large number of possible reactions that can affect polysulfide speciation poses serious challenges for studying the kinetics and mechanisms of these reactions. Despite these limitations, basic kinetic and isotope labelling studies demonstrated that by using methyl trifluoromethane‐sulfonate (triflate) at adequate concentrations in simple aqueous buffer systems, some interconversion reactions could be ruled out to be faster than the actual derivatization steps (Kamyshny et al., 2004). Unfortunately, the situation is much more complex in biological systems, and this phenomenon has not been studied with respect to the more commonly used cell‐permeable alkylating agents such as NEM, IAM or MBB.
In order to assess whether alkylation impacts speciation, we first attempted to derivatize polysulfide species in buffered aqueous solution using a high concentration (100 mM) of the alkylating agent iodoacetamide. Figure 2A is recorded in positive ion mode to detect IAM‐alkylated polysulfide species, and Figure 2B shows the spectrum obtained with negative ionization of the same solution, confirming no residual underivatized polysulfide species remained. The most abundant derivatized species detected was the disulfide (IAM2‐S2), followed by trisulfide (IAM2‐S3), and the least abundant was the tetrasulfide (IAM2‐S4). This speciation is not vastly different in terms of number of sulfurs in the polysulfide chain compared with those in Figure 1. Therefore, if the polysulfide radical anion species are generated via homolytic cleavages of longer polysulfide chains, then the derivatization has changed speciation substantially. We however believe that the presence of radical species in the source is likely to be largely due to in‐source oxidation of polysulfides as a result of the ionization process.
Next, we examined how derivatization by NEM and IAM at different concentrations impacts polysulfide speciation using UHPLC separation and MS/MS detection. Under the applied conditions (see Methods), NEM‐derivatized polysulfides can be separated by our method with increasing number of sulfurs from S1 to S4 eluting from 4.85 to 6.45 min (Figure 3A); higher than S4, NEM‐derivatized polysulfides were not observed. IAM‐derivatized polysulfides also separate well with increasing number of sulfurs from S1 to S7 eluting in the range of 1.85 to 4.80 min (Figure 3B). Regardless of whether the starting polysulfide solution was made up using a mixed potassium polysulfide or pure sodium trisulfide or tetrasulfide, the speciation pattern looked very similar, consistent with the direct infusion experiments displayed in Figure 1. However, the applied concentrations of NEM or IAM did have an impact on the apparent speciation of derivatized polysulfides.
Using NEM, the average length of detected polysulfide chains tended to decrease with increasing NEM concentrations (Figure 3C). With IAM alkylation, the speciation under the conditions of Figure 3D seems to be stable and independent of IAM concentration. It should be noted that when we used lower concentrations of polysulfide solutions (10 μM), only S1 and S2 were detected across the whole concentration range for NEM and S1–S3 for IAM (not shown). This is potentially due to the abundance of the larger polysulfides dropping below the limit of detection due to the lower overall sulfane sulfur concentration (Sulfane sulfur species are oxidized derivatives of sulfide, which contain sulfur(s) at the zero valent oxidation state.). The lack of signal for the longer polysulfides may also be due to slower disproportionation of the smaller polysulfides (being a second‐order process the half‐life depends on overall concentration) to the potentially more stable longer‐chain polysulfides compared with the rate of derivatization under these conditions (pseudo first‐order process, where the half‐life only depends on the alkylating agent concentration).
To investigate further the suitability of IAM to detect speciation in simple inorganic polysulfide solutions, the effects of the exact composition and order of mixing of the starting solutions were investigated. This experiment confirmed that under four different experimental conditions, no significant impact on the speciation of derivatized polysulfides was observed (Supporting Information Figure S1A). However, when using NEM as the derivatization agent, the starting conditions do appear to have an effect on polysulfide speciation (Supporting Information Figure S1B). This is likely due to the shift of polysulfide distribution equilibria during alkylation by NEM more so than by IAM under the applied conditions. This assumption was confirmed in additional experiments using alternative chromatography (Supporting Information Figure S2) but identical MS detection conditions and NEM and IAM in direct comparison side by side. In incubations with NEM, the highest polysulfide species observed corresponded to the polysulfide salt used as starting material, while with IAM, also longer polysulfide chains were observed (see Supporting Information Figure S3). This observation could be interpreted such that faster alkylation reactions with NEM prevent formation of longer‐chain polysulfides via disproportionation/conproportionation (see Reactions (2)–(6)) reactions, while slower alkylation with IAM does not. However, apparent speciation differed little regardless of whether defined polysulfide salts were directly dissolved as solids in the presence of an excess of alkylating agent or whether they were allowed to first equlibrate at alkaline or physiological pH before being derivatized (Figure 3E, F and Supporting Information Figure S3; see also Supporting Information Scheme S1 for specific reaction conditions). This observation is consistent with faster equilibration of polysulfide speciation compared with the rates of the alkylation reactions.
Another important consideration in this context is the different mode of alkylation of polysulfides by NEM and IAM and the very different chemistries (and hence kinetics) involved: NEM is a strong electrophile with an activated double bond that reacts with nucleophiles such as thiols and polysulfides via a Michael addition reaction, while substitution of the iodine in IAM against the sulfane sulfur of a polysulfide chain is a nucleophilic substitution (SN2) reaction:
Reaction 7: Alkylation with NEM (nucleophilic addition)
(7).

Reaction 8: Alkylation with IAM (nucleophilic substitution)
(1).

Importantly, these reactions have to proceed twice before both ends of the polysulfide chain are alkylated (and presumably protected from further equilibration). The chemical properties of the first reaction product (i.e. with inorganic polysulfides where R=H in Reactions 7 and 8) are likely to be critical for fate and speed with which the second reaction can take place, but nothing is known about these details.
A recent study observed that, in contrast to IAM, NEM can cleave dialkyl polysulfide chains, thus making it unsuitable for longer‐chain polysulfide species detection (Akaike et al., 2017). To test if NEM is able to attack midchain sulfurs in inorganic polysulfides (as opposed to just reacting with the end‐chain sulfurs), polysulfide solutions were first fully reacted with a 10‐fold molar excess of IAM before addition of NEM; at this stage, there should be no end‐chain sulfurs left to react with, based on the data shown in Figure 2. After addition of NEM to the IAM‐derivatized polysulfide solutions, IAM‐derivatized S1, S2 and S3 were still observed but in lower abundance than before NEM addition (Supporting Information Figure S4), and no longer‐chain polysulfides were detected (which may also be due to the relative low concentration of sodium tetrasulfide used). Also observed after NEM addition were hybrid polysulfide adducts with one carboxamidomethyl moiety (from IAM) and one succinimide (from NEM) for S1, S2 and S3. This suggests that NEM had reacted with the sulfide chain at non‐terminal sulfurs, leading to a cleavage of the polysulfur chain. The mechanism of this reaction is unclear and somewhat unexpected as it further suggests that NEM can react with polysulfides by a mechanism other than nucleophilic addition. A few possible models to explain these observations are presented as follows:
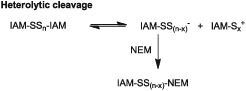
Heterolytic cleavage
It is conceivable that what precedes reaction with NEM is a heterolytic S–S bond cleavage of the fully derivatized IAM polysulfide adduct with formation of one carboxamidosulfur chain with a positive charge and another one with a negative charge; in a second step, the negatively charged IAM polysulfide then reacts with NEM to form the hybrid polysulfide adduct (Reaction 9).
(9).
Homolytic cleavage
Alternatively, end‐capped polysulfides (i.e. (IAM)2Sx compounds) may have a tendency to cleave homolytically and the IAM‐Sx radical species formed then adds to the double bond of NEM (Reaction 10). Similar reactions may occur with the corresponding NEM polysulfide adducts. Such a behaviour would also be consistent with another recent observation, that is, that the NEM adduct of S2 2− is not stable at pH 7.4 (Sutton et al., 2018), supporting the notion that NEM‐derivatized and IAM‐derivatized polysulfide adducts are metastable and both, NEM‐S and IAM‐S are good leaving groups. We used DMPO trying to capture sulfur‐centred products generated upon homolytic cleavage of GSH polysulfide species under two different conditions (using alkylated polysulfides and non‐alkylated polysulfides) but were unable to detect DMPO adducts under any experimental condition (see Methods).
(10).

Hydrolysis
Mechanistically, electrophilic addition‐based alkylation by NEM could also shift the hydrolysis of longer‐chain polysulfide equilibria (as shown below) to the right (which would be expected to shift to the left in the absence of NEM) and eventually generate shorter‐chain alkylated species and the corresponding alkylated sulfenic acid (Reaction 11). This model would predict that specific sulfenic acid capturing tools such as dimedone might also shift Reaction 11 to the right. If true, this could result in eventual dimedone capturing of cysteine residues that were originally present as polysulfides. This is in fact a plausible caveat of sulfenylation measurement protocols, which we specifically address in experimental models using GAPDH, see below.
Direct reaction between the alkylating agents and sulfurs within the polysulfide chain
Alkylating agents could also attack a midchain sulfur bond. The reactivity of IAM and NEM is expected to be largely different in these reactions due to the fundamentally different chemistries involved (Models 12 and 13).
Reactions/mechanisms (9), (10), (11), (12), (13): Hypothetical mechanisms for polysulfur chain cleavage promoted by IAM and NEM.
(12).

(13).

These models warrant further investigation in future studies.
Speciation of cysteine polysulfide species
Cysteine and GSH polysulfides were observed to be highly abundant in biological samples including cells and tissue (Ida et al., 2014; Doka et al., 2016; Akaike et al., 2017). Cysteine polysulfides were previously demonstrated to form via oxidative posttranslational reactions of either cysteine or sulfide. Inorganic polysulfides can oxidize cysteine thiols to generate cysteine polysulfide species (Greiner et al., 2013), and oxidized cysteine residues can also react with sulfide to form cysteine polysulfides (Carballal et al., 2011; Francoleon et al., 2011; Cuevasanta et al., 2015; Nagy, 2015; Vasas et al., 2015). In addition, cysteine polysulfides can be generated by direct enzymatic reactions of cystathionine γ‐lyase (CSE) and cystathionine β‐synthase (CBS) using cystine (Yamanishi and Tuboi, 1981; Ida et al., 2014) as substrate and even more efficiently from cysteine by PLP‐dependent catalytic reactions of cysteinyl‐tRNA synthetase 2 (CARS2) (Akaike et al., 2017) without the involvement of any oxidation reaction or H2S. It was proposed that organic low MW polysulfides such as cysteine and GSH polysulfides can trigger polysulfidation on functional and regulatory protein cysteine residues via transsulfuration reactions (beside CARSs‐catalysed co‐translational protein polysulfidation, Akaike et al., 2017) and hence play a major role in polysulfidation‐regulated redox signalling events (Ida et al., 2014). Therefore, we investigated whether alkylation of these species in simple aqueous solutions can change their speciation.
Cysteine and GSH polysulfide species were prepared by mixing either the appropriate thiol or disulfide species with sulfide or with an inorganic polysulfide solution (made by dissolving Na2S3 or Na2S4). Just as in the case of inorganic polysulfide species, we found that the distribution of alkyl polysulfides does not depend on the nature of the reagents used to prepare them. Although for both cysteine and GSH, polysulfides containing up to five sulfurs could be detected, we only had authentic isotopically labelled internal standards available for the persulfide and trisulfide derivatives; therefore, the following quantitative measurements were only considering these species (apart from the corresponding cysteine thiol and inorganic sulfide, disulfide and trisulfide species).
Using a recently developed quantitative MS method (Akaike et al., 2017), we examined how incubation time and alkylating agent concentration affect speciation of cysteine and GSH polysulfides using HPE‐IAM, NEM and MBB as representative model compounds. Figure 4 shows that after 3 h incubation, the concentration of an IAM‐based alkylating agent (HPE‐IAM) in the 0.5–10 mM range had little effect on the observed speciation of the alkylated cysteine and GSH persulfide species (R‐SS‐HPE‐IAM, R = cysteine or GSH). However, the alkylated trisulfide concentrations increased with the alkylating agent concentration (except at 0.1 mM, at which concentration the alkylating agent is at a substoichiometric molar ratio compared with the sulfur species). This indicates that speciation equilibria in solution are indeed affected at the lower alkylating agent concentrations and that alkylation of longer polysulfides is most likely slower compared with the ones containing a shorter‐chain length. A concomitant drop in the inorganic disulfide species (HS2 −) was observed in both cases, but the concentration of the inorganic trisulfide (HS3 −) increased with higher HPE‐IAM concentration (Figure 4C, D). We observed slow changes in speciation over time in the 30 min to 6 h time window, even at the highest alkylating agent excess (10 mM), indicating that HPE‐IAM cannot efficiently cleave dialkyl polysulfide chains. This is demonstrated by the time‐resolved changes of HPE‐IAM alkylated cysteine and GSH persulfide species in Supporting Information Figure S5. However, a clear drop can be seen in HPE‐IAM‐alkylated trisulfide adducts, albeit not nearly as prominent as in the case of NEM (see Supporting Information Figure S6). Therefore, it is likely that at higher concentrations of IAM, Reactions (9), (10), (11) and 13 also cause longer polysulfur chain cleavage over longer timescales. Of note, we could account for most of the oxidizing equivalents in both systems.
Next, we conducted a similar experiment using NEM instead of HPE‐IAM. As with inorganic polysulfides, we found a strikingly different distribution of the detected sulfur species. Most notably, significantly less R‐SS‐NEM‐derivatives were detected (both for cysteine and GSH) compared with when HPE‐IAM was used as the alkylating agent; the trisulfide species could not be detected under any conditions (for a comparison, see speciation with different alkylating agents after 3 h incubation time at 10 mM alkylating agent concentration in Figure 5). Moreover, cysteine persulfide concentrations sharply decreased with increasing NEM concentration as well as at constant NEM over time (Figure 4E and Supporting Information Figure S6A). This observation is consistent with the notion that NEM favours the formation of NEM‐alkylated cysteine thiol species. Interestingly, neither concentration nor incubation time with NEM had much of an effect on the concentration of the detected NEM‐derivatized GSH persulfide species (see Figure 4F and Supporting Information Figure S6B), which was notably much larger than the corresponding NEM‐alkylated cysteine persulfides (compare the middle green bars in Figure 5A, B). This observation indicates that rates and effectiveness of these reactions will very much depend on the nature of the polysulfide species, which introduces another layer of complexity in terms of protein, GSH, cysteine and inorganic polysulfide detection in biological systems, where different polysulfide species will likely engage in trans‐sulfuration reactions as well.
We repeated these experiments with MBB, an alkylating agent with fluorescent properties that is often used to detect cysteine, GSH and inorganic sulfane sulfur species in biological systems (Cotgreave and Moldeus, 1986; Ida et al., 2014; Nagy et al., 2014). In addition, MBB has been used widely as a derivatization agent for hydrogen sulfide detection in biological samples (Wintner et al., 2010; Shen et al., 2011). As with HPE‐IAM, the concentration of the MBB applied and incubation time had little effect on the concentrations of MBB‐alkylated cysteine and GSH persulfide detected, but the concentrations of the corresponding trisulfide species increased with the applied MBB concentration consistent with Curtin–Hammett control over MBB‐derivatized sulfur species speciation (Supporting Information Figure S7). However, at higher MBB concentrations, a time‐resolved decrease in the trisulfide derivative indicated that just like NEM, MBB can also cleave longer dialkyl polysulfide chains; these results suggest that MBB lies in between HPE‐IAM and NEM in terms of effectiveness to cleave polysulfur chains (see Supporting Information Figure S8B, D).
In order to provide biological credence to this observation, we investigated the effects of MBB concentration and incubation time on the amount of detected sulfide by the MBB method (Nagy et al., 2014) in human blood serum and plasma. Although under similar conditions the MBB‐sulfide reaction is expected to be completed in <10 min (see Figure 6A), a constant increase in the amounts of detected sulfide as a function of incubation time with MBB (as long as up to 1380 min, see Figure 6B) was observed in a concentration‐dependent manner (Figure 6B inset). This clearly indicates that MBB can shift the speciation of sulfur species in human serum and plasma and extract sulfide from different biological sulfide pools as we proposed previously (see Nagy et al., 2014). A previous study found that more sulfide is detected in whole blood when using NEM or MBB compared with when using IAM, which is consistent with our proposal that NEM and MBB can more effectively cleave polysulfur chains than IAM (Sutton et al., 2018).
This phenomenon was further investigated using GAPDH and a recently developed protein polysulfide detection method, PMSA (Akaike et al., 2017), which builds on the observation that NEM can cleave longer dialkyl polysulfide chains. GAPDH was treated with different concentrations of inorganic polysulfide solutions made up using either Na2S2 or Na2S3 salts. In all cases, a similar cysteine polysulfidation pattern was observed indicating that GAPDH is already polysulfidated to a large extent even in the absence of additional polysulfide (Akaike et al., 2017). However, the nature of the alkylating agent also makes a difference in this assay (see Figure 7). As expected, NEM was the most efficient in cleaving already alkylated cysteine polysulfide residues on the protein, followed by MBB, and IAM had no cleaving effect. The fact that NEM and 2‐mercaptoethanol or DTNB treatments showed a similar pattern suggests that NEM cleaved all cysteine polysulfide chains on the protein.
If these reactions indeed proceed via one of the mechanisms proposed in Reactions 9 or 11, then this would raise an important issue regarding the common detection of protein sulfenic acids by dimedone trapping (Poole et al., 2004; Paulsen and Carroll, 2013): one could envision that if cysteine polysulfide species undergo hydrolysis via a mechanism as outlined in Reaction 11, then specific trapping of sulfenic acid species would pull the equilibria towards the formation of the hydrolytic products. In addition, the Alk‐Sx + species that are generated upon heterolytic cleavage of polysulfides (Reaction 9) are also expected to rapidly hydrolyse to give the corresponding sulfenic acid derivative (Alk‐Sx‐OH). Therefore, theoretically, these equilibria could also be pulled towards the formation of the hydrolysis products. A corollary of this notion is that a proportion of the detected protein sulfenic acid pool in biological systems might in fact originate from protein polysulfide species instead. We recently proposed that a major fraction of the dimedone‐labelled protein pool may represent perthiosulfenic acid derivatives. Ab initio calculations suggested that dimedone is not reactive towards polysulfide species, only towards sulfenic, persulfenic or polysulfenic acid derivatives (Heppner et al., 2017), which is consistent with this hypothesis. In order to test these assumptions in a relevant biological context, we incubated isolated GAPDH that was pretreated either with inorganic polysulfides, H2O2 or left untreated. We detected more dimedone‐labelled cysteine and cysteine polysulfide derivatives on GAPDH cysteine residues when the isolated protein was treated with inorganic polysulfides (which is not expected to directly provide cysteine‐SOH) compared with when it was treated with H2O2 (which is known to induce cysteine‐SOH on GAPDH) or when it was left untreated (see Figure 8A). When the samples were pretreated with 100 mM IAM, the observed amounts of dimedone‐labelled cysteine derivatives dropped by orders of magnitude (Figure 8B). Based on these results, we cannot distinguish at present whether dimedone labelling was due to hydrolysis of polysulfur chains (analogous to Reaction 11) or due to autooxidation of sulfurs in GAPDH–cysteine derivatives. The fact that much lower amounts of dimedone labelling were observed when a high concentration of IAM was used prior to capturing cysteine‐SOH with dimedone suggests that the hydrolysis of dialkyl polysulfides may not be very efficient in this case. However, it is also plausible that this high amount of alkylating agent pulled Equilibria 9–11 to the right or directly cleaved polysulfide chains via Reaction 13. Importantly, these observations do not exclude the possibility that the dimedone adducts were formed by hydrolysis reactions of non‐alkylated polysulfides. A thorough kinetic study to elucidate the mechanism by which polysulfides induce dimedone labelling is required. Taken together, these observations raise the possibility that a fraction of the previously detected sulfenic acid pool, which used dimedone‐based molecules as cysteine‐SOH specific capturing agents, could in fact represent polysulfide species.
We also studied GSH polysulfide speciation by NMR spectroscopy and direct infusion MS in the absence of any derivatization. Interestingly, both NMR and ESI‐MS analyses indicated that addition of NaSH to disulfides resulted in the formation of corresponding thiol and dialkyl trisulfide species. Initial studies on the equilibrium of H2S with disulfides were performed using GSSG and 1H‐NMR analyses. Figure 9A displays the stacked 1H‐NMR spectra for GSH (10 mM), GSSG (10 mM), GSSSG (10 mM) and GSSG (10 mM) + NaSH (5 mM), from bottom to top respectively. As can be seen in Figure 9, addition of 5 mM NaSH to 10 mM GSSG causes the formation of two new species. Comparison of the chemical shifts for these new species with those of authentic standards indicates that the newly formed species are GSH (δ = 4.56 ppm) and GSSSG (δ = 3.16–3.22 and 3.43–3.48 ppm). The ratio of GSH : GSSSG was 2:1, which would be the expected ratio of RSH : RSSSR from the proposed formation of RSSSR, as described below (Reactions (14) and (15)). Further addition of NaSH (10 and 15 mM) to 10 mM GSSG causes subsequent increases in the formation of these newly formed species (Figure 9B).
Our NMR analyses indicate that addition of NaSH to GSSG induces formation of thiol and dialkyl trisulfide species after equilibration. Therefore, it became of interest to confirm the presence of thiol and dialkyl trisulfide species by ESI‐MS analyses. The ESI‐MS spectra of equilibrated samples (30 min) of both 1 mM GSSG + 0.5 mM NaSH are displayed in Figure 9C, confirming that addition of NaSH to GSSG causes formation of the corresponding thiol (Figure 9D, m/z = 307.98) and trisulfide species (Figure 9D, m/z = 645.09), which are not present in samples of GSSG alone (Figure 9C).
It has been widely accepted that the initial reaction of H2S with disulfides results in an equilibrated mixture with corresponding thiol and persulfide species (Francoleon et al., 2011; Vasas et al., 2015) (Reaction (14)).
| (14) |
It has to be noted that these reactions likely proceed via nucleophilic attack by an anionic species (HS− or RSS−) rather than by H2S directly, but for the sake of simplicity, the charged states of the reactants/products are not depicted here. Lack of detection of persulfide species in the equilibrated systems described above implies that formed persulfide species are subject to further reaction under the studied conditions. This is also consistent with the detection of dialkyl trisulfide species by both NMR and ESI‐MS analyses. It is therefore reasonable to consider that persulfides participate in a second equilibrium that results in dialkyl trisulfide formation (Reaction (15)).
| (15) |
We previously studied the reaction of cystine (CysSSCys) with sulfide using 1H‐NMR spectroscopy, in which we observed the formation of two distinct Cys derivatives (other than the thiol and disulfide species), which were tentatively assigned to be cysteine persulfide (CysSSH) and the dialkyl trisulfide (CysSSSCys) (Vasas et al., 2015). This corroborates the proposed model (see Reactions (14) and (15)), in which persulfides indeed form as intermediate species in the reactions of GSSG with sulfide to finally give GSSSG. We argued that speciation equilibria can favour very different distribution of sulfur species in a system‐specific manner (Vasas et al., 2015), which is consistent with the observed differences in the CysSSCys and GSSG systems.
We here would like to refer the reader to our companion paper, where we demonstrated that Equilibrium 15 is indeed likely to prevail in cellular systems. We found that cysteine trisulfide (Cys‐SSS‐Cys) provide a useful pharmacological tool because treatment of cells with this dialkyl trisulfide results in high intracellular levels of hydropersulfides (due to a shift towards the backward reaction of Reaction (15)), which protected HEK293T cells from electrophilic stress (Bianco et al., 2019).
Furthermore, if indeed a highly nucleophilic persulfide is fleeting in the case of the GSH system due to subsequent reaction with electrophilic species present in the reaction mixture (e.g. a disulfide, Reaction (15)), it is expected that dialkyl trisulfide formation could be avoided or lessened by the presence of an alternate electrophilic species capable of trapping the intermediate RSSH (Reaction (16)). In other words, trapping of RSSH by an exogenous electrophile (Reaction (16)) would be competitive with trapping of RSSH by RSSR (Reaction (15)).
| (16) |
Consequently, increasing concentrations of exogenous electrophile would be expected to cause a leftward shift in the equilibrium of Reaction (15), because persulfides are expected to act as better nucleophiles compared with the corresponding thiols (especially at physiological pH where the GSH thiol is mostly protonated and the persulfide is likely in its more nucleophilic perthiolate form) and hence react faster with the alkylating agent. This would limit dialkyl trisulfide formation. Indeed, addition of increasing concentrations of IAM (0.5–2.5 mM) to equilibrated mixtures of 10 mM GSSG + 5 mM NaSH caused subsequent decreases in the concentration of GSSSG (δ = 3.16–3.22 and 3.43–3.48 ppm, Figure 9E). Additionally, the use of the electrophile NEM (0–2.5 mM) as a trap for the intermediate GSSH displayed similar reactivity to that of IAM (0–2.5 mM), ultimately leading to decreased amounts of GSSSG upon increasing addition of NEM (Figure 9F). This also indicates that IAM acts as a better trap for GSSH, in comparison with NEM, suggesting that GSSH preferentially reacts with GSSG in the presence of NEM but not in the presence of IAM.
Taken together, the above data indicate that exogenously added electrophilic species compete with disulfides for the trapping of persulfides. To further verify this, the products formed after addition of 0.5 mM IAM to equilibrated samples of GSSG + 0.5 mM NaSH were analysed using ESI‐MS. Addition of IAM to an equilibrated solution of GSSG + NaSH (Figure 9E) traps GSSH, again shifting the equilibrium away from GSSSG (Reaction (15)) and resulting in the carboxamidomethylated‐GSSH species ([GSS + AM+H]+, m/z = 397.19, Figure 9G).
Alternatively, some of the detected alkylated cysteine polysulfide species could also originate from dialkyl polysulfides via similar mechanisms that are outlined in Reactions 9–13 for alkylated inorganic polysulfides.
Speciation of polysulfide species in organic media
Up to this juncture, using aqueous model systems of likely relevance for cellular events occurring either in the cytosol or in extracellular fluids, we have demonstrated that alkylation of inorganic, cysteine, GSH and protein polysulfides can dramatically change the distribution of polysulfur species with different chain lengths. However, a significant part of the biological chemistry pertinent to sensing, signal transduction and adjustment of cellular function takes place in more lipophilic compartments such as the cell membrane or cellular organelles. We were therefore interested to see whether some of the key findings observed also apply to non‐aqueous systems.
Mixing NBu4SH, an organic soluble source of hydrosulfide, with elemental sulfur (S8) produces inorganic polysulfides in organic solution (Bailey et al., 2016). The fact that polysulfide species are brightly, and differentially, coloured in organic solvents presents a unique opportunity to assess differences in speciation before and after quenching with benzyl chloride.
S2 •−, S3 •− and S4 •− have UV–Vis absorbances in the visible region in electron pair‐donating solvents and are yellow (400 nm), blue (620 nm) and red (520 nm) respectively (although S2 •− absorbance was observed in a KI matrix, and the absorption attributed the S4 •− is the subject of some debate) (Chivers and Drummond, 1972; Chivers and Elder, 2013). In our UV–Vis experiments, similar speciation was observed across the 1:1, 1:2 and 1:3 ratios, with the S4 •− (490 nm) being the predominant species at RT (see Figure 10A–C). Importantly, as the temperature was increased, more of the S3 •− (610 nm) was formed. For the 1:8 ratio system (see Figure 10D), the predominant species at RT was S2 •− (426 nm), and with further increase in temperature, the equilibrium was shifted towards to formation of more S3 •− (610 nm). The fact that the transitions between temperatures were completely reversible in all cases nicely demonstrates that we are indeed looking at true shifts in speciation equilibria. These experiments demonstrated that for any given ratio, the speciation of organic polysulfides is very sensitive to temperature.
Next, we compared the solution speciation observed in the UV–Vis spectra with the speciation of dibenzyl polysulfides (Bn2SX) after quenching these solutions with the electrophile benzyl chloride (see Reaction 17) using 1H‐NMR integration values of the benzyl proton resonances (see Table 2). Benzyl chloride was used as a trapping agent due to the well‐characterized chemical shifts of the different benzyl polysulfide products and prior use to identify polysulfides (Ahrika et al., 1999; Bailey and Pluth, 2015).
(17).

Table 2.
Relative percentages of trapped benzyl polysulfides
| 1:1 | 1:2 | 1:2 (40°C) | 1:2 (60°C) | 1:3 | 1:4 | 1:8 | |
|---|---|---|---|---|---|---|---|
| Bn2S2 (3.74 ppm) | 0 | 0 | 0 | 0 | 0 | 0 | 2.4 |
| Bn2S3 (4.11 ppm) | 41 | 42.5 | 42.6 | 41.9 | 47.3 | 37.2 | 87.2 |
| Bn2S4 (4.24 ppm) | 32.5 | 32.2 | 32.3 | 32.4 | 32.2 | 25.4 | 10.3 |
| Bn2S5 (4.29 ppm) | 26.5 | 25.3 | 25.1 | 25.7 | 20.5 | 37.4 | 0 |
All quenches were performed at RT unless noted otherwise.
The 1H‐NMR spectra showed the trapping of dibenzyl trisulfide (Bn2S3), dibenzyl tetrasulfide (Bn2S4) and dibenzyl pentasulfide (Bn2S5). Dibenzyl disulfide (Bn2S2) was only observed in the 1:8 S8 : NBu4SH ratio system. The relative molar ratio of the benzyl trapped polysulfides (Bn2S3 : Bn2S4 : Bn2S5) was conserved across all 1:X S8 : NBu4SH where X ≤ 4. This trend deviates for the 1:8 S8 : NBu4SH system as would be expected based on the UV–Vis data. Importantly, in contrast to the observed temperature dependence in the UV–Vis spectra, changing the temperature in the 1:2 S8 : NBu4SH ratio system followed by electrophilic quenching of polysulfide species had no effect on the observed Bn2S3 : Bn2S4 : Bn2S5 ratio across all three temperature points.
Taken together, these results confirm our hypothesis that the electrophilic quenching of a mixed polysulfide system is under Curtin–Hammett control; meaning that in this system, the reactive polysulfides are rapidly interconverting on a much shorter timescale compared with the reaction with benzyl chloride (Reaction 17). As such, the relative alkyl polysulfide product ratios are merely a reflection of the relative rates of reaction with benzyl chloride (and other electrophiles) and do not report on the solution speciation.
Implications for the detection of sulfur species in biological systems
Reactive sulfur species are emerging as part of a possibly vestigial chemistry that governs contemporary cell biology (Cortese‐Krott et al., 2017). The particular chemical properties of sulfur, including its ability to transfer electrons and form chains of variable length (catenation tendency), play an important role in enabling the sulfhydryl moiety of reactive cysteine residues to fulfill important functions in redox regulatory processes. Consequently, a large body of literature exists related to the different redox and electrophilic cysteine modifications in the context of oxidative stress and redox regulation of cell signalling (Rudolph and Freeman, 2009; Nagy and Winterbourn, 2010b). Persulfide/polysulfide formation on protein cysteine residues represents a relatively new concept in redox biology, and a number of different research groups have shown that protein polysulfide species are abundant in cells and tissues with important biological functions (Mustafa et al., 2009; Ida et al., 2014; Zhang et al., 2014; Gao et al., 2015; Doka et al., 2016; Longen et al., 2016; Akaike et al., 2017). Moreover, these species not only are generated by posttranslational events but also form translationally, giving credence to their pivotal biological role (Akaike et al., 2017).
Tools to study polysulfidation and other redox modifications of protein cysteine residues have been available for some time now and will be developed further and refined in the years to come. However, as we show in this contribution, the gold standard alkylation‐based protocols can have serious caveats, and in many cases, the actual readouts do not necessarily represent true cellular speciation of cysteine derivatives. Our data indicate that methods using NEM‐based or MBB‐based alkylation strategies will either detect lower levels or completely miss the existence of persulfide/polysulfide species compared with IAM‐based alkylation protocols. On the other hand, methodologies that are designed to detect protein disulfides will benefit from faster alkylation of sulfhydryl groups by NEM compared with IAM by avoiding artifactual oxidation. Furthermore, our data indicate that sulfide concentrations in clinical samples determined using the MBB method should be interpreted with caution, keeping in mind that measured concentrations involve not only sulfide but also different proportions (depending on the experimental conditions) of the bound sulfane sulfur pool. Reporting ‘free sulfide levels’ with this method should therefore be avoided.
Our results also indicate that although dimedone labelling is specific to sulfenic acid residues, due to shifting speciation, equilibria (e.g. in this case Reaction 11) can result in overestimation of cysteine‐SOH species, and a fraction of the previously assigned sulfenic acid pool could in fact represent polysulfide species. Therefore, alkylating agents that are specific to a particular cysteine derivative, like dimedone, need to be used with care because they, too, can pull speciation equlilibria into one direction.
We caution that the chemistries discussed in the present body of work should not be neglected in studies addressing the chemical biology of cysteine modifications. In the context of endogenous polysulfide detection, it will be of relevance not only to posttranslational protein modification processes (and therefore in adjusting protein function at the level of cysteine moieties) downstream of cellular hydrogen sulfide production but also to events upstream by generating sulfur equivalents with distinct redox properties from organic persufides/polysufides. Given the dynamic nature of this ‘sulfur redox metabolome’, identifying specific regulatory events with specific sulfur species will remain a formidable challenge in the years to come. Given the outstanding physiological relevance and clinical potential of redox‐based cellular signalling events (Cortese‐Krott et al., 2017), we do not intend to suggest that all current state‐of‐the‐art protocols give rise to inadequate conclusions, but we urge the community to interpret their results with modesty, keeping in mind the limitations of the corresponding techniques. For example, measured ‘free sulfide levels’ and definitive designation of effector sulfur species should be handled with extraordinary care.
Author contributions
V.B, T.I., T.R.S., C.B., T.D., G.K., H.A.H., M.M. performed the research; P.N. designed the research study, M.D.P., M.F., J.M.F., T.A. contributed essential reagents or tools, V.B., T.I., T.R.S., C.B., T.D., J.P.T., A.v.d.V., M.D.P., M.F., J.M.F., T.A. and P.N. analysed the data; P.N. wrote and A.v.d.V., M.F., J.M.F. and T.A. edited the paper.
Conflict of interest
The authors declare no conflicts of interest.
Declaration of transparency and scientific rigour
This Declaration acknowledges that this paper adheres to the principles for transparent reporting and scientific rigour of preclinical research recommended by funding agencies, publishers and other organisations engaged with supporting research.
Supporting information
Table S1 MRM parameters of various per/polysufide derivatives
Figure S1 Effects of alkylating conditions on polysulfide speciation as detected by UHPLC–MS/MS. A) Preparation methods: 1) 0.0017 g Na2S4 was added to 900 μl buffer with 100 μl IAM solution. 2a) 0.0021 g Na2S4 was added to 900 μl water, then 100 μl IAM was added after dissolving 2b) 0.0020 g Na2S4 was added to 900 μl water with 100 μl IAM 3) 0.0017 g Na2S4 was added to 1000 μl water, then 100 μl of the solution was added to 800 μl buffer with 100 μl IAM. Solutions 1, 2a and 2b were diluted 10x in ultra‐pure water before analysis. In all four conditions the observed speciation pattern is S1 > S2 > S3 > S5 > S4 > S6. B) Preparation methods: 1) 0.0023 g Na2S4 was added to 900 μl buffer with 100 μl NEM solution. 2a) 0.0018 g Na2S4 was added to 900 μl water, then 100 μl NEM was added after dissolving 2b) 0.0017 g Na2S4 was added to 900 μl water with 100 μl NEM 3) 0.0022 g Na2S4 was added to 1000 μl water, then 100 μl of the solution was added to 800 μl buffer with 100 μl NEM. Solutions 1, 2a and 2b were diluted 10x in ultra‐pure water before analysis. Using the same preparation methods as with IAM in condition 1) only S2 and S1 were detected with S2 being more abundant. Conditions 2a) and 2b) show the same pattern of S2 > S1 > S3. Condition 3) shows S1 as most abundant with only S2 and no higher‐chain polysulfides detected.
Figure S2 Representative chromatograms (UHPLC–MS/MS) for NEM and IAM derivatized polysulfides (using Na2S4) as separated using the Modus Aqua UHPLC column (see Materials and Methods 1.2.2). NEM derivatized polysulfides are shown in order of increasing sulfurs from S1 to S4 and elution time from bottom to top, IAM derivatized polysulfides are likewise shown in order of increasing sulfurs from S1 to S7 and elution time from bottom to top.
Figure S3 Differences in polysulfide speciation using three different polysulfide salts with three different preparation conditions. NEM: A) Na2S2, B) Na2S3 and C) Na2S4. IAM: D) Na2S2, E) Na2S3 and F) Na2S4. Condition 1: Na2Sx dissolved in NEM or IAM containing buffer. Condition 2: Na2Sx first dissolved in ultra‐pure water, then diluted in NEM or IAM containing buffer. Condition 3: Na2Sx dissolved in ultra‐pure water, then diluted in buffer, then diluted in NEM or IAM containing buffer. Specific experimental procedures and conditions are described in Scheme S1. Generally, shorter polysulfide chains were observed and speciation was more affected by the preparation conditions with NEM compared with IAM. These observations are consistent with Figure S1.
Figure S4 Effect of NEM on carboxamidomethylated inorganic polysulfide chains as detected by UHPLC–MS/MS A) Polysulfide species seen before addition of NEM to IAM derivatized tetrasulfide. Conditions: 0.0019 g sodium‐tetrasulfide was added to 9 ml water +1 ml 100 mM IAM, then the solution was incubated at room temperature for 10 minutes. An extension of the incubation time for IAM alkylation to 60 min did not change the outcome of the results. Top four chromatograms are provided for comparison to Figure S4B. Amounts of IAM‐S1‐IAM, IAM‐S2‐IAM and IAM‐S3‐IAM are shown as relative abundance compared with IAM‐S1‐IAM (Figure S2A) set as 100%. Amounts of IAM‐S1‐NEM, IAM‐S2‐NEM, IAM‐S3‐NEM and NEM‐S1‐NEM are shown as relative abundance compared with IAM‐S2‐NEM (Figure S4B) set as 100%. B): Polysulfide species detected upon the addition of NEM to IAM‐derivatized tetrasulfide. Spectra were recorded after 10 minute incubation of solutions similar to Figure S4A with NEM. Note the appearance of the mixed IAM‐NEM alkylated species and the NEM‐S1‐NEM signal. Amounts of IAM‐S1‐IAM, IAM‐S2‐IAM and IAM‐S3‐IAM are shown as relative abundance compared with IAM‐S1‐IAM (Figure S4A) set as 100%. Amounts of IAM‐S1‐NEM, IAM‐S2‐NEM, IAM‐S3‐NEM and NEM‐S1‐NEM are shown as relative abundance compared with IAM‐S2‐NEM (Figure S4B) set as 100%. Conditions: 0.0019 g sodium‐tetrasulfide was added to 9 ml water +1 ml 100 mM IAM, then the solution was incubated at room temperature for 5 minutes, followed by the addition of 100 μl of this mixture to 800 μl water +100 μl 10 mM NEM. The solution was incubated at room temperature (20οC) for a further 10 minutes before being analysed.
Figure S5 Time dependence of the stability of Cys or GSH persulfide and trisulfide species, alkylated with 0.1–10 mM HPE–IAM A) Persulfide and B) trisulfide adducts of cysteine, show no significant change or a slow decrease over time, respectively C) Persulfide and D) trisulfide adducts of GSH also show no significant change or a slow decrease over time, respectively. Quantitation of persulfide and trisulfide HPE‐IAM‐derivatives was achieved by using isotopically labelled internal standards as detailed in Materials and Methods. Data points represent the average of n = 3 independent experiments with the corresponding error bars showing the standard deviation. Conditions: 100 μM cysteine/glutathione was treated with 300 μM Na2S2 for 5 minutes and then incubated with 0.1–10 mM HPE–IAM at room temperature for 30 minutes, 60 minutes, 3 hours and 6 hours. Samples were prepared in 30 mM HEPES/KOH buffer (pH = 7.5).
Figure S6 Time dependence of the stability of cysteine and glutathione persulfide species, alkylated with 0.5–10 mM NEM. NEM‐alkylated Cys‐persulfide concentrations dropped relatively fast, but NEM‐alkylated GSH‐persulfide exhibited increased stability. Quantitation of Cys and GSH persulfide NEM‐derivatives was achieved using isotopically labelled internal standards as detailed in Materials and Methods. Data points represent the average of n = 3 independent experiments with the corresponding error bars showing the standard deviation. Conditions: 100 μM cysteine/glutathione was treated with 300 μM Na2S2, at room temperature for 5 minutes, then incubated with 0.5–10 mM NEM at room temperature for 30 minutes, 60 minutes, 3 hours and 6 hours. Samples were prepared in 30 mM HEPES/KOH buffer (pH = 7.5).
Figure S7 Quantitative measurement of Cys, GSH and inorganic polysulfide species derivatized with 0.1–10 mM MBB. Speciation of MBB‐derivatized thiol, persulfide and trisulfide species of A) cysteine or B) GSH as a function of MBB concentration. Quantitation of MBB‐derivatives was achieved by using isotopically labelled internal standards as detailed in Materials and Methods. Data points represent the average of n = 3 independent experiments with the corresponding error bars showing the standard deviation. Conditions: 100 μM cysteine/glutathione was treated with 300 μM Na2S2, at room temperature for 5 minutes, then incubated with 0.1–10 mM MBB at room temperature for 3 hours. Samples were prepared in 30 mM HEPES/KOH buffer (pH = 7.5).
Figure S8 Time dependence of the stability of cysteine and glutathione persulfide species, alkylated with 0.5–10 mM MBB Persulfide adducts of A) cysteine or C) GSH show no significant decrease over time, but B) Cys‐trisulfide and D) GSH‐trisulfide concentrations drop significantly in the applied time window. Quantitation of sulfur species was achieved using isotopically labelled internal standards as detailed in Materials and Methods. Data points represent the average of n = 3 independent experiments with the corresponding error bars showing the standard deviation. Conditions: 100 μM cysteine/glutathione was treated with 300 μM Na2S2, at room temperature for 5 minutes, then incubated with 0.1–10 mM MBB at room temperature for 30 minutes, 60 minutes, 3 hours and 6 hours. Samples were prepared in 30 mM HEPES/KOH buffer (pH = 7.5).
Scheme S1 Experimental workflow for additional polysulfide preparation experiments (Figure 3E and 3F, and Supplementary Figures S2 and S3) Na2Sx, x = 2, 3 or 4, the buffer used was pH 7.4 ammonium phosphate. All experiments were carried out at room temperature (20οC) and repeated three times. The polysulfide solutions were allowed to react with NEM for 10 min and IAM for 30 min to ensure alkylation was complete (and assuming NEM reacts much faster with polysulfides than IAM).
Acknowledgements
Financial support from the National Research, Development and Innovation Office (grant nos. KH17_126766 and K 109843) and the National Institutes of Health (grant no. R21AG055022‐01) for P.N. is acknowledged. P.N. was a János Bolyai Research Scholar of the Hungarian Academy of Sciences. Financial supports from the National Science Foundation (grant nos. CHE‐1454747 and CHE‐1566065) to M.D.P and J.P.T are also acknowledged. This work was supported in part by Grants‐in‐Aid for Scientific Research (25253020 and 16K15208 to T.A.) and a Grant‐in‐Aid for Scientific Research on Innovative Areas (26111008, 26111001 and 15K21759 to T.A.) from the Ministry of Education, Sciences, Sports and Technology (MEXT), Japan. Dojindo Molecular Technologies Inc. is greatly acknowledged for their kind support of chemical supplies.
Bogdándi, V. , Ida, T. , Sutton, T. R. , Bianco, C. , Ditrói, T. , Koster, G. , Henthorn, H. A. , Minnion, M. , Toscano, J. P. , van der Vliet, A. , Pluth, M. D. , Feelisch, M. , Fukuto, J. M. , Akaike, T. , and Nagy, P. (2019) Speciation of reactive sulfur species and their reactions with alkylating agents: do we have any clue about what is present inside the cell?. British Journal of Pharmacology, 176: 646–670. 10.1111/bph.14394.
Contributor Information
Takaaki Akaike, Email: takaike@med.tohoku.ac.jp.
Péter Nagy, Email: peter.nagy@oncol.hu.
References
- Ahrika A, Robert J, Anouti M, Paris J (1999). Nucleophilic substitution of alkyl halides by electrogenerated polysulfide ions in N,N‐dimethylacetamide. Acta Chem Scand 53: 513–520. [Google Scholar]
- Akaike T, Ida T, Wei FY, Nishida M, Kumagai Y, Alam MM et al (2017). Cysteinyl‐tRNA synthetase governs cysteine polysulfidation and mitochondrial bioenergetics. Nat Commun 8: 1177. [DOI] [PMC free article] [PubMed] [Google Scholar]
- Alexander SPH, Fabbro D, Kelly E, Marrion NV, Peters JA, Faccenda E et al (2017). The Concise Guide To PHARMACOLOGY 2017/18: Enzymes. Br J Pharmacol 174: S272–S359. [DOI] [PMC free article] [PubMed] [Google Scholar]
- Bailey TS, Pluth MD (2015). Reactions of isolated persulfides provide insights into the interplay between H2S and persulfide reactivity. Free Radic Biol Med 89: 662–667. [DOI] [PMC free article] [PubMed] [Google Scholar]
- Bailey TS, Henthorn HA, Pluth MD (2016). The intersection of NO and H2S: persulfides generate NO from nitrite through polysulfide formation. Inorg Chem 55: 12618–12625. [DOI] [PubMed] [Google Scholar]
- Berzelius J (1822). De la Composition des Sulfures Alcalins. Ann Chim Phys 20: 113–141. [Google Scholar]
- Bianco CL, Akaike T, Ida T, Nagy P, Bogdandi V, Toscano JP et al (2019). The reaction of hydrogen sulfide with disulfides: formation of a stable trisulfide and implications to biological systems. Br J Pharmacol 176: 671–683. [DOI] [PMC free article] [PubMed] [Google Scholar]
- Bostelaar T, Vitvitsky V, Kumutima J, Lewis BE, Yadav PK, Brunold TC et al (2016). Hydrogen sulfide oxidation by myoglobin. J Am Chem Soc 138: 8476–8488. [DOI] [PMC free article] [PubMed] [Google Scholar]
- Bouillaud F, Blachier F (2011). Mitochondria and sulfide: a very old story of poisoning, feeding, and signaling? Antioxid Redox Signal 15: 379–391. [DOI] [PubMed] [Google Scholar]
- Boulegue J, Michard G (1978). Constantes de formation des ions polysulfures S‐26, S‐25 et S‐24 en phase aqueuse. J Fr Hydrol 9: 24–33. [Google Scholar]
- Carballal S, Trujillo M, Cuevasanta E, Bartesaghi S, Moller MN, Folkes LK et al (2011). Reactivity of hydrogen sulfide with peroxynitrite and other oxidants of biological interest. Free Radic Biol Med 50: 196–205. [DOI] [PubMed] [Google Scholar]
- Chivers T, Drummond I (1972). Characterization of the trisulfur radical anion S3− in blue solutions of alkali polysulfides in hexamethylphosphoramide. Inorg Chem 11: 2525–2527. [Google Scholar]
- Chivers T, Elder PJ (2013). Ubiquitous trisulfur radical anion: fundamentals and applications in materials science, electrochemistry, analytical chemistry and geochemistry. Chem Soc Rev 42: 5996–6005. [DOI] [PubMed] [Google Scholar]
- Cloke PL (1963). The geologic role of polysulfides – part I. The distribution of ionic species in aqueous sodium polysulfide solutions. Geochim Cosmochim Acta 27: 1265–1298. [Google Scholar]
- Cortese‐Krott MM, Koning A, Kuhnle GGC, Nagy P, Bianco CL, Pasch A et al (2017). The reactive species interactome: evolutionary emergence, biological significance, and opportunities for redox metabolomics and personalized medicine. Antioxid Redox Signal 27: 684–712. [DOI] [PMC free article] [PubMed] [Google Scholar]
- Cortese‐Krott MM, Kuhnle GG, Dyson A, Fernandez BO, Grman M, DuMond JF et al (2015). Key bioactive reaction products of the NO/H2S interaction are S/N‐hybrid species, polysulfides, and nitroxyl. P Natl Acad Sci USA 112: E4651–E4660. [DOI] [PMC free article] [PubMed] [Google Scholar]
- Cotgreave IA, Moldeus P (1986). Methodologies for the application of monobromobimane to the simultaneous analysis of soluble and protein thiol components of biological systems. J Biochem Biophys Methods 13: 231–249. [DOI] [PubMed] [Google Scholar]
- Cuevasanta E, Lange M, Bonanata J, Coitino EL, Ferrer‐Sueta G, Filipovic MR et al (2015). Reaction of hydrogen sulfide with disulfide and sulfenic acid to form the strongly nucleophilic persulfide. J Biol Chem 290: 26866–26880. [DOI] [PMC free article] [PubMed] [Google Scholar]
- Curtis MJ, Alexander S, Cirino G, Docherty JR, George CH, Giembycz MA et al (2018). Experimental design and analysis and their reporting II: updated and simplified guidance for authors and peer reviewers. Br J Pharmacol 175: 987–993. [DOI] [PMC free article] [PubMed] [Google Scholar]
- Doka E, Arner ESJ, Schmidt EE, Nagy P (2017). ProPerDP, a protein persulfide detection protocol In: Beltowski J. (ed.). Methods in Molecular Biology edn, Vol. Special Issue. Springer; in press. [DOI] [PubMed] [Google Scholar]
- Doka E, Pader I, Biro A, Johansson K, Cheng Q, Ballago K et al (2016). A novel persulfide detection method reveals protein persulfide‐ and polysulfide‐reducing functions of thioredoxin and glutathione systems. Sci Adv 2: e1500968. [DOI] [PMC free article] [PubMed] [Google Scholar]
- Donohue J (1961). Chapter 1 – the structures of elemental sulfur† a2 – kharasch, n In: Organic Sulfur Compounds: Pergamon, pp. 1–6. [Google Scholar]
- Francoleon NE, Carrington SJ, Fukuto JM (2011). The reaction of H2S with oxidized thiols: generation of persulfides and implications to H2S biology. Arch Biochem Biophys 516: 146–153. [DOI] [PubMed] [Google Scholar]
- Gao XH, Krokowski D, Guan BJ, Bederman I, Majumder M, Parisien M et al (2015). Quantitative H2S‐mediated protein sulfhydration reveals metabolic reprogramming during the integrated stress response. Elife 4: e10067. [DOI] [PMC free article] [PubMed] [Google Scholar]
- Garai D, Rios‐Gonzalez BB, Furtmuller PG, Fukuto JM, Xian M, Lopez‐Garriga J et al (2017). Mechanisms of myeloperoxidase catalyzed oxidation of H2S by H2O2 or O2 to produce potent protein Cys‐polysulfide‐inducing species. Free Radic Biol Med 113: 551–563. [DOI] [PubMed] [Google Scholar]
- Giggenbach W (1972). Optical spectra and equilibrium distribution of polysulfide ions in aqueous solution at 20.deg. Inorg Chem 11: 1201–1207. [Google Scholar]
- Greiner R, Palinkas Z, Basell K, Becher D, Antelmann H, Nagy P et al (2013). Polysulfides link H2S to protein thiol oxidation. Antioxid Redox Signal 19: 1749–1765. [DOI] [PMC free article] [PubMed] [Google Scholar]
- Gun J, Modestov AD, Kamyshny A, Ryzkov D, Gitis V, Goifman A et al (2004). Electrospray ionization mass spectrometric analysis of aqueous polysulfide solutions. Microchim Acta 146: 229–237. [Google Scholar]
- Harding SD, Sharman JL, Faccenda E, Southan C, Pawson AJ, Ireland S et al (2018). The IUPHAR/BPS Guide to PHARMACOLOGY in 2018: updates and expansion to encompass the new guide to IMMUNOPHARMACOLOGY. Nucleic Acids Res 46: D1091–D1106. [DOI] [PMC free article] [PubMed] [Google Scholar]
- Hartle MD, Meininger DJ, Zakharov LN, Tonzetich ZJ, Pluth MD (2015). NBu4SH provides a convenient source of HS− soluble in organic solution for H2S and anion‐binding research. Dalton Trans 44: 19782–19785. [DOI] [PubMed] [Google Scholar]
- Heppner DE, Hristova M, Ida T, Mijuskovic A, Dustin CM, Bogdandi V et al (2017). Cysteine perthiosulfenic acid (Cys‐SSOH): a novel intermediate in thiol‐based redox signaling? Redox Biol 14: 379–385. [DOI] [PMC free article] [PubMed] [Google Scholar]
- Ida T, Sawa T, Ihara H, Tsuchiya Y, Watanabe Y, Kumagai Y et al (2014). Reactive cysteine persulfides and S‐polythiolation regulate oxidative stress and redox signaling. P Natl Acad Sci USA 111: 7606–7611. [DOI] [PMC free article] [PubMed] [Google Scholar]
- Jackson MR, Melideo SL, Jorns MS (2012). Human sulfide: quinone oxidoreductase catalyzes the first step in hydrogen sulfide metabolism and produces a sulfane sulfur metabolite. Biochemistry 51: 6804–6815. [DOI] [PubMed] [Google Scholar]
- Jung M, Kasamatsu S, Matsunaga T, Akashi S, Ono K, Nishimura A et al (2016). Protein polysulfidation‐dependent persulfide dioxygenase activity of ethylmalonic encephalopathy protein 1. Biochem Biophys Res Commun 480: 180–186. [DOI] [PubMed] [Google Scholar]
- Kamyshny A, Borkenstein CG, Ferdelman TG (2009). Protocol for quantitative detection of elemental sulfur and polysulfide zero‐valent sulfur distribution in natural aquatic samples. Geostand Geoanal Res 33: 415–435. [Google Scholar]
- Kamyshny A Jr, Ekeltchik I, Gun J, Lev O (2006). Method for the determination of inorganic polysulfide distribution in aquatic systems. Anal Chem 78: 2631–2639. [DOI] [PubMed] [Google Scholar]
- Kamyshny A Jr, Goifman A, Gun J, Rizkov D, Lev O (2004). Equilibrium distribution of polysulfide ions in aqueous solutions at 25 degrees C: a new approach for the study of polysulfides' equilibria. Environ Sci Technol 38: 6633–6644. [DOI] [PubMed] [Google Scholar]
- Kamyshny A Jr, Gun J, Rizkov D, Voitsekovski T, Lev O (2007). Equilibrium distribution of polysulfide ions in aqueous solutions at different temperatures by rapid single phase derivatization. Environ Sci Technol 41: 2395–2400. [DOI] [PubMed] [Google Scholar]
- Kevil C, Cortese‐Krott MM, Nagy P, Papapetropoulos A, Feelisch M, Szabo C (2017). Chapter 5 – cooperative interactions between NO and H2S: chemistry, biology, physiology, pathophysiology A2 – Ignarro, Louis J In: Freeman BA. (ed.). Nitric Oxide, 3rd edn. Academic Press, pp. 57–83. [Google Scholar]
- Kimura H (2017). Hydrogen sulfide and polysulfide signaling. Antioxid Redox Signal 27: 619–621. [DOI] [PubMed] [Google Scholar]
- Kumar MR, Farmer PJ (2018). Chemical trapping and characterization of small oxoacids of sulfur (SOS) generated in aqueous oxidations of H2S. Redox Biol 14: 485–491. [DOI] [PMC free article] [PubMed] [Google Scholar]
- Kumar V, Kleffmann T, Hampton MB, Cannell MB, Winterbourn CC (2013). Redox proteomics of thiol proteins in mouse heart during ischemia/reperfusion using ICAT reagents and mass spectrometry. Free Radic Biol Med 58: 109–117. [DOI] [PubMed] [Google Scholar]
- Licht S (1987). A description of energy conversion in photoelectrochemical solar cells. Nature 330: 148–151. [Google Scholar]
- Licht S, Hodes G, Manassen J (1986). Numerical analysis of aqueous polysulfide solutions and its application to cadmium chalcogenide polysulfide photoelectrochemical solar cells. Inorg Chem 25: 2486–2489. [Google Scholar]
- Longen S, Richter F, Kohler Y, Wittig I, Beck KF, Pfeilschifter J (2016). Quantitative persulfide site identification (qPerS‐SID) reveals protein targets of H2S releasing donors in mammalian cells. Sci Rep 6. [DOI] [PMC free article] [PubMed] [Google Scholar]
- Maronny G (1959). Constantes de dissociation de l'hydrogène sulfuré. Electrochim Acta 1: 58–69. [Google Scholar]
- Mishanina TV, Libiad M, Banerjee R (2015). Biogenesis of reactive sulfur species for signaling by hydrogen sulfide oxidation pathways. Nat Chem Biol 11: 457–464. [DOI] [PMC free article] [PubMed] [Google Scholar]
- Miyamoto R, Koike S, Takano Y, Shibuya N, Kimura Y, Hanaoka K et al (2017). Polysulfides (H2Sn) produced from the interaction of hydrogen sulfide (H2S) and nitric oxide (NO) activate TRPA1 channels. Sci Rep 7: 45995. [DOI] [PMC free article] [PubMed] [Google Scholar]
- Modis K, Bos EM, Calzia E, van Goor H, Coletta C, Papapetropoulos A et al (2014). Regulation of mitochondrial bioenergetic function by hydrogen sulfide. Part II. Pathophysiological and therapeutic aspects. Br J Pharmacol 171: 2123–2146. [DOI] [PMC free article] [PubMed] [Google Scholar]
- Mustafa AK, Gadalla MM, Sen N, Kim S, Mu W, Gazi SK et al (2009). H2S signals through protein S‐sulfhydration. Sci Signal 2: ra72. [DOI] [PMC free article] [PubMed] [Google Scholar]
- Nagy P (2015). Mechanistic chemical perspective of hydrogen sulfide signaling. Methods Enzymol 554: 3–29. [DOI] [PubMed] [Google Scholar]
- Nagy P, Ashby MT (2007). Reactive sulfur species: kinetics and mechanisms of the oxidation of cysteine by hypohalous acid to give cysteine sulfenic acid. J Am Chem Soc 129: 14082–14091. [DOI] [PubMed] [Google Scholar]
- Nagy P, Winterbourn CC (2010a). Rapid reaction of hydrogen sulfide with the neutrophil oxidant hypochlorous acid to generate polysulfides. Chem Res Toxicol 23: 1541–1543. [DOI] [PubMed] [Google Scholar]
- Nagy P, Winterbourn CC (2010b). Redox chemistry of biological thiols. Advances in Molecular Toxicology 4: 183–222. [Google Scholar]
- Nagy P, Palinkas Z, Nagy A, Budai B, Toth I, Vasas A (2014). Chemical aspects of hydrogen sulfide measurements in physiological samples. Biochim Biophys Acta 1840: 876–891. [DOI] [PubMed] [Google Scholar]
- Olson KR, Gao Y, DeLeon ER, Arif M, Arif F, Arora N et al (2017). Catalase as a sulfide‐sulfur oxido‐reductase: an ancient (and modern?) regulator of reactive sulfur species (RSS). Redox Biol 12: 325–339. [DOI] [PMC free article] [PubMed] [Google Scholar]
- Ono K, Akaike T, Sawa T, Kumagai Y, Wink DA, Tantillo DJ et al (2014). Redox chemistry and chemical biology of H2S, hydropersulfides, and derived species: implications of their possible biological activity and utility. Free Radic Biol Med 77: 82–94. [DOI] [PMC free article] [PubMed] [Google Scholar]
- Padovani D, Hessani A, Castillo FT, Liot G, Andriamihaja M, Lan A et al (2016). Sulfheme formation during homocysteine S‐oxygenation by catalase in cancers and neurodegenerative diseases. Nat Commun 7: 13386. [DOI] [PMC free article] [PubMed] [Google Scholar]
- Palinkas Z, Furtmuller PG, Nagy A, Jakopitsch C, Pirker KF, Magierowski M et al (2015). Interactions of hydrogen sulfide with myeloperoxidase. Br J Pharmacol 172: 1516–1532. [DOI] [PMC free article] [PubMed] [Google Scholar]
- Paul BD, Snyder SH (2012). H2S signalling through protein sulfhydration and beyond. Nat Rev Mol Cell Biol 13: 499–507. [DOI] [PubMed] [Google Scholar]
- Paulsen CE, Carroll KS (2013). Cysteine‐mediated redox signaling: chemistry, biology, and tools for discovery. Chem Rev 113: 4633–4679. [DOI] [PMC free article] [PubMed] [Google Scholar]
- Poole LB, Karplus PA, Claiborne A (2004). Protein sulfenic acids in redox signaling. Annu Rev Pharmacol Toxicol 44: 325–347. [DOI] [PubMed] [Google Scholar]
- Powell MA, Somero GN (1986). Hydrogen sulfide oxidation is coupled to oxidative phosphorylation in mitochondria of Solemya reidi . Science 233: 563–566. [DOI] [PubMed] [Google Scholar]
- Rudolph TK, Freeman BA (2009). Transduction of redox signaling by electrophile–protein reactions. Sci Signal 2: re7. [DOI] [PMC free article] [PubMed] [Google Scholar]
- Scheele CW (1777). Chemische Abhandlung von der Luft und der Feuer, Upsala und Leipzig 153.
- Seeman JI (1986). The Curtin–Hammett principle and the Winstein–Holness equation: new definition and recent extensions to classical concepts. J Chem Educ 63: 42. [Google Scholar]
- Shen XG, Pattillo CB, Pardue S, Bir SC, Wang R, Kevil CG (2011). Measurement of plasma hydrogen sulfide in vivo and in vitro. Free Radic Biol Med 50: 1021–1031. [DOI] [PMC free article] [PubMed] [Google Scholar]
- Sobotta MC, Barata AG, Schmidt U, Mueller S, Millonig G, Dick TP (2013). Exposing cells to H2O2: a quantitative comparison between continuous low‐dose and one‐time high‐dose treatments. Free Radic Biol Med 60: 325–335. [DOI] [PubMed] [Google Scholar]
- Steudel R (2003a). Inorganic polysulfides S‐n(2‐) and radical anions S‐n (center dot‐). Top Curr Chem 231: 127–152. [Google Scholar]
- Steudel R (2003b). Inorganic polysulfanes H2Sn with n > 1. Top Curr Chem 231: 99–125. [Google Scholar]
- Sutton T, Minnion M, Barbarino F, Koster G, Fernandez BO, Cumpstey AF et al (2018). A robust and versatile mass spectrometry platform for comprehensive assessment of the thiol redox metabolome. Redox Biol 16: 359–380. [DOI] [PMC free article] [PubMed] [Google Scholar]
- Szabo C, Ransy C, Modis K, Andriamihaja M, Murghes B, Coletta C et al (2014). Regulation of mitochondrial bioenergetic function by hydrogen sulfide. Part I. Biochemical and physiological mechanisms. Br J Pharmacol 171: 2099–2122. [DOI] [PMC free article] [PubMed] [Google Scholar]
- Toohey JI (2011). Sulfur signaling: is the agent sulfide or sulfane? Anal Biochem 413: 1–7. [DOI] [PubMed] [Google Scholar]
- Vasas A, Doka E, Fabian I, Nagy P (2015). Kinetic and thermodynamic studies on the disulfide‐bond reducing potential of hydrogen sulfide. Nitric oxide: biology and chemistry/official journal of the Nitric Oxide. Society 46: 93–101. [DOI] [PubMed] [Google Scholar]
- Vitvitsky V, Yadav PK, An S, Seravalli J, Cho US, Banerjee R (2017). Structural and mechanistic insights into hemoglobin‐catalyzed hydrogen sulfide oxidation and the fate of polysulfide products. J Biol Chem 292: 5584–5592. [DOI] [PMC free article] [PubMed] [Google Scholar]
- Wintner EA, Deckwerth TL, Langston W, Bengtsson A, Leviten D, Hill P et al (2010). A monobromobimane‐based assay to measure the pharmacokinetic profile of reactive sulphide species in blood. Br J Pharmacol 160: 941–957. [DOI] [PMC free article] [PubMed] [Google Scholar]
- Yamanishi T, Tuboi S (1981). The mechanism of the l‐cystine cleavage reaction catalyzed by rat liver γ‐cystathionase. J Biochem 89: 1913–1921. [DOI] [PubMed] [Google Scholar]
- Zhang D, Macinkovic I, Devarie‐Baez NO, Pan J, Park CM, Carroll KS et al (2014). Detection of protein S‐sulfhydration by a tag‐switch technique. Angew Chem Int Ed Engl 53: 575–581. [DOI] [PMC free article] [PubMed] [Google Scholar]
Associated Data
This section collects any data citations, data availability statements, or supplementary materials included in this article.
Supplementary Materials
Table S1 MRM parameters of various per/polysufide derivatives
Figure S1 Effects of alkylating conditions on polysulfide speciation as detected by UHPLC–MS/MS. A) Preparation methods: 1) 0.0017 g Na2S4 was added to 900 μl buffer with 100 μl IAM solution. 2a) 0.0021 g Na2S4 was added to 900 μl water, then 100 μl IAM was added after dissolving 2b) 0.0020 g Na2S4 was added to 900 μl water with 100 μl IAM 3) 0.0017 g Na2S4 was added to 1000 μl water, then 100 μl of the solution was added to 800 μl buffer with 100 μl IAM. Solutions 1, 2a and 2b were diluted 10x in ultra‐pure water before analysis. In all four conditions the observed speciation pattern is S1 > S2 > S3 > S5 > S4 > S6. B) Preparation methods: 1) 0.0023 g Na2S4 was added to 900 μl buffer with 100 μl NEM solution. 2a) 0.0018 g Na2S4 was added to 900 μl water, then 100 μl NEM was added after dissolving 2b) 0.0017 g Na2S4 was added to 900 μl water with 100 μl NEM 3) 0.0022 g Na2S4 was added to 1000 μl water, then 100 μl of the solution was added to 800 μl buffer with 100 μl NEM. Solutions 1, 2a and 2b were diluted 10x in ultra‐pure water before analysis. Using the same preparation methods as with IAM in condition 1) only S2 and S1 were detected with S2 being more abundant. Conditions 2a) and 2b) show the same pattern of S2 > S1 > S3. Condition 3) shows S1 as most abundant with only S2 and no higher‐chain polysulfides detected.
Figure S2 Representative chromatograms (UHPLC–MS/MS) for NEM and IAM derivatized polysulfides (using Na2S4) as separated using the Modus Aqua UHPLC column (see Materials and Methods 1.2.2). NEM derivatized polysulfides are shown in order of increasing sulfurs from S1 to S4 and elution time from bottom to top, IAM derivatized polysulfides are likewise shown in order of increasing sulfurs from S1 to S7 and elution time from bottom to top.
Figure S3 Differences in polysulfide speciation using three different polysulfide salts with three different preparation conditions. NEM: A) Na2S2, B) Na2S3 and C) Na2S4. IAM: D) Na2S2, E) Na2S3 and F) Na2S4. Condition 1: Na2Sx dissolved in NEM or IAM containing buffer. Condition 2: Na2Sx first dissolved in ultra‐pure water, then diluted in NEM or IAM containing buffer. Condition 3: Na2Sx dissolved in ultra‐pure water, then diluted in buffer, then diluted in NEM or IAM containing buffer. Specific experimental procedures and conditions are described in Scheme S1. Generally, shorter polysulfide chains were observed and speciation was more affected by the preparation conditions with NEM compared with IAM. These observations are consistent with Figure S1.
Figure S4 Effect of NEM on carboxamidomethylated inorganic polysulfide chains as detected by UHPLC–MS/MS A) Polysulfide species seen before addition of NEM to IAM derivatized tetrasulfide. Conditions: 0.0019 g sodium‐tetrasulfide was added to 9 ml water +1 ml 100 mM IAM, then the solution was incubated at room temperature for 10 minutes. An extension of the incubation time for IAM alkylation to 60 min did not change the outcome of the results. Top four chromatograms are provided for comparison to Figure S4B. Amounts of IAM‐S1‐IAM, IAM‐S2‐IAM and IAM‐S3‐IAM are shown as relative abundance compared with IAM‐S1‐IAM (Figure S2A) set as 100%. Amounts of IAM‐S1‐NEM, IAM‐S2‐NEM, IAM‐S3‐NEM and NEM‐S1‐NEM are shown as relative abundance compared with IAM‐S2‐NEM (Figure S4B) set as 100%. B): Polysulfide species detected upon the addition of NEM to IAM‐derivatized tetrasulfide. Spectra were recorded after 10 minute incubation of solutions similar to Figure S4A with NEM. Note the appearance of the mixed IAM‐NEM alkylated species and the NEM‐S1‐NEM signal. Amounts of IAM‐S1‐IAM, IAM‐S2‐IAM and IAM‐S3‐IAM are shown as relative abundance compared with IAM‐S1‐IAM (Figure S4A) set as 100%. Amounts of IAM‐S1‐NEM, IAM‐S2‐NEM, IAM‐S3‐NEM and NEM‐S1‐NEM are shown as relative abundance compared with IAM‐S2‐NEM (Figure S4B) set as 100%. Conditions: 0.0019 g sodium‐tetrasulfide was added to 9 ml water +1 ml 100 mM IAM, then the solution was incubated at room temperature for 5 minutes, followed by the addition of 100 μl of this mixture to 800 μl water +100 μl 10 mM NEM. The solution was incubated at room temperature (20οC) for a further 10 minutes before being analysed.
Figure S5 Time dependence of the stability of Cys or GSH persulfide and trisulfide species, alkylated with 0.1–10 mM HPE–IAM A) Persulfide and B) trisulfide adducts of cysteine, show no significant change or a slow decrease over time, respectively C) Persulfide and D) trisulfide adducts of GSH also show no significant change or a slow decrease over time, respectively. Quantitation of persulfide and trisulfide HPE‐IAM‐derivatives was achieved by using isotopically labelled internal standards as detailed in Materials and Methods. Data points represent the average of n = 3 independent experiments with the corresponding error bars showing the standard deviation. Conditions: 100 μM cysteine/glutathione was treated with 300 μM Na2S2 for 5 minutes and then incubated with 0.1–10 mM HPE–IAM at room temperature for 30 minutes, 60 minutes, 3 hours and 6 hours. Samples were prepared in 30 mM HEPES/KOH buffer (pH = 7.5).
Figure S6 Time dependence of the stability of cysteine and glutathione persulfide species, alkylated with 0.5–10 mM NEM. NEM‐alkylated Cys‐persulfide concentrations dropped relatively fast, but NEM‐alkylated GSH‐persulfide exhibited increased stability. Quantitation of Cys and GSH persulfide NEM‐derivatives was achieved using isotopically labelled internal standards as detailed in Materials and Methods. Data points represent the average of n = 3 independent experiments with the corresponding error bars showing the standard deviation. Conditions: 100 μM cysteine/glutathione was treated with 300 μM Na2S2, at room temperature for 5 minutes, then incubated with 0.5–10 mM NEM at room temperature for 30 minutes, 60 minutes, 3 hours and 6 hours. Samples were prepared in 30 mM HEPES/KOH buffer (pH = 7.5).
Figure S7 Quantitative measurement of Cys, GSH and inorganic polysulfide species derivatized with 0.1–10 mM MBB. Speciation of MBB‐derivatized thiol, persulfide and trisulfide species of A) cysteine or B) GSH as a function of MBB concentration. Quantitation of MBB‐derivatives was achieved by using isotopically labelled internal standards as detailed in Materials and Methods. Data points represent the average of n = 3 independent experiments with the corresponding error bars showing the standard deviation. Conditions: 100 μM cysteine/glutathione was treated with 300 μM Na2S2, at room temperature for 5 minutes, then incubated with 0.1–10 mM MBB at room temperature for 3 hours. Samples were prepared in 30 mM HEPES/KOH buffer (pH = 7.5).
Figure S8 Time dependence of the stability of cysteine and glutathione persulfide species, alkylated with 0.5–10 mM MBB Persulfide adducts of A) cysteine or C) GSH show no significant decrease over time, but B) Cys‐trisulfide and D) GSH‐trisulfide concentrations drop significantly in the applied time window. Quantitation of sulfur species was achieved using isotopically labelled internal standards as detailed in Materials and Methods. Data points represent the average of n = 3 independent experiments with the corresponding error bars showing the standard deviation. Conditions: 100 μM cysteine/glutathione was treated with 300 μM Na2S2, at room temperature for 5 minutes, then incubated with 0.1–10 mM MBB at room temperature for 30 minutes, 60 minutes, 3 hours and 6 hours. Samples were prepared in 30 mM HEPES/KOH buffer (pH = 7.5).
Scheme S1 Experimental workflow for additional polysulfide preparation experiments (Figure 3E and 3F, and Supplementary Figures S2 and S3) Na2Sx, x = 2, 3 or 4, the buffer used was pH 7.4 ammonium phosphate. All experiments were carried out at room temperature (20οC) and repeated three times. The polysulfide solutions were allowed to react with NEM for 10 min and IAM for 30 min to ensure alkylation was complete (and assuming NEM reacts much faster with polysulfides than IAM).