

Abstract
Because circulating tumor DNA (ctDNA) studies focusing on only one or a few genes to monitor the disease progress or treatment response are unlikely to find its clinical significance, the development of cell‐free DNA (cfDNA) panel covering hundreds of mutation hot spots is important for the establishment of clinically practical ctDNA detection system. We enrolled 101 patients with metastatic colorectal cancer (mCRC) who received chemotherapy. Amplicon‐based genomic profiling of 14 genes, which are commonly mutated in CRC, in plasma by next‐generation sequencing (NGS) was carried out to evaluate the feasibility of this assay and was compared with their clinical parameters and RAS status in matched tissue samples. Somatic mutations of the 14 genes in plasma cfDNA were detected in 88 patients (87.1%) with mCRC. Mutations in TP53, KRAS, and APC genes were detected in 70 (69.3%), 39 (38.6%), and 24 (23.7%) patients, respectively. Mutant allele frequencies in plasma were significantly associated with metastasis (liver, P = 0.00004, lymph node, P = 0.008, number of metastatic organs, P = 0.0006), tumor markers (CEA, P = 0.000007, CA19‐9, P = 0.006, LDH, P = 0.00001), and tumor diameter (maximum, P = 0.00002, sum of diameter, P = 0.00009). The overall concordance rate of RAS status between ctDNA and matched tissue was 77.2% (78/101). Our data confirmed that mutant allele in cfDNA can be sensitively detected by amplicon‐based NGS system. These results suggest that ctDNA could be a novel diagnostic biomarker to monitor changes in mutational status and tumor burden in patients with mCRC.
Keywords: circulating tumor DNA (ctDNA), liquid biopsy, metastatic colorectal cancer, RAS, tumor burden
1. INTRODUCTION
Liquid biopsy, which is based on the analysis of circulating tumor DNA (ctDNA), circulating tumor cells (CTCs), and exosomes secreted from cancer cells in peripheral blood, has been expected to enable us to characterize the cancer genome by minimally invasive methods for patients with cancer.1, 2 Of them, ctDNA is one of the most well‐studied technologies because of the recent development of high‐sensitivity next‐generation sequencer and the ability to comprehensively characterize the cancer cells and to detect the time‐course change in tumor genotype.3, 4, 5
The clinical application of ctDNA detection as a “liquid biopsy” has been studied and reported.6, 7 ctDNA is fragmented DNA released from cancer cells into the blood. It represents a small fraction of cell‐free DNA (cfDNA), which is thought to be released into the blood as a result of cell apoptosis and/or necrosis.7, 8, 9 ctDNA is thought to carry information from the entire tumor genome and provide insight into clonal heterogeneity and evolution of cancers.10, 11 Although ctDNA are cleared from the blood by the liver and kidney, its half‐lives range from 15 minutes to several hours, suggesting that it could be a real‐time biomarker for assessment of quality (tumor genotype) and quantity (tumor burden) of the cancer.7, 12 Recently, Food and Drug Administration approved epidermal growth factor receptor (EGFR) mutation test using plasma as a diagnostic tool for the detection of EGFR mutations to predict the erlotinib (EGFR tyrosine kinase inhibitor) response in patients with non‐small‐cell lung cancer.13, 14 Thus, ctDNA monitoring could be useful biomarker for tumor recurrence, drug resistance, and treatment response, which enable physicians to select more appropriate treatment to each patient.15, 16, 17
Techniques for detection of small amount of mutant allele in plasma such as digital PCR (dPCR) or combination of emulsion dPCR and flow cytometry (BEAMING) have had superior sensitivity to the other methods.18, 19, 20 However, studies analyzing ctDNA to monitor the disease progress or treatment response are likely to focus on only one or a few genes using dPCR and showed its limited clinical significance.21, 22, 23 Hence, the development of cfDNA panel, which covers mutation hot spots of commonly mutated genes in CRC, is needed to establish high‐sensitive diagnostic system for plasma ctDNA detection in patients with CRC. In this study, we explored the feasibility of targeted NGS cfDNA panel for 14 genes frequently mutated in CRC using 101 plasma cfDNA of patients with mCRC and investigated its clinical utility by analyzing the relationship between plasma ctDNA and clinicopathological factors.
2. MATERIALS AND METHODS
2.1. Patients
The primary endpoint of this study was to evaluate the feasibility of the ctDNA analysis for detection of prevalent mutations in CRC. One hundred and one patients with mCRC, who received chemotherapies at Cancer Institute Hospital, Japanese Foundation for Cancer Research, were consecutively enrolled in this study from February to June 2017. As shown in Table 1, a specific course of treatment was not required for enrollment in this study. Union for International Cancer Control (UICC) TNM classification was used to determine the tumor and nodal status. This study was approved by the Institutional Review Boards of the Japanese Foundation for Cancer Research (Tokyo, Japan). Written informed consent was obtained from all patients.
Table 1.
Patient demographics and clinical characteristics
| Characteristics | Total (N = 101) no. of patients (%) |
|---|---|
| Age at enrollment, y | |
| Median [range] | 64 [30‐84] |
| Gender | |
| Male | 63 (62.3) |
| Female | 38 (37.7) |
| Treatment line at the time of sampling | |
| Neoadjuvant chemotherapy | 12 (11.9) |
| 1st line | 37 (36.6) |
| 2nd line | 27 (26.7) |
| 3rd or later line | 17 (16.9) |
| Adjuvant chemotherapy | 8 (7.9) |
| Treatment at registration at the time of sampling | |
| FOLFIRI/CPT‐11 + anti‐VEGF antibody | 38 (37.6) |
| SOX/CapeOX/FOLFOX/FOLFOXIRI + anti‐VEGF antibody | 18 (17.8) |
| FOLFOX + anti‐EGFR antibody | 15 (14.8) |
| FOLFIRI/CPT‐11 + anti‐EGFR antibody | 10 (9.9) |
| FOLFOX | 5 (4.9) |
| Regorafenib | 4 (4.0) |
| CapeOX | 3 (3.0) |
| TAS102 | 3 (3.0) |
| 5‐FU + LV/Capecitabine + anti‐VEGF antibody | 2 (2.0) |
| TAS102+anti‐EGFR antibody | 2 (2.0) |
| Capecitabine | 1 (1.0) |
| Primary site | |
| Right‐sided colon | 24 (23.8) |
| Left‐sided colon | 77 (76.2) |
| Resection of primary tumor | |
| Yes | 68 (67.3) |
| No | 33 (32.7) |
| Metastatic site | |
| Single organ | 43 (42.6) |
| Multi‐organ | 58 (57.4) |
| Liver | 75 (73.5) |
| Lung | 41 (40.5) |
| Lymph node | 32 (31.6) |
| Peritoneum | 21 (20.7) |
| Others | 12 (11.8) |
| RAS status in tissue | |
| Wild‐type | 60 (59.4) |
| Mutant | 41 (40.6) |
| Prior Chemotherapy regimen | |
| Anti‐VEGF antibody | 76 (75.2) |
| Anti‐EGFR antibody | 41 (40.6) |
| Cytotoxic drug(s) only | 4 (3.96) |
| Tumor markers | |
| CEA median, [range] | 16 [1‐7479] |
| CA19‐9 median, [range] | 25 [2‐≥50 000] |
CapeOX, a combination of capecitabine with oxaliplatin; CA19‐9, carbohydrate antigen 19‐9; CEA, carcinoembryonic antigen; CPT‐11, irinotecan hydrochloride hydrate; EGFR, epidermal growth factor receptor; FOLFIRI, a combination of calcium folinate and fluorouracil with irinotecan hydrochloride hydrate; FOLFOX, a combination of calcium folinate and fluorouracil with oxaliplatin; FOLFOXIRI, a combination of calcium folinate and fluorouracil and irinotecan hydrochloride hydrate with oxaliplatin; 5‐FU, fluorouracil; LV, calcium folinate; RAS, rat sarcoma viral oncogene homolog; SOX, a combination of tegafur, gimeracil, oteracil potassium with oxaliplatin; TAS102, trifluridine, tipiracil hydrochloride; VEGF, vascular endothelial growth factor.
2.2. Blood samples, ctDNA isolation and sequencing
Blood samples were collected into EDTA tubes following the manufacturer’s instructions. Plasma from blood sample was obtained by centrifugation at 1600 g for 10 minutes at 4°C, followed by another spin at 16 000 g for 10 minutes at 4°C to remove cellular debris. cfDNA was extracted from 2 mL plasma using a MagMAX cfDNA Isolation Kit (Thermo Fisher Scientific) following the manufacturer’s instructions. Oncomine Colon cfDNA Assay (Thermo Fisher Scientific) was used to generate libraries from cfDNA following the manufacturer’s instructions. Quality control of the libraries was performed using the Qubit®2.0 and 2100 Bioanalyzer (Agilent Technologies). Ion Chef™ System and Ion 530™ Kit‐Chef were used for template preparation, followed by sequencing on Ion S5 system using Ion 530 chips. Six‐plex library pool was applied on an Ion 530 chip. The cfDNA panel, which covers 14 genes with >240 hot spots (SNVs and short Indels), such as AKT1, BRAF, CTNNB1, EGFR, ERBB2, FBXW7, GNAS, KRAS, MAP2K1, NRAS, PIK3CA, SMAD4, TP53, and APC, was used in this study. The clean reads were mapped to the human reference genome (hg19). Variant caller was used to filter and call the mutations in targeted regions in each gene.24, 25 Cutoff level for each mutant allele frequency was defined by “variant caller” for each sample (patient). The range of the limit of detection for the variants in KRAS and NRAS was from 0.05 to 0.20 in this study.
2.3. Tumor tissue DNA sequencing
Genomic DNA was extracted from fixed paraffin‐embedded tissues obtained from biopsies or surgical resections. DNA extraction was performed using a modified protocol as described previously.26, 27 For tissue KRAS and NRAS test, RASKET KIT (MBL), which applies the Polymerase Chain Reaction‐Reverse Sequence‐Specific Oligonucleotide method (PCR‐rSSO), was used following the manufacturer’s protocol. We examined twelve types of RAS exon 2 (G12S, G12C, G12R, G12D, G12V, G12A, G13S, G13C, G13R, G13D, G13V, and G13A), eight types of RAS exon 3 (A59T, A59G, Q61K, Q61E, Q61L, Q61P, Q61R, and Q61H), and four types of RAS exon 4 (K117N, A146T, A146P, and A146V) mutations using Luminex 100/200TM (Luminex) and UniMAG (MBL) system, as previously described.28, 29
2.4. Statistical analysis
We investigated the association of clinicopathological factors with ctDNA levels, which are the highest allele frequency of the detected mutant alleles in each patient, and amount of cfDNA using Welch’s t test. The differences in sum of the tumor diameter among RAS status groups were also evaluated by Welch’s t test. Statistical tests provided two‐sided P values, and a significance level of P < 0.05 was used. Statistical analyses were carried out using statistical software “EZR” (Easy R), which is based on R and R commander.
3. RESULTS
3.1. Patient characteristics
To examine the feasibility of ctDNA detection in plasma using amplicon‐based NGS, we recruited 101 patients with mCRC receiving chemotherapy in neoadjuvant, adjuvant, or metastatic setting. The characteristics of these 101 patients who were diagnosed to have mCRC were summarized in Table 1. Their median age at the time of recruitment was 64 years old (range, 30‐84 years), and 63 were men (62.3%). Liver was the most frequent site of metastasis (73.5%), followed by lung (40.5%), lymph node (31.6%), and peritoneum (20.7%). Of the 101 patients, 60 (59.4%) showed wild‐type RAS in their tissues obtained from tissue biopsy or surgical specimen, and 41 (40.6%) patients received anti‐EGFR antibody therapy before blood collection for ctDNA analysis (liquid biopsy) in this study (Table 1).
3.2. Detection of somatic mutations in plasma
Of the 101 patients recruited in this study, one or more somatic mutations in the 14 colorectal cancer‐related genes (AKT1, BRAF, CTNNB1, EGFR, ERBB2, FBXW7, GNAS, KRAS, MAP2K1, NRAS, PIK3CA, SMAD4, TP53, and APC) were detected in 88 (87.1%) plasma of patients with mCRC (Figure S1). The range of the mutant allele frequencies in each gene was shown in Table S1. Mutations in TP53, KRAS, and APC genes were detected in 70 (69.3%), 39 (38.6%), and 24 (23.7%) patients, respectively (Figure 1). FBXW7 and PIK3CA genes were also frequently mutated (17 (16.8%) and 14 (13.8%) patients, respectively, Figure 1). Mutations in GNAS (8.9%), BRAF (7.9%), SMAD4 (5.9%), NRAS (4.9%), MAP2K1 (3.9%), EGFR (3.9%), ERBB2 (1.9%), and CTNNB1 (0.9%) were less common (<10% of patients) compared to the above genes (Figure 1).
Figure 1.
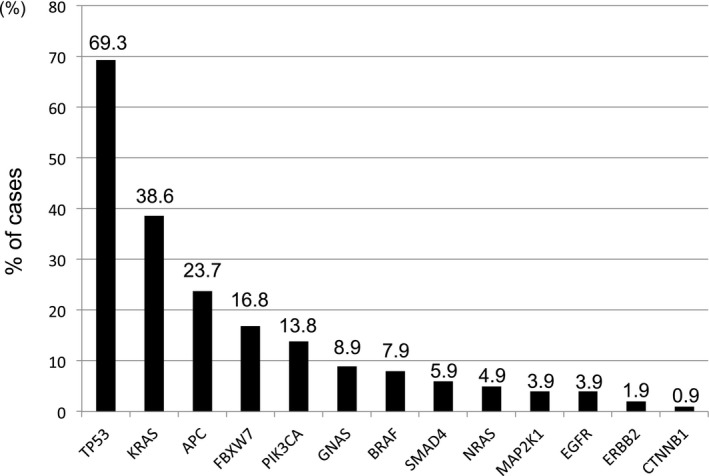
Frequencies of mutated genes in 101 CRC patients’ plasma. One or more mutations were detected in all genes on the panel except AKT1
3.3. Association of clinical factors with cfDNA in patients with mCRC
To assess the clinical utility of mutation detection in plasma of patients with mCRC by using amplicon‐based deep sequencing, we investigated the association between clinical factors, which could be correlated with tumor burden, and ctDNA level (the highest allele frequency of the detected mutant alleles in each patient) in plasma of patients with mCRC. The clinical factors used in this association study were primary tumor location, metastatic target organ, number of metastatic organs, tumor markers, and tumor diameters (Table 2). Patients with liver or lymph node metastasis showed significantly higher ctDNA level in their plasma compared to those without them (P = 0.00004 and P = 0.008, respectively, Table 2). Furthermore, ctDNA levels of patients with multi‐organ metastasis were significantly higher than those with single organ metastasis (P = 0.0006, Table 2). Tumor markers, carcinoembryonic antigen (CEA), carbohydrate antigen 19‐9 (CA19‐9), lactate dehydrogenase (LDH), were significantly associated with ctDNA level of patients with mCRC (P = 0.000007, P = 0.006 and P = 0.00001, respectively, Table 2), and maximum and sum of the tumor diameter were also significantly associated with their ctDNA level (P = 0.00002 and P = 0.00009, Table 2). On the other hand, total amount of cfDNA was significantly associated with only CEA, maximum and sum of the tumor diameter, and the association was weaker (P = 0.002, 0.009 and 0.004, respectively) than those observed in ctDNA level.
Table 2.
Association of clinical factors with ctDNA level and amount of cfDNA in plasma
| Clinical characteristics | ctDNA levela (average, %) | P value | cfDNA (ng/ml) | P value |
|---|---|---|---|---|
| Primary tumor location | ||||
| Right‐sided colon | 15.4 | 0.18 | 4.2 | 0.10 |
| Left‐sided colon | 8.6 | 2.1 | ||
| Liver metastasis | ||||
| Positive | 13.1 | 0.00004 | 2.9 | 0.06 |
| Negative | 2.0 | 1.7 | ||
| Lung metastasis | ||||
| Positive | 10.5 | 0.89 | 2.0 | 0.17 |
| Negative | 10.1 | 3.0 | ||
| Peritoneal metastasis | ||||
| Positive | 10.5 | 0.94 | 3.9 | 0.10 |
| Negative | 10.2 | 2.2 | ||
| Lymph node metastasis | ||||
| Positive | 19.0 | 0.008 | 2.7 | 0.87 |
| Negative | 6.2 | 2.5 | ||
| Number of metastatic organs | ||||
| Single organ | 3.7 | 0.0006 | 2.5 | 0.80 |
| Multi‐organ | 14.8 | 2.7 | ||
| CEA (ng/mL) | ||||
| <5 | 1.4 | 0.000007 | 1.3 | 0.002 |
| ≥5 | 13.5 | 3.0 | ||
| CA19‐9 (U/mL) | ||||
| <37 | 5.8 | 0.006 | 2.0 | 0.08 |
| ≥37 | 16.2 | 3.4 | ||
| LDH (U/L) | ||||
| <245 | 2.5 | 0.00001 | 2.1 | 0.17 |
| ≥245 | 20.4 | 3.2 | ||
| D‐dimer (μg/L) | ||||
| <1.6 | 10.2 | 0.63 | 2.3 | 0.15 |
| ≥1.6 | 12.7 | 4.6 | ||
| Maximum tumor diameterb (mm) | ||||
| <medianc | 3.3 | 0.00002 | 1.6 | 0.009 |
| ≥median | 18.4 | 3.5 | ||
| Sum of the tumor diameterb (mm) | ||||
| <mediand | 2.5 | 0.00009 | 1.5 | 0.004 |
| ≥median | 17.2 | 3.8 | ||
CA19‐9, carbohydrate antigen 19‐9; CEA, carcinoembryonic antigen; LDH, lactate dehydrogenase.
The highest allele frequency of the detected mutant alleles in each patient.
RECIST ver 1.1 criteria.
28 mm.
46 mm.
3.4. Comparison of RAS status between paired tissue and plasma samples
In this study, tissue biopsy had been carried out prior to blood collection for plasma ctDNA analysis (liquid biopsy), and all patients have received anticancer therapy including chemotherapy and/or molecular targeted therapy between tissue and liquid biopsy. To investigate the change in RAS status after the chemotherapy and/or molecular targeting therapy, we compared the RAS status in tumor obtained by tissue biopsy with those in plasma (ctDNA). Of the 101 patients used in this study, 41 patients (40.6%) had a tissue RAS mutation, which were analyzed by PCR‐reverse sequence‐specific oligonucleotide (PCR‐rSSO, RASKET®) as shown in Table 3. Of them, plasma RAS mutation was also found in 31 patients (75.6%). On the other hand, 60 patients (59.4%) did not have a tissue RAS mutation, and of them, 47 patients (78.3%) also showed no mutated RAS in their plasma (Table 3). Hence, the overall concordance rate of RAS status between tissue and ctDNA in 101 patients was 77.2% (78/101), indicating that 23 patients showed discordant mutation status of RAS between tissue and matched plasma (Table 3). We further investigated the cause of the discordant RAS status between tissue and plasma. Of the 13 patients, who had no RAS mutation in tissue but have the mutation in plasma, 11 patients (84.6%) had received anti‐EGFR inhibitor therapy before liquid biopsy (Table 4). However, of the 47 patients, who had no RAS mutation in both tissue and plasma, only 29 patients (61.7%) had received anti‐EGFR inhibitor therapy before liquid biopsy (Table S2), suggesting the impact of anti‐EGFR inhibitor therapy on change in RAS status. On the other hand, sum of the tumor diameter of patients with RAS mutation‐positive in tissue but negative in plasma (Table 4) was significantly smaller than those of patients with RAS mutation‐positive in both tissue and plasma (Table S2), suggesting that decrease in tumor burden causes undetectable RAS mutation in plasma (16.2 and 86.0 mm on average, respectively, P = 0.00000015, Figure S2).
Table 3.
RAS mutations detected in paired tissue and plasma
| Tissue RAS | |||
|---|---|---|---|
| No mutated | Mutated | Total | |
| Plasma RAS | |||
| No mutated | 47 | 10 | 57 |
| Mutated | 13 | 31 | 44 |
| Total | 60 | 41 | 101 |
RAS, rat sarcoma viral oncogene homolog.
Table 4.
Characterization of cases showing discordant RAS status between tissue and plasma
| No mutated RAS in tissue, mutated RAS in plasma | |||||||
|---|---|---|---|---|---|---|---|
| No | Codon (Plasma) | Mutant allele frequency in plasma (%) | Primary tumor resection | Site of metastasis | Chemotherapy at the time of liquid biopsy | Sum of the tumor diametera (mm) | Anti‐EGFR inhibitor therapy (before or at the time of liquid biopsy) |
| 1 | KRAS C/T position 25398282 | 0.07 | + | Liver, Lung, Peritoneal | CPT‐11 + C‐mab | 234 | + |
| 2 | KRAS T/A position 25380275 | 2.03 | + | Liver, Peritoneal, Lymph node | CPT‐11 + C‐mab | 53 | + |
| 3 | KRAS G12D | 1.42 | − | Liver, Peritoneal | TAS102+P‐mab | 68 | + |
| 4 | KRAS G12A, G12D | 6.53, 2.97 | + | Liver, Lymph node, renal | Regorafenib | 144 | + |
| 5 | KRAS G12V | 0.34 | + | Lung, Liver | 5‐FU/LV+BEV | 17 | − |
| 6 | KRAS G12D | 0.15 | + | lung | FOLFOX+P‐mab | 6 | + |
| 7 | KRAS G12D, G13D | 0.09, 0.14 | + | Lung, Lymph node | FOLFOX+C‐mab | 11 | + |
| 8 | KRAS G12D, G13D | 0.09, 0.09 | + | None | CapeOX | 0 | − |
| 9 | KRAS G12D | 0.13 | + | Lung | FOLFOX+P‐mab | 7 | + |
| 10 | KRAS G12A, KRAS G12D, KRAS Q61H | 7.45, 0.21,0.93 | + | Liver | Regorafenib | 92 | + |
| 11 | KRAS G12V | 0.1 | − | Liver, Lymph node | FOLFOX+C‐mab | 46 | + |
| 12 | NRAS Q61K | 0.22 | − | Liver, Lymph node | FOLFIRI+RAM | 50 | + |
| 13 | KRAS G13D | 0.37 | + | Liver lung | FOLFIRI+RAM | 68 | + |
| Mutated RAS in tissue, no mutated RAS in plasma | |||||||
|---|---|---|---|---|---|---|---|
| No | Codon (Tissue) | Mutant allele frequency in plasma (%) | Primary tumor resection | Site of metastasis | Chemotherapy at the time of liquid biopsy | Sum of the tumor diametera (mm) | Anti‐EGFR inhibitor therapy (before or at the time of liquid biopsy) |
| 1 | KRAS G12R | – | + | Liver | FOLFIRI+BEV | 23 | − |
| 2 | NRAS Q61K | – | + | Lung | FOLFIRI+BEV | 14 | − |
| 3 | KRAS G12V | – | + | Lung | FOLFIRI+BEV | 35 | − |
| 4 | KRAS G12D | – | + | Liver, Lymph node | FOLFOX+BEV | 27 | − |
| 5 | KRAS G12V | – | + | Peritoneal | FOLFIRI+BEV | 0 | − |
| 6 | NRAS Q61H | – | − | Liver | FOLFOX+BEV | 32 | − |
| 7 | NRAS Q61H | – | + | Lung, Lymph node | FOLFIRI+BEV | 10 | − |
| 8 | KRAS G12D | – | + | Liver, Peritonial | FOLFIRI+BEV | 7 | − |
| 9 | KRAS G13D | – | + | None | FOLFOX | 0 | − |
| 10 | KRAS G12V | – | + | Lung | FOLFIRI+BEV | 14 | − |
BEV: bevacizumab; CPT‐11: irinotecan hydrochloride hydrate; C‐mab: cetuximab; EGFR: epidermal growth factor receptor; FOLFOX: a combination of calcium folinate and fluorouracil with oxaliplatin; FOLFIRI: a combination of calcium folinate and fluorouracil with irinotecan hydrochloride hydrate; FOLFOXIRI: a combination of calcium folinate and fluorouracil and irinotecan hydrochloride hydrate with oxaliplatin; 5‐FU: fluorouracil; LV: calcium folinate; P‐mab: panitumumab; RAS: rat sarcoma viral oncogene homolog; RAM: ramucirumab; CapeOX: a combination of capecitabine with oxaliplatin; SOX: a combination of tegafur, gimeracil, oteracil potassium with oxaliplatin; TAS102: trifluridine, tipiracil hydrochloride.
RECIST ver 1.1 criteria.
4. DISCUSSION
In this study, we used a 14‐gene panel, which was designed by identifying frequently mutated genes in colon cancer, for deep sequencing by targeted NGS system, and presented evidence for the feasibility and clinical utility of ctDNA detection for the management of patients with mCRC. Similar to the results of the previously reported studies,30, 31 we also observed highly sensitive detection of ctDNA in plasma of patients with mCRC by using the amplicon‐based deep sequencing with molecular barcodes (Figure S1), suggesting that the panel of 14 genes with >240 hot spots selected as frequently mutated genes in colon cancer could be feasible for liquid biopsy in patients with CRC.
Although the amount of cfDNA has been reported to be associated with the clinical factors, which were suggestively correlated with tumor burden such as metastasis and tumor markers,32, 33 we found that ctDNA level is likely to be more correlated with those factors than cfDNA (Table 2). We observed significant association of ctDNA level with liver metastasis and sum of the tumor diameter in metastatic sites, which were commonly reported to be strongly associated with ctDNA level.20, 34, 35 While the controversial or null association of ctDNA level with the lung, lymph node and peritoneal metastasis, tumor markers, primary tumor location, and number of metastatic organs has been reported,20, 34, 36, 37 we observed significant association between ctDNA level and lymph node metastasis, number of metastatic organs, and tumor markers (CEA, CA19‐9, and LDH). Although different sample size and sampling bias may cause these discordant results, the above associations should be further validated by using a larger number of samples.
Because EGFR signaling has been recognized as an important player in CRC initiation and progression,38, 39, 40 EGFR inhibitors, which are effective in CRC harboring wild‐type RAS, have been used as one of the important molecular targeted therapies for CRC.41, 42, 43 Hence, RAS mutation analysis using plasma sample is expected to be applicable for the prediction of response to EGFR inhibitors and monitoring the change in RAS status of mCRC. Although the timing of liquid biopsy (blood collection) after tissue biopsy in each patient was inconsistent in this study, the concordance rate of RAS status between tissue and matched plasma was 77.2% (78/101). Of the remaining 23 patients showing discordant RAS status, plasma RAS mutation was not detected in 10 patients with RAS mutant tumors. This discordant result could be partly explained by the fact that sum of the tumor diameter in patients with tissue RAS mutant but without plasma RAS mutant (Table 4 (lower)) is significantly smaller than those in patients with mutant RAS in both tissue and plasma (Table S2), suggesting that mutant RAS was undetectable in plasma due to tumor shrinkage by the efficacy of anticancer therapy following tissue biopsy (Figure S2). In contrast, ctDNA of 13 patients showed the presence of RAS mutations that were not detected on tissue, and they were likely to have received anti‐EGFR inhibitor therapy before or at the time of liquid biopsy (11 cases; 84.6%, Table 4 (upper)) compared to those without RAS mutation in both plasma and tissue (29 out of 47 cases; 61.7%, Table S2).44 As one of the mechanisms of acquiring resistance to anti‐EGFR therapy for CRC, point mutation in extracellular domain of EGFR (S492R) has been reported to make resistant to this therapy,45, 46 and amplification of receptor tyrosine kinase genes such as ERBB2 or MET is also associated with acquiring resistance to anti‐EGFR inhibitor.47, 48 Furthermore, resistance to anti‐EGFR inhibitors is related to constitutive activation of signaling pathways downstream of EGFR including KRAS, NRAS, and BRAF.49, 50 Of them, one of the most common molecular mechanisms that drive acquiring resistance to anti‐EGFR inhibitor therapy for CRC is mutations in KRAS.18, 21 Although we could not investigate the relationship between the emergence of KRAS mutation in plasma and clinical response in this study, the plasma RAS mutations newly emerged after this therapy in the above 11 cases may represent a sign of expansion of resistant clones to anti‐EGFR inhibitors. One of the other possibilities which causes the above discordant RAS status between tissue and plasma is that the deep sequencing of cfDNA used for RAS mutational analysis could have higher sensitivity compared to the PCR‐rSSO techniques used in RAS mutation analysis for tissues. Moreover, these discordant results might suggest that liquid biopsy (ctDNA analysis) could provide more comprehensive information of mutational character of tumors, therefore could avoid the influence of tissue sampling bias in RAS mutation test.
Because total number of ctDNA genomic alterations might be related to the characteristics of the cancers,30, 51 we examined the association of the number of mutations with metastasis, tumor markers, and sum of the tumor diameter. We observed that CA19‐9 and sum of the tumor diameters were significantly higher in patients with 2 or more mutations detected in their plasma compared with those with one mutation (CA19‐9: P = 0.010, diameter: P = 0.016, Table S3), and liver metastasis also indicated marginal association with the number of mutations (P = 0.066, Table S3). We further examined the relationship between specific gene mutation and metastatic site and found that mutations in KRAS, GNAS, and SMAD4 were significantly associated with lung metastasis (P = 0.039, 0.029, and 0.039, respectively, Table S4). Because KRAS mutational status could partially determine the biological aspect in colon cancer,52 we compared the mutations detected in plasma and clinicopathological parameters in patients with KRAS mutation‐positive with those in patients with KRAS mutation‐negative. The frequencies of lung metastasis, mutations in TP53, NRAS, and EGFR, the level of tumor markers (CEA and CA19‐9), and sum of the tumor diameter in patients with plasma KRAS mutation‐positive were higher compared to those in patients with KRAS mutation‐negative (Table S5).
There are limitations in this study because the number of patients assessed is limited and the detection method for RAS mutation is different between tissue and plasma. The use of a blood samples collected at different time points also precluded appropriate comparison of RAS mutational status between tissue and plasma, and single‐point blood sampling makes it impossible to analyze time‐course change in ctDNA during chemotherapies, which could be more useful information to assess the chemotherapeutic response. Moreover, the frequencies of mutated genes in plasma ctDNA of patients with CRC in our study were inconsistent with those in tissue DNA which had been reported in mutation database including The Cancer Genome Atlas.53, 54 Although the mutation frequency of APC gene in CRC tissue has been reported to be ~80%,53, 55 it revealed only 23.7% in our data (plasma), which was significantly lower frequency than that in tissue. The difference of the above frequencies could be partially explained by insufficient coverage of mutation detection in APC gene of the panel used in our ctDNA study. The further technical improvement of the panel, which covers sufficient hot spot mutations of APC gene, would increase the mutation detection of APC gene in plasma of patients with CRC. Moreover, although the limit of detection of the variant used in this study was reported to be 0.1%,56 we did not evaluate the detection limit of the assay in our samples. Detection limit of each mutant allele frequency was defined by the algorism in “variant caller,” which is the software for detection of variants, for each patient. Further study to evaluate the actual detection limit under several conditions (methods of blood collection, amounts of cfDNA for library construction, etc) might be needed for clinical application of this assay.
In conclusion, our data confirmed that small fraction of mutant allele in cfDNA could be detected by amplicon‐based NGS assay using cfDNA panel. Although our data suggested that the quantification of ctDNA by using NGS with molecular barcode system could be a novel biomarker for tumor burden, further technical development to increase sensitivity and specificity for detection of mutant allele and robust clinical test would be needed for the development of clinical practice recommendation.
CONFLICT OF INTEREST
None of the authors have any conflicts of interest to declare.
Supporting information
ACKNOWLEDGMENTS
We express our heartfelt gratitude to all the study participants. We thank Dr. Yusuke Nakamura for his contribution to establishment of study design, and Ms. Aya Imai and Mr. Yuki Sano for technical assistance. We thank Dr. Konosuke Nakayama and Ms. Kazumi Kaihara, and all other members and staffs for their contribution to the sample collection and the completion of our study.
Osumi H, Shinozaki E, Takeda Y, et al. Clinical relevance of circulating tumor DNA assessed through deep sequencing in patients with metastatic colorectal cancer. Cancer Med. 2019;8:408–417. 10.1002/cam4.1913
REFERENCES
- 1. Crowley E, Di Nicolantonio F, Loupakis F, Bardelli A. Liquid biopsy: monitoring cancer‐genetics in the blood. Nat Rev Clin Oncol. 2013;10:472‐484. [DOI] [PubMed] [Google Scholar]
- 2. Siravegna G, Marsoni S, Siena S, Bardelli A. Integrating liquid biopsies into the management of cancer. Nat Rev Clin Oncol. 2017;14:531‐548. [DOI] [PubMed] [Google Scholar]
- 3. Kim ST, Lee WS, Lanman RB, et al. Prospective blinded study of somatic mutation detection in cell‐free DNA utilizing a targeted 54‐gene next generation sequencing panel in metastatic solid tumor patients. Oncotarget. 2015;6:40360‐40369. [DOI] [PMC free article] [PubMed] [Google Scholar]
- 4. Jovelet C, Ileana E, Le Deley MC, et al. Circulating cell‐free tumor DNA analysis of 50 genes by next‐generation sequencing in the prospective MOSCATO trial. Clin Cancer Res. 2016;22:2960‐2968. [DOI] [PubMed] [Google Scholar]
- 5. Aravanis AM, Lee M, Klausner RD. Next‐generation sequencing of circulating tumor DNA for early cancer detection. Cell. 2017;168:571‐574. [DOI] [PubMed] [Google Scholar]
- 6. Alix‐Panabieres C, Pantel K. Clinical applications of circulating tumor cells and circulating tumor DNA as liquid biopsy. Cancer Discov. 2016;6:479‐491. [DOI] [PubMed] [Google Scholar]
- 7. Wan J, Massie C, Garcia‐Corbacho J, et al. Liquid biopsies come of age: towards implementation of circulating tumour DNA. Nat Rev Cancer. 2017;17:223‐238. [DOI] [PubMed] [Google Scholar]
- 8. Lo YM, Chan KC, Sun H, et al. Maternal plasma DNA sequencing reveals the genome‐wide genetic and mutational profile of the fetus. Sci Transl Med. 2010;2:61ra91. [DOI] [PubMed] [Google Scholar]
- 9. Thierry AR, Mouliere F, Gongora C, et al. Origin and quantification of circulating DNA in mice with human colorectal cancer xenografts. Nucleic Acids Res. 2010;38:6159‐6175. [DOI] [PMC free article] [PubMed] [Google Scholar]
- 10. Burrell RA, Swanton C. Tumour heterogeneity and the evolution of polyclonal drug resistance. Mol Oncol. 2014;8:1095‐1111. [DOI] [PMC free article] [PubMed] [Google Scholar]
- 11. Calapre L, Warburton L, Millward M, Ziman M, Gray ES. Circulating tumour DNA (ctDNA) as a liquid biopsy for melanoma. Cancer Lett. 2017;404:62‐69. [DOI] [PubMed] [Google Scholar]
- 12. Diaz LA Jr, Bardelli A. Liquid biopsies: genotyping circulating tumor DNA. J Clin Oncol. 2014;32:579‐586. [DOI] [PMC free article] [PubMed] [Google Scholar]
- 13. Wu YL, Zhou C, Liam CK, et al. First‐line erlotinib versus gemcitabine/cisplatin in patients with advanced EGFR mutation‐positive non‐small‐cell lung cancer: analyses from the phase III, randomized, open‐label, ENSURE study. Ann Oncol. 2015;26:1883‐1889. [DOI] [PubMed] [Google Scholar]
- 14. Malapelle U, Sirera R, Jantus‐Lewintre E, et al. Profile of the Roche cobas(R) EGFR mutation test v2 for non‐small cell lung cancer. Expert Rev Mol Diagn. 2017;17:209‐215. [DOI] [PubMed] [Google Scholar]
- 15. Diehl F, Schmidt K, Choti MA, et al. Circulating mutant DNA to assess tumor dynamics. Nat Med. 2008;14:985‐990. [DOI] [PMC free article] [PubMed] [Google Scholar]
- 16. Siravegna G, Mussolin B, Buscarino M, et al. Clonal evolution and resistance to EGFR blockade in the blood of colorectal cancer patients. Nat Med. 2015;21:795‐801. [DOI] [PMC free article] [PubMed] [Google Scholar]
- 17. Bardelli A, Pantel K. Liquid biopsies, what we do not know (yet). Cancer Cell. 2017;31:172‐179. [DOI] [PubMed] [Google Scholar]
- 18. Diaz LA Jr, Williams RT, Wu J, et al. The molecular evolution of acquired resistance to targeted EGFR blockade in colorectal cancers. Nature. 2012;486:537‐540. [DOI] [PMC free article] [PubMed] [Google Scholar]
- 19. Morelli MP, Overman MJ, Dasari A, et al. Characterizing the patterns of clonal selection in circulating tumor DNA from patients with colorectal cancer refractory to anti‐EGFR treatment. Ann Oncol. 2015;26:731‐736. [DOI] [PMC free article] [PubMed] [Google Scholar]
- 20. Vidal J, Muinelo L, Dalmases A, et al. Plasma ctDNA RAS mutation analysis for the diagnosis and treatment monitoring of metastatic colorectal cancer patients. Ann Oncol. 2017;28:1325‐1332. [DOI] [PMC free article] [PubMed] [Google Scholar]
- 21. Misale S, Yaeger R, Hobor S, et al. Emergence of KRAS mutations and acquired resistance to anti‐EGFR therapy in colorectal cancer. Nature. 2012;486:532‐536. [DOI] [PMC free article] [PubMed] [Google Scholar]
- 22. Spindler KL, Pallisgaard N, Vogelius I, Jakobsen A. Quantitative cell‐free DNA, KRAS, and BRAF mutations in plasma from patients with metastatic colorectal cancer during treatment with cetuximab and irinotecan. Clin. Cancer Res. 2012;18:1177‐1185. [DOI] [PubMed] [Google Scholar]
- 23. Spindler KG, Appelt AL, Pallisgaard N, Andersen RF, Jakobsen A. KRAS‐mutated plasma DNA as predictor of outcome from irinotecan monotherapy in metastatic colorectal cancer. Br J Cancer. 2013;109:3067‐3072. [DOI] [PMC free article] [PubMed] [Google Scholar]
- 24. Shin S, Kim Y, Chul OS, et al. Validation and optimization of the Ion Torrent S5 XL sequencer and Oncomine workflow for BRCA1 and BRCA2 genetic testing. Oncotarget. 2017;8:34858‐34866. [DOI] [PMC free article] [PubMed] [Google Scholar]
- 25. Xu C. A review of somatic single nucleotide variant calling algorithms for next‐generation sequencing data. Comput Struct Biotechnol J. 2018;16:15‐24. [DOI] [PMC free article] [PubMed] [Google Scholar]
- 26. Gilbert MT, Haselkorn T, Bunce M, et al. The isolation of nucleic acids from fixed, paraffin‐embedded tissues‐which methods are useful when? PLoS ONE. 2007;2:e537. [DOI] [PMC free article] [PubMed] [Google Scholar]
- 27. Fukushima Y, Yanaka S, Murakami K, et al. High‐throughput screening method of KRAS mutations at codons 12 and 13 in formalin‐fixed paraffin‐embedded tissue specimens of metastatic colorectal cancer. Gan to kagaku ryoho Cancer Chemother. 2011;38:1825‐1835. [PubMed] [Google Scholar]
- 28. Taniguchi H, Yamazaki K, Yoshino T, et al. Japanese Society of Medical Oncology Clinical Guidelines: RAS (KRAS/NRAS) mutation testing in colorectal cancer patients. Cancer Sci. 2015;106:324‐327. [DOI] [PMC free article] [PubMed] [Google Scholar]
- 29. Yoshino T, Muro K, Yamaguchi K, et al. Clinical validation of a multiplex kit for RAS mutations in colorectal cancer: results of the RASKET (RAS KEy testing) prospective, multicenter study. EBioMedicine. 2015;2:317‐323. [DOI] [PMC free article] [PubMed] [Google Scholar]
- 30. Thompson JC, Yee SS, Troxel AB, et al. Detection of therapeutically targetable driver and resistance mutations in lung cancer patients by next‐generation sequencing of cell‐free circulating tumor DNA. Clin Cancer Res. 2016;22:5772‐5782. [DOI] [PMC free article] [PubMed] [Google Scholar]
- 31. Hou H, Yang X, Zhang J, et al. Discovery of targetable genetic alterations in advanced non‐small cell lung cancer using a next‐generation sequencing‐based circulating tumor DNA assay. Sci Rep. 2017;7:14605‐15000. [DOI] [PMC free article] [PubMed] [Google Scholar]
- 32. da Silva Filho BF, Gurgel AP, Neto MA, et al. Circulating cell‐free DNA in serum as a biomarker of colorectal cancer. J Clin Pathol. 2013;66:775‐778. [DOI] [PubMed] [Google Scholar]
- 33. Hao TB, Shi W, Shen XJ, et al. Circulating cell‐free DNA in serum as a biomarker for diagnosis and prognostic prediction of colorectal cancer. Br J Cancer. 2014;111:1482‐1489. [DOI] [PMC free article] [PubMed] [Google Scholar]
- 34. Tie J, Kinde I, Wang Y, et al. Circulating tumor DNA as an early marker of therapeutic response in patients with metastatic colorectal cancer. Ann Oncol. 2015;26:1715‐1722. [DOI] [PMC free article] [PubMed] [Google Scholar]
- 35. Bachet JB, Bouche O, Taieb J, et al. RAS mutation analysis in circulating tumor DNA from patients with metastatic colorectal cancer: the AGEO RASANC prospective multicenter study. Ann Oncol. 2018;29:1211‐1219. [DOI] [PubMed] [Google Scholar]
- 36. Yamada T, Iwai T, Takahashi G, et al. Utility of KRAS mutation detection using circulating cell‐free DNA from patients with colorectal cancer. Cancer Sci. 2016;107:936‐943. [DOI] [PMC free article] [PubMed] [Google Scholar]
- 37. Takayama Y, Suzuki K, Muto Y, et al. Monitoring circulating tumor DNA revealed dynamic changes in KRAS status in patients with metastatic colorectal cancer. Oncotarget. 2018;9:24398‐24413. [DOI] [PMC free article] [PubMed] [Google Scholar]
- 38. Salomon DS, Brandt R, Ciardiello F, Normanno N. Epidermal growth factor‐related peptides and their receptors in human malignancies. Crit Rev Oncol/Hematol. 1995;19:183‐232. [DOI] [PubMed] [Google Scholar]
- 39. Bianco R, Gelardi T, Damiano V, Ciardiello F, Tortora G. Rational bases for the development of EGFR inhibitors for cancer treatment. Int J Biochem Cell Biol. 2007;39:1416‐1431. [DOI] [PubMed] [Google Scholar]
- 40. Markman B, Javier Ramos F, Capdevila J, Tabernero J. EGFR and KRAS in colorectal cancer. Adv Clin Chem. 2010;51:71‐119. [DOI] [PubMed] [Google Scholar]
- 41. Heinemann V, Rivera F, O'Neil BH, et al. A study‐level meta‐analysis of efficacy data from head‐to‐head first‐line trials of epidermal growth factor receptor inhibitors versus bevacizumab in patients with RAS wild‐type metastatic colorectal cancer. Eur J Cancer. 2016;67:11‐20. [DOI] [PubMed] [Google Scholar]
- 42. Arnold D, Lueza B, Douillard JY, et al. Prognostic and predictive value of primary tumour side in patients with RAS wild‐type metastatic colorectal cancer treated with chemotherapy and EGFR directed antibodies in six randomized trials. Ann Oncol. 2017;28:1713‐1729. [DOI] [PMC free article] [PubMed] [Google Scholar]
- 43. Chan D, Segelov E, Wong RS, et al. Epidermal growth factor receptor (EGFR) inhibitors for metastatic colorectal cancer. The. Cochrane Database Syst Rev. 2017;6:CD007047. [DOI] [PMC free article] [PubMed] [Google Scholar]
- 44. Van Emburgh BO, Arena S, Siravegna G, et al. Acquired RAS or EGFR mutations and duration of response to EGFR blockade in colorectal cancer. Nat Commun. 2016;7:13665. [DOI] [PMC free article] [PubMed] [Google Scholar]
- 45. Montagut C, Dalmases A, Bellosillo B, et al. Identification of a mutation in the extracellular domain of the Epidermal Growth Factor Receptor conferring cetuximab resistance in colorectal cancer. Nat Med. 2012;18:221‐223. [DOI] [PubMed] [Google Scholar]
- 46. Bagchi A, Haidar JN, Eastman SW, et al. Molecular basis for necitumumab inhibition of EGFR variants associated with acquired cetuximab resistance. Mol Cancer Ther. 2018;17:521‐531. [DOI] [PMC free article] [PubMed] [Google Scholar]
- 47. Misale S, Di Nicolantonio F, Sartore‐Bianchi A, Siena S, Bardelli A. Resistance to anti‐EGFR therapy in colorectal cancer: from heterogeneity to convergent evolution. Cancer Discov. 2014;4:1269‐1280. [DOI] [PubMed] [Google Scholar]
- 48. Pietrantonio F, Vernieri C, Siravegna G, et al. Heterogeneity of acquired resistance to anti‐EGFR monoclonal antibodies in patients with metastatic colorectal cancer. Clin Cancer Res. 2017;23:2414‐2422. [DOI] [PubMed] [Google Scholar]
- 49. Loupakis F, Ruzzo A, Cremolini C, et al. KRAS codon 61, 146 and BRAF mutations predict resistance to cetuximab plus irinotecan in KRAS codon 12 and 13 wild‐type metastatic colorectal cancer. Br J Cancer. 2009;101:715‐721. [DOI] [PMC free article] [PubMed] [Google Scholar]
- 50. De Roock W, Claes B, Bernasconi D, et al. Effects of KRAS, BRAF, NRAS, and PIK3CA mutations on the efficacy of cetuximab plus chemotherapy in chemotherapy‐refractory metastatic colorectal cancer: a retrospective consortium analysis. Lancet Oncol. 2010;11:753‐762. [DOI] [PubMed] [Google Scholar]
- 51. Gandara DR, Paul SM, Kowanetz M, et al. Blood‐based tumor mutational burden as a predictor of clinical benefit in non‐small‐cell lung cancer patients treated with atezolizumab. Nat Med. 2018;24:1441‐1448. [DOI] [PubMed] [Google Scholar]
- 52. Normanno N, Tejpar S, Morgillo F, De Luca A, Van Cutsem E, Ciardiello F. Implications for KRAS status and EGFR‐targeted therapies in metastatic CRC. Nat Rev Clin Oncol. 2009;6:519‐527. [DOI] [PubMed] [Google Scholar]
- 53. Cancer Genome Atlas Network . Comprehensive molecular characterization of human colon and rectal cancer. Nature. 2012;487:330‐337. [DOI] [PMC free article] [PubMed] [Google Scholar]
- 54. Yaeger R, Chatila WK, Lipsyc MD, et al. Clinical sequencing defines the genomic landscape of metastatic colorectal cancer. Cancer Cell. 2018;33:125–36.e3. [DOI] [PMC free article] [PubMed] [Google Scholar]
- 55. Sjoblom T, Jones S, Wood LD, et al. The consensus coding sequences of human breast and colorectal cancers. Science (New York, NY). 2006;314:268–274. [DOI] [PubMed] [Google Scholar]
- 56. Vollbrecht C, Lehmann A, Lenze D, Hummel M. Validation and comparison of two NGS assays for the detection of EGFR T790M resistance mutation in liquid biopsies of NSCLC patients. Oncotarget. 2018;9:18529–18539. [DOI] [PMC free article] [PubMed] [Google Scholar]
Associated Data
This section collects any data citations, data availability statements, or supplementary materials included in this article.
Supplementary Materials