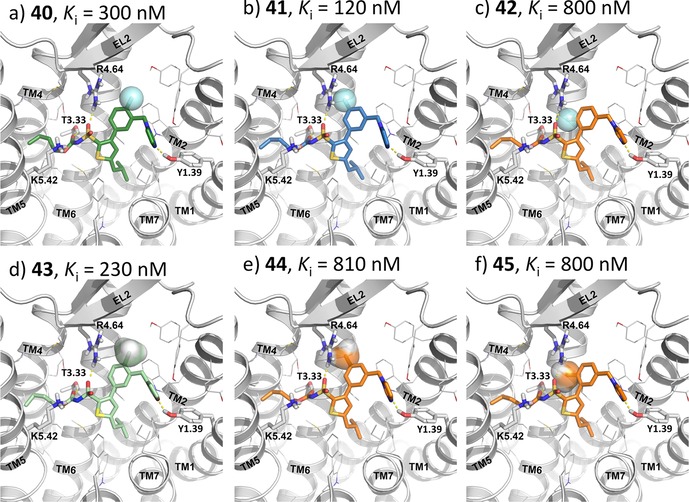
Figure 3.

The docked ligands (40–45) in the most common pose on the modeled conformation of the AT2R. The ligands are color coded based on the binding affinities, blue – high, green – moderate, and orange – low binding affinity. The N‐terminal, EL3 and parts of TM6‐TM7 of the AT2R are not shown for better clarity.
