Abstract
Background
Cardiac dark-blood turbo spin-echo (TSE) imaging is sensitive to through-plane motion, resulting in myocardial signal reduction.
Purpose
To propose and validate reverse double inversion-recovery (RDIR)—a dark-blood preparation with improved motion robustness for the cardiac dark-blood TSE sequence.
Study Type
Prospective.
Population
Healthy volunteers (n=10) and patients (n=20)
Field Strength
1.5T (healthy volunteers) and 3T (patients)
Assessment
Compared to double inversion recovery (DIR), RDIR swaps the two inversion pulses in time and places the slice-selective 180° in late-diastole of the previous cardiac cycle to minimize slice mis-registration. RDIR and DIR were performed in the same left-ventricular basal short-axis slice. Healthy subjects were imaged with two preparation slice-thicknesses, 110% and 200%, while patients were imaged using a 200% slice-thickness only. Images were assessed quantitatively, by measuring the myocardial signal heterogeneity and the extent of dropout, and also qualitatively on a 5-point scale.
Statistical Tests
Quantitative and qualitative data were assessed with Student’s t-test and Wilcoxon signed-rank test, respectively.
Results
In healthy subjects, RDIR with 110% slice-thickness significantly reduced signal heterogeneity in both the left ventricle (LV) and right ventricle (RV) (LV: p=0.006, RV: p<0.0001) and the extent of RV dropout (p<0.0001), while RDIR with 200% slice-thickness significantly reduced RV signal heterogeneity (p=0.001) and the extent of RV dropout (p=0.0002). In patients, RDIR significantly reduced RV myocardial signal heterogeneity (0.31 vs. 0.43; p=0.003) and the extent of RV dropout (24% vs. 46%; p=0.0005). LV signal heterogeneity exhibited a trend towards improvement with RDIR (0.12 vs. 0.16; p=0.06). Qualitative evaluation showed a significant improvement of LV and RV visualization in RDIR compared to DIR (LV: p= 0.04, RV: p=0.0007) and a significantly improved overall image quality (p=0.03).
Data Conclusion
RDIR TSE is less sensitive to through-plane motion, potentiating increased clinical utility for black-blood TSE.
Keywords: turbo spin-echo (TSE), dark blood imaging, motion artifacts, edema imaging, right ventricle, double inversion recovery
Introduction
Cardiac MRI dark-blood turbo spin-echo (TSE) sequence is commonly used in cardiovascular magnetic resonance (MR) imaging to identify edema and visualize anatomy in the left ventricular (LV) myocardium (1). The sequence provides a strong myocardium-to-blood contrast, high signal-to-noise ratio (SNR), and high spatial resolution. However, it is also well known that this sequence is very sensitive to motion and can provide inconsistent image quality and heterogeneous signal even in normal myocardium (2–4). The clinical reliability of dark-blood TSE is severely impaired by these technical limitations.
There are three known causes of signal heterogeneity in black blood TSE. One is the effects of coil-sensitivity. Another is the effects of motion on the TSE readout (5). Lastly, the effects of motion on the double inversion-recovery (DIR) preparation can be another major source of signal heterogeneity. T2 prepared balanced steady state free precession (bSSFP) T2 mapping is the currently used method to overcome these problems: it does so by not using the DIR preparation or the TSE readout. Furthermore, by performing T2-fitting, it eliminates heterogeneity due to coil variation. Therefore, in recent years, cardiac T2 mapping (6) has been increasingly used because it provides consistently good image quality. However, the resolution of the T2 mapping is often limited due to the use of single-shot imaging. The visualization quality of thin-walled chambers, such as the right ventricle (RV), is severely impaired in these techniques due to the partial volume effects.
Alternatively, there are some approaches that replace the DIR preparation or the TSE readout to reduce the motion sensitivity of the sequence. For example, some alternative blood-nulling mechanisms, such as motion-sensitizing magnetization preparation, are considered to be less sensitive to through-plane motion (7,8). Fast readouts based on Cartesian bSSFP (2) or radial bSSFP (3) have also been previously explored to replace the motion-sensitive TSE readout. In the latter approach, the DIR preparation was combined with radial bSSFP readout to improve the motion robustness with preserved blood nulling (3). This method has been shown to be quite successful in improving imaging efficiency and image quality consistency; however, the motion sensitivity of the DIR preparation was not addressed in the work.
Another direction towards improving T2 weighted dark-blood imaging is to improve, but not replace, the current standard DIR preparation and the TSE readout. This is addressed in routine clinical practice by increasing the thickness of the slice-selective re-inversion pulse, from 100% to 200% of the slice. An early study used motion tracking to study the motion of the heart and reduce the sensitivity of dark-blood TSE to such motion (9). Average cardiac displacements between early-systole and end-diastole were measured to be 2.0mm–2.9mm for the lateral, inferior, and septal left ventricular walls and 3.4mm–5.7mm for the RV in the basal slice of healthy volunteers. The motion causes spurious signal variations in the LV and signal dropout in the RV due to slice mis-registration. Motion tracking can be used to offset the position of the acquisition slice to match the DIR preparation slice. However, the technique needs a pre-estimation of the heart motion for best performance, which increases the complexity of the method. In another report, carefully aligning the TSE readout with the RV quiescent period was shown to generate the largest improvement of image quality in the RV over other methods, such as increasing DIR preparation thickness (10).
Dark-blood TSE has been advocated as part of the MR assessment for the right ventricle, e.g. to evaluate arrhythmogenic right ventricular cardiomyopathy (ARVC) (11). The sequence can be used to provide a morphological evaluation of the RV as well as an assessment of RV fat infiltration, which is a pathological finding but not yet a reliable imaging feature of ARVC (12,13). The sequence provides a unique advantage in reducing the partial volume effects between myocardium and blood, which is critical for tissue characterization of all thin-walled chambers. However, there are a variety of challenges for RV dark-blood imaging, including a thinner wall, higher mobility, a shorter quiescent period, and slower blood flow (10). As a result, parts of the RV wall are consistently missing in dark-blood TSE and accurate characterization of the RV wall is difficult (14). Furthermore, techniques such as T2 mapping (6) are unsuitable for the RV, because of low resolution and severe partial volume effects. Hence, improving the motion robustness of dark-blood TSE would be highly beneficial for diagnosis of ARVC.
The aim of this work was to investigate a new DIR preparation paradigm that is more motion-robust than the existing DIR preparation. The new DIR preparation, named reverse double inversion recovery (RDIR), reverses the order of the two inversion pulses in the pulse sequence. Furthermore, the slice-selective IR, whose timing relative to TSE readout excitation pulse is critical in considering the motion robustness, is moved to late-diastole to match the timing of the TSE readout. We hypothesized that the proposed technique can improve visualization of the LV and RV in dark-blood images. To test the hypothesis, the proposed sequence was compared to the standard DIR TSE sequence in 10 healthy volunteers and 20 patients at our clinical center.
Materials and Methods
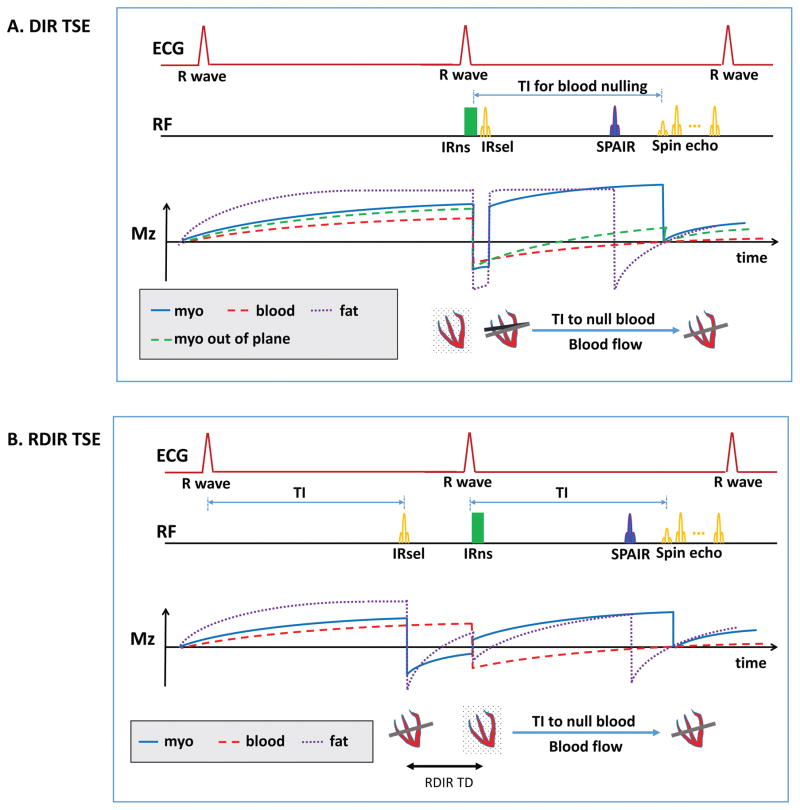
We implemented an RDIR fat-saturated dark-blood T2-weighted TSE sequence modified from the standard DIR TSE sequence. Figure 1 shows the difference between the two sequences and their corresponding longitudinal magnetization in the presence of through-plane motion. In DIR TSE, the slice-selective IR (IRsel) is performed after the nonselective IR (IRns), both in early-systole, while the TSE readout lies in the late-diastole. In standard DIR (Figure 1A), the timing difference between IRsel and the RF excitation leading the TSE readout increases the risk of slice mis-registration between the RF pulses. This mis-registration nulls part of the myocardium in which spins did not experience the slice-selective re-inversion (Figure 1A). In contrast, the RDIR preparation reverses the order of the two inversion pulses, performing IRsel in the prior cardiac cycle. As a result, IRsel and the 90° pulse of the TSE readout are performed at exactly the same cardiac phase. The timing mismatch is eliminated and the risk of slice mis-registration is minimized (Figure 1B). Blood nulling only depends on the position of IRns. Since IRns is not timed differently in RDIR, blood nulling of the inflowing blood should be the same between RDIR and DIR. The acquisition time of RDIR TSE is not increased since DIR T2-weighted TSE acquires data in every second RR cycle.
Figure 1.
(A) The schematic of the standard DIR TSE sequence and the resulting magnetization of in-plane myocardium, out-of-plane myocardium, blood, and fat. IRsel is performed immediately after IRns, both in early-systole. The TSE readout is in late-diastole. Due to the timing difference, part of the myocardium excited in the TSE readout is not inverted by IRsel. As a result, the spins (green dash line) are inverted only once and have a very low magnetization during the TSE readout. (B) The schematic of the RDIR TSE sequence and the resulting magnetization of myocardium and blood. IRsel is moved forward to the previous cardiac cycle, performed at exactly the same trigger time as the TSE excitation pulse. Thus, slice mis-registration is minimized. The delay (TD) between the two inversion pulses causes a signal loss for the myocardium.
The delay time (TD, Figure 1B) between the two inversion pulses in the RDIR preparation causes some signal loss for in-plane tissues, such as myocardium. Different from DIR, the spins in these tissues are not immediately inverted back after the first inversion. Instead, a delay time is inserted between the two inversion pulses, allowing the spins to recover before they are re-inverted. The longitudinal magnetization recovered during TD is the signal lost by using RDIR. The signal loss can be analytically derived, based on the Bloch equations, given an RR interval, TD, and the tissue T1, and assuming 90° flip angle is used in the TSE readout. In DIR TSE, the longitudinal signal of myocardium immediately before the 90° pulse is
| (1) |
The same signal in RDIR TSE is
| (2) |
Therefore, the lost myocardial signal, i.e. MzDIR − MzRDIR, is
| (3) |
Equation 3 shows that the loss of signal increases as TD increases and drops as the RR interval increases. In practice, TD varies between 100ms to 500ms, depending on the patient’s heart rate.
In this work, we used spectral attenuated inversion-recovery (SPAIR) for fat saturation (15), due to its high SNR, robustness against B1 inhomogeneity, and popularity in clinical practice. SPAIR uses a spectrally selective adiabatic inversion pulse to invert fat spins, and rests for a time of TI to null the fat signal (Figure 1). When RDIR instead of DIR is used, the calculation of SPAIR TI should be adjusted, due to the signal loss during the RDIR delay. The optimal SPAIR fat saturation TI in the standard DIR TSE can be calculated by
| (4) |
based on Bloch equations. The coefficient a is a vendor-specific parameter used in SPAIR TI calculation. When RDIR TSE is used, the optimal SPAIR fat saturation TI is
| (5) |
When TD = 0, Equation 5 returns to Equation 4; otherwise, TIFS,RDIR is generally less than TIFS,DIR. Both equations were derived based on Bloch equation modeling of the sequence.
Simulations
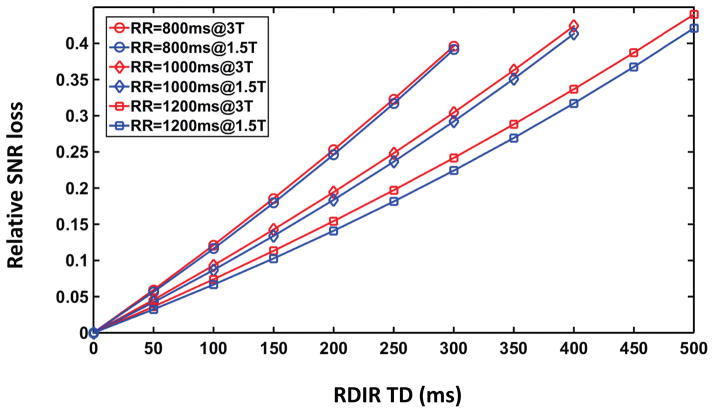
Simulations were performed to investigate the loss of SNR in RDIR, based on the Bloch equations and Equation 3. The relative SNR loss, defined by (myocardial Mz of DIR – myocardial Mz of RDIR)/(myocardial Mz of DIR), was calculated for RR intervals = 800ms/1000ms/1200ms and myocardial T1 = 900ms(1.5 Tesla)/1200ms (3 Tesla). Here Mz represents the longitudinal signal immediately before the 90° pulse in the beginning of the TSE readout. The RDIR TD was varied from 0 to 300ms for an RR interval of 800ms, 0 to 400ms for an RR interval of 1000ms, and 0 to 500ms for an RR interval of 1200ms.
Healthy subject study
All in vivo studies, including healthy volunteers and patients, were approved by the institutional review board (IRB), and all study participants provided informed written consent.
Ten healthy volunteers (4 male, age 31±8) were imaged with both DIR TSE and RDIR TSE on a 3.0T scanner (Siemens Trio, Erlangen, Germany). A 6-channel phased-array body coil and a 24-channel spine matrix coil, of which up to 12 channels can be turned on simultaneously, were used for the imaging. The RR intervals of the 10 volunteers ranged from 780ms to 1100ms, where average RR interval ± 1SD equals 950ms ± 108ms. A 4-chamber view GRE cine sequence was prescribed after the localizers to measure the quiescent period of the RV. The acquisition window was timed to fit the quiescent period, resulting in an average trigger time of 716ms ± 56ms, and an average TD of 331ms ± 65ms for the RDIR preparation. Imaging parameters were: FOV: 360–400mm × 275–300mm, image size: 192 × 114, slice-thickness: 5mm, bandwidth: 789 Hz/Pixel, echo train length (ETL): 19, echo spacing: 4.9ms, acquisition window: 96ms, TE: 49ms, flip angle: 90°, parallel imaging off, 2 dummy heartbeats, scan time: 14 heartbeats, fat saturation with SPAIR. For RDIR TSE, TI of SPAIR was calculated based on Equation 5 with user-input RR duration for each subject. Imaging was prescribed in basal ventricular short-axis slice due to its high mobility (9). For DIR and RDIR preparations, two IRsel slice-thickness, 110% and 200%, were investigated. On our scanner, 110% is the minimal DIR slice-thickness and 200% is the clinical standard for dark-blood TSE imaging. A 110% slice-thickness for IRsel was employed to demonstrate the capability of RDIR to reduce motion artifacts due to slice mis-registration.
Patient study
Twenty patients (11 male, age 55±12 years old) who were consecutively scheduled for cardiac MR at our clinical center were recruited for this study after providing informed written consent. The patients were scanned on a 1.5T clinical scanner (Siemens Avanto, Erlangen, Germany) with the same 24-channel spine matrix coil used in the healthy volunteers and an 18-channel phased-array body coil. The mean intrascan RR intervals of the patients ranged from 630ms to 1240ms, with an average RR interval ± 1SD of 877ms ± 153ms over all patients. The acquisition window was chosen automatically based on the ECG signal, resulting in an average trigger time of 692ms ± 66ms. The TD of the RDIR TSE sequence ranged from 130ms to 510ms, with the average TD ± 1SD = 256ms ± 102ms. The 20 patients had a variety of clinical indications, including inspection of various ischemic and non-ischemic cardiomyopathies, arrhythmia, aortic stenosis, and heart failure. None of the 20 patients was subsequently confirmed from the imaging to have had edema. The DIR TSE sequence was performed in all clinically required views, including a 4-chamber long axis view and 3 slices in the short axis view, covering base, middle, and apex of both ventricles. Only the basal short axis image was used for the subsequent analysis. RDIR TSE was performed in the same basal short axis slice with identical scan parameters. Imaging parameters were: FOV: 400mm × 350mm, image size: 256 × 172, slice-thickness: 6mm, bandwidth: 781 Hz/Pixel, echo train length (ETL): 17, echo spacing: 4.4ms, acquisition window: 75ms, TE: 65ms, flip angle: 90°, 2-fold parallel imaging (GRAPPA), scan time: 12 heartbeats, 200% preparation slice-thickness for both DIR and RDIR, fat saturation with SPAIR. For sake of simplicity, the average RR interval for RDIR SPAIR TI calculation was fixed at 1000ms within the pulse sequence, making the calculated fat-saturation TI an approximation of the true TI. During the scan, if severe artifacts were present in the DIR TSE or the RDIR TSE image, the scan was repeated once for the problematic sequence to rule out any random effects. If the image quality was subsequently improved, it was used in our analysis.
Quality assessment
Quantitative assessment
Several quantitative indexes were evaluated in both volunteers and patients, including myocardial SNR, myocardium-to-blood contrast-to-noise ratio (CNR), quantification of signal heterogeneity in LV and RV myocardium, and extent of RV dropout. The degree of signal heterogeneity within the LV and RV wall was investigated as a criterion to show whether RDIR reduces signal heterogeneity due to through-plane motion. For the LV, a ring-shaped custom ROI was firstly drawn including the entire myocardium, using in-house MATLAB-based software. The ROI was then circumferentially segmented into 20 sectors, each covering 18° of a rotating angle relative to the ROI’s centroid. The first sector was always located at the anterior insertion point of the RV. The rotation of the sectors followed a counterclockwise orientation, traversing through the septum first and the lateral wall last. The signal intensity in each sector was averaged, giving a regional representation of the LV wall signal. For the RV, since the wall is very thin, a contour with user-defined control points was drawn within the lateral wall of the RV to extract the wall signal. The contour always started at the anterior insertion point and ended at the posterior insertion point. Signal along the contour was interpolated using b-splines from the surrounding grids. The control points were then re-interpolated using b-splines onto 100 points uniformly spaced along the contour.
The signal of the sectors or contour was firstly smoothed using LOWESS (Locally Weighted Scatterplot Smoothing) to remove small fluctuations, potentially due to noise, contouring error, and interpolation error. From the smoothed signal, the degree of heterogeneity in the LV and RV was quantified as the ratio of the standard deviation of the signal in each sector to the mean of the signal.
For the RV, in addition to heterogeneity, we also measured the “extent of dropout”, which is a major factor that renders the dark-blood TSE non-diagnostic for RV evaluation (10). The extent of dropout reflects the length of the RV lateral wall that is not evaluable by a clinician. Here, RV dropout is defined as the signal lower than 50% of the maximal RV signal, in analogy to the full-width-at-half-maximum (FWHM) method for LGE (16). The extent of RV dropout was found by calculating the percentage of the dropout relative to the total length of the RV.
SNR was calculated based on the average signal of the entire LV wall relative to the standard deviation of the blood pool, which was carefully delineated to exclude the area of bright blood due to slow flow, and tissues, such as the papillary muscle. Myocardium-to-blood CNR was calculated by (average signal of the LV wall - average signal of blood pool)/standard deviation of blood pool.
Qualitative assessment
The patient images were also blindly and independently evaluated by two radiologists (XX and XX), both with more than 5 years of experience in assessing cardiovascular MR imaging. The evaluation used the 5-point Likert scale (1: non-diagnostic; 2: poor; 3: fair; 4: good; 5: excellent) for 6 criteria: overall image quality, LV signal homogeneity, RV visualization, fat suppression, perceptual SNR, and blood nulling. The results from the two radiologists were averaged prior to the comparison.
Statistical analysis
Statistical analysis was performed with MATLAB (2014b, MathWorks, Natick, MA) and Excel (Microsoft, Seattle, WA). For quantitatively measured values, such as LV and RV signal heterogeneity, extent of RV dropout, measured SNR, and measured CNR, two-tailed paired Student’s t-test was used to find the significance of difference between two samples. For qualitative assessment using the 5-point scale, Wilcoxon signed-rank test was employed. The significance of the difference between the two methods in the number of excellent/good scores versus number of fair/poor/non-diagnostic scores over the 20 patients was assessed using Fisher’s exact test. A p-value less than 0.05 was considered significant.
Results
Simulations
Figure 2 shows the relative SNR loss of the RDIR sequence. At RDIR delay = 0, no SNR loss occurs. As RDIR delay increases, the relative SNR loss also increases. At the maximal RDIR TD (300ms/400ms/500ms for an RR interval of 800ms/1000ms/1200ms, respectively), the SNR loss is roughly between 0.39 to 0.45, for both 1.5T and 3T conditions. The SNR loss is not strongly dependent on heart rate or field strength.
Figure 2.
Simulations show that the SNR loss of RDIR relative to DIR increases almost linearly with RDIR TD. The simulation used a myocardial T1 of 1200ms at 3T and 900ms at 1.5T. Three RR values (800ms, 1000ms, and 1200ms) were used corresponding to three maximal TD values (300ms, 400ms, and 500ms). The maximal relative SNR loss of RDIR in all cases is between 0.39 and 0.44.
Volunteer study
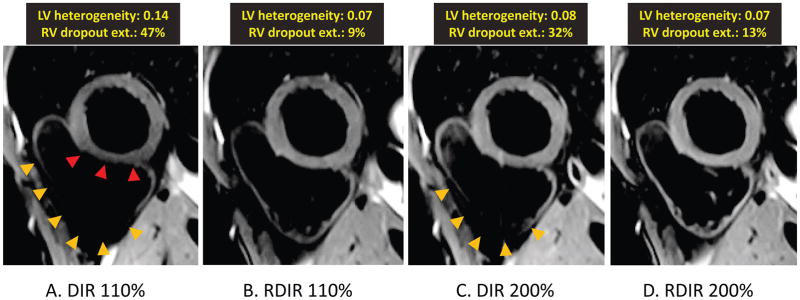
Figure 3 shows examples of the four images from a single volunteer. The DIR 110% (DIR TSE sequence with slice-selective re-inversion thickness of 110% of the acquisition slice-thickness) image shows extensive dropout in the RV and heterogeneous signal in the LV. These artifacts are considerably reduced in the RDIR 110% image. DIR 200% (DIR TSE sequence with the slice-selective re-inversion thickness of 200% of the acquisition slice-thickness, i.e. the clinical standard) also reduces most of the artifacts; however, the dropout in the RV in DIR 200% is still large compared to RDIR 110% and 200% images.
Figure 3.
Representative examples of the four images of a single healthy volunteer. (A)-(D) show images obtained from DIR 110%, RDIR 110%, DIR 200%, and RDIR 200%, respectively. The measured LV signal heterogeneity and RV dropout extent are highlighted at the top of each image. There is a strong RV dropout and LV signal variation in DIR 110% (A), pointed by the orange and red arrow heads, respectively. RDIR 110% (B) considerably improves image quality, with a visible RV, although some global signal loss in the RV is present. DIR 200% (C) still has a large signal dropout in the RV (arrow heads), which is completely eliminated in RDIR 200% (D).
Table 1 shows the quantitative evaluation of the four sequences (DIR 110%, RDIR 110%, DIR 200%, and RDIR 200%) in the 10 healthy volunteers. For the LV, RDIR 110% significantly reduces the degree of heterogeneity compared to DIR 110%, indicating that RDIR is able to reduce motion-related artifacts in the LV. At 200% preparation slice-thickness, RDIR still reduces heterogeneity in the LV, although non-significantly. This implies that much of the motion-induced artifacts are resolved by doubling the preparation slice-thickness for the LV. For the RV, RDIR improves visibility. RDIR 110% and 200% both lead to significantly reduced signal heterogeneity (0.37±0.12 vs 0.60±0.14, P<0.0001; 0.33±0.10 vs 0.49±0.17, P=0.001) compared to DIR 110% and DIR 200%, respectively. The extent of RV dropout is also significantly reduced in RDIR 110% and 200% compared to DIR 110% and 200% (33%±18% vs 57%±14%, P<0.0001; 28%±15% vs 44%±14%, P=0.0002), respectively. RDIR TSE reduces a considerable amount of dropout and heterogeneity in the RV, although some residual dropouts and heterogeneity still exist.
Table 1.
Quantitative evaluation of DIR 110%, RDIR 110%, DIR 200%, and RDIR 200% in 10 healthy volunteers
| DIR 110% | RDIR 110% | P value | DIR 200% | RDIR 200% | P value | |
|---|---|---|---|---|---|---|
| LV heterogeneity | 0.15±0.05 | 0.08±0.03 | 0.006 | 0.11±0.04 | 0.09±0.05 | 0.38 |
| RV heterogeneity | 0.60±0.14 | 0.37±0.12 | <0.0001 | 0.49±0.17 | 0.33±0.10 | 0.001 |
| RV extent of dropout | 57%±14% | 33%±18% | <0.0001 | 44%±14% | 28%±15% | 0.0002 |
| SNR | 65±46 | 56±24 | 0.28 | 91±43 | 71±29 | 0.004 |
| CNR | 61±44 | 52±24 | 0.26 | 86±41 | 68±28 | 0.004 |
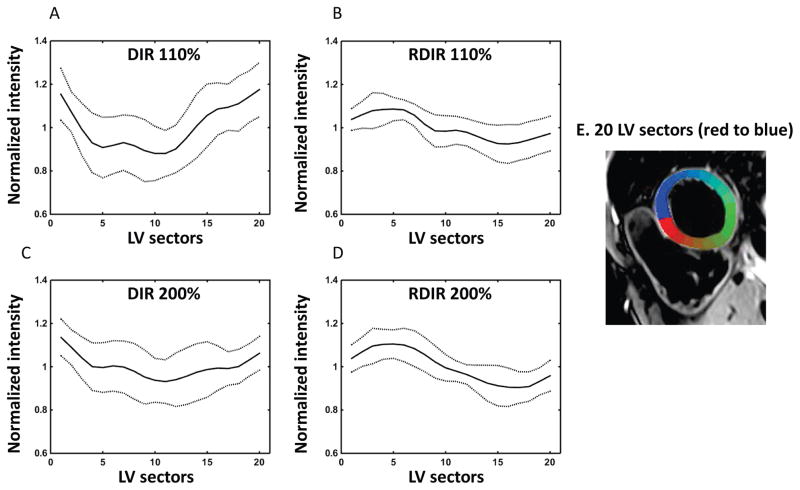
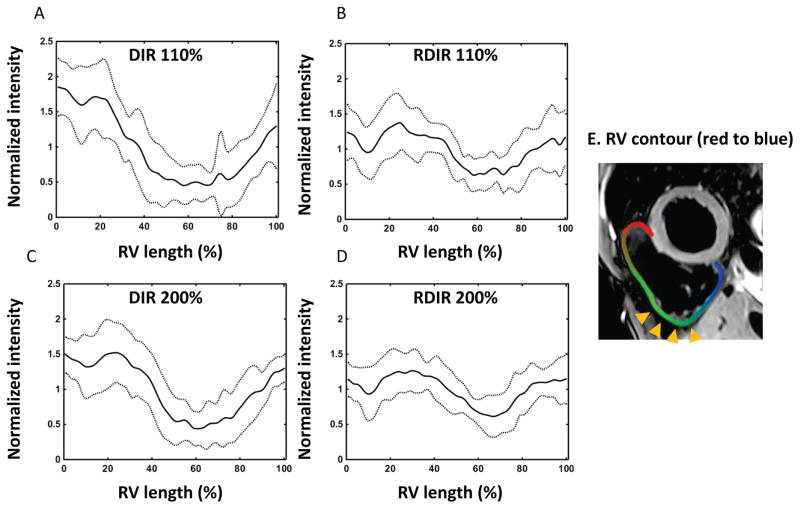
Figure 4 and 5 show the normalized signal profiles of the LV and RV from the four sequences, obtained by averaging the normalized signal profile of the LV and RV over the 10 volunteers. The normalization refers to the division of the smoothed signal profile by its mean value over the LV sectors or the RV contour. For the LV, the profile starts at the first sector, which lies at the anterior RV insertion point, and traverses through the septum and then finally the LV free wall (sectors are shown in Figure 4E). The position of the second insertion point lies in a range of Sectors 6–8. For both DIR TSE sequences, there is a strong LV signal reduction in Sectors 5–12, although the variation is damped in DIR 200%. The variation of signal in RDIR TSE is less than its counterpart in DIR TSE. Moreover, the dip in sectors 5–12 is not found in RDIR TSE, which may indicate that the motion pattern in the DIR TSE images is completely eliminated in the RDIR TSE images. For the RV, the signal dropout mainly resides in the inferior lateral wall. Although RDIR does not completely eliminate the presence of dropout, it substantially reduces the strength and extent of the dropout in the RV. In contrast, 200% DIR is ineffective in reducing the RV dropout.
Figure 4.
Plot of the intensity profile of LV along the 20 sectors (E) for DIR 110% (A), RDIR 110% (B), DIR 200% (C), and RDIR 200% (D), respectively, averaged over 10 healthy volunteers. The solid line shows the mean signal and the dot line shows the deviated signal at ±1SD. Sector 1 is located at the anterior insertion point of the RV, and the posterior insertion point is located between Sectors 6–8. The 20 LV sectors are color-coded and shown in (E), with the first and last sectors in red and blue, respectively.
Figure 5.
Plot of the intensity profile of the RV along the RV contour (E) for DIR 110% (A), RDIR 110% (B), DIR 200% (C), and RDIR 200% (D), respectively, averaged over 10 healthy volunteers. The solid line shows the mean signal and the dot line shows the deviated signal at ±1SD. The profile starts at the anterior insertion point of the RV and ends at the posterior insertion point (E). Dropout is typically located within the inferior lateral wall of the RV (arrow heads).
The average SPAIR fat saturation TI in the DIR TSE sequence was 153ms ± 1ms (1SD) and the counterpart in the RDIR TSE sequence was 135ms ± 3ms. The SNR and CNR of RDIR 110% are not significantly less than those of DIR 110%. This observation suggests that the motion artifacts in DIR 110% causes an overall reduction of SNR and CNR. At 200% preparation slice-thickness, SNR and CNR of RDIR are significantly reduced by about 20%, consistent with the theoretical anticipation.
Patient study
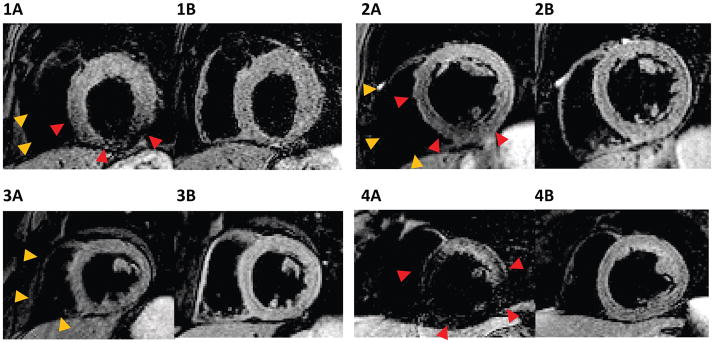
Figure 6 shows some representative DIR TSE and RDIR TSE images of four patients. The DIR images are contaminated by strong LV heterogeneity or dropout (1A, 2A, 4A) and signal dropout in the RV (1A, 2A, 3A, 4A); these artifacts are considerably reduced in their RDIR counterparts. Notably, the RV is much better depicted in several RDIR images.
Figure 6.
Examples of DIR (1A, 2A, 3A, 4A) and RDIR (1B, 2B, 3B, 4B) images with 200% preparation slice-thickness in four patients. Orange and red arrow heads point out the dropout and signal loss of the DIR sequence in the RV and the LV, respectively.
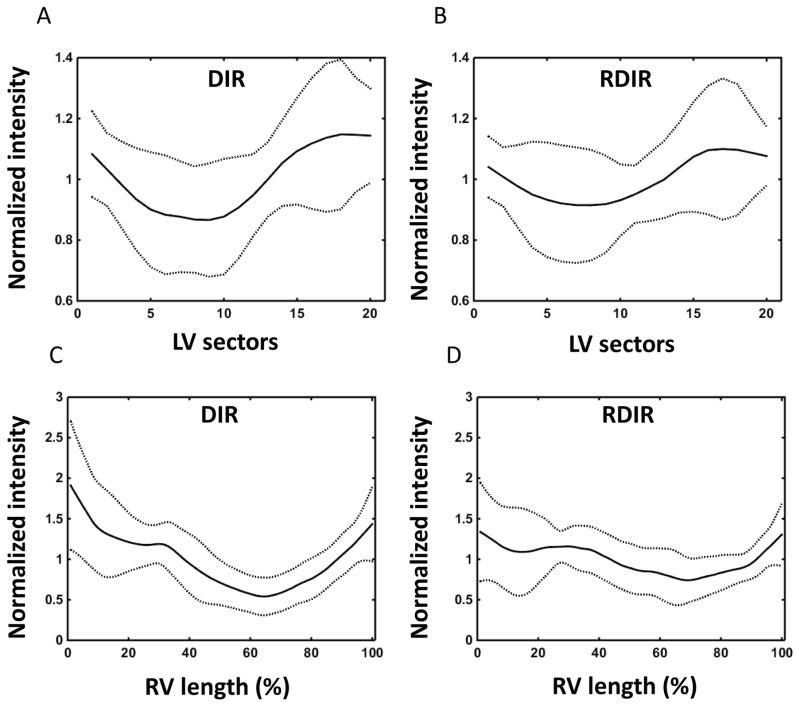
Table 2 shows the quantitative comparison of DIR and RDIR TSE over the 20 patients. DIR has significantly higher SNR (17±5 vs 14±3, P=0.007) and CNR (14±5 vs 11±3, P=0.009) compared to RDIR. Note that the reduction of SNR in patients compared to healthy volunteers is due to the use of lower magnetic field, a longer TE, and parallel imaging. For the LV, a trend towards a significant reduction of signal heterogeneity is found in RDIR TSE (0.12±0.13 vs 0.16±0.13, P=0.06). The average normalized signal profile of the LV over 20 patients showed a damped signal variation in RDIR TSE (Figure 7A–B). For the RV, RDIR significantly reduces the signal heterogeneity compared to DIR (0.31±0.21 vs 0.43±0.24, P=0.003) and highly significantly reduces the extent of dropout (24%±26% vs 46%±29%, P=0.0005). Figure 7C–D shows the average of normalized RV signal profile from the two sequences. RDIR TSE substantially reduces the amount of signal variation in DIR TSE.
Table 2.
Quantitative evaluation of DIR TSE and RDIR TSE in 20 patients
| DIR TSE (200%) | RDIR TSE (200%) | P value | |
|---|---|---|---|
| LV heterogeneity | 0.16±0.13 | 0.12±0.13 | 0.06 |
| RV heterogeneity | 0.43±0.24 | 0.31±0.21 | 0.003 |
| RV extent of dropout | 46%±29% | 24%±26% | 0.0005 |
| SNR | 17±5 | 14±3 | 0.007 |
| CNR | 14±5 | 11±3 | 0.009 |
Figure 7.
Plots show the intensity profile of the LV along the 20 sectors for DIR (A) and RDIR (B) with 200% preparation slice-thickness, respectively, averaged over 20 patients. Plots show the intensity profile of the RV along the RV contour for DIR (C) and RDIR (D) with 200% preparation slice-thickness, respectively, averaged over the 20 patients. The solid line shows the mean signal and the dot line shows the deviated signal at ±1SD.
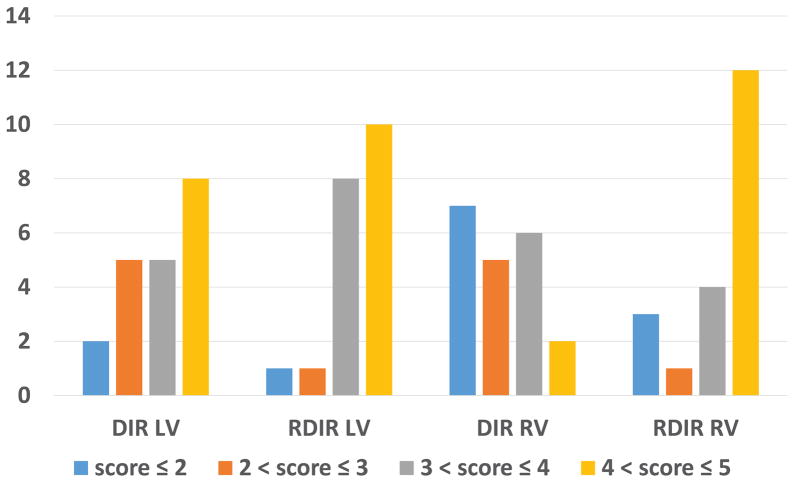
Table 3 shows the result of the 5-point scoring of the two methods. RDIR significantly improved overall image quality, LV signal homogeneity, and RV visibility (3.85±0.82 vs 3.35±1.00, P=0.03; 4.23±0.84 vs 3.70±1.09, P=0.04; 4.00±1.13 vs 3.03±1.05, P=0.0007). The perceptual SNR, blood nulling, and fat saturation were similar. The SPAIR TI ± 1SD used in the DIR TSE and RDIR TSE sequences was 153ms ± 1ms and 129ms ± 8ms, respectively. Figure 8 shows the distribution of the LV homogeneity score and the RV visualization score among the 20 patients from both sequences. For the LV, DIR led to 13 patients with a score higher than 3 while RDIR led to 18 patients of such quality (P=0.13, Fisher’s exact test). For the RV, while DIR had only 8 patients with a score higher than 3, RDIR led to 16 such patients (P=0.02). These results showed that RDIR led to a significant improvement in the proportion of images with good-to-excellent image quality in the RV and a trend towards such improvement in the LV.
Table 3.
Qualitative evaluation of DIR TSE and RDIR TSE in 20 patients, on a scale of 1–5 (best).
| Overall Quality | LV homogeneity | RV visibility | Perceptual SNR | Blood Nulling | Fat Saturation | |
|---|---|---|---|---|---|---|
| DIR | 3.35±1.00 | 3.70±1.09 | 3.03±1.05 | 3.85±0.90 | 4.60±0.50 | 3.85±0.84 |
| RDIR | 3.85±0.82 | 4.23±0.84 | 4.00±1.13 | 4.05±0.71 | 4.80±0.29 | 4.00±0.89 |
| P value | 0.03 | 0.04 | 0.0007 | 0.33 | 0.18 | 0.28 |
Figure 8.
Distribution of LV and RV scores (1–5 (best)) for the 20 patients with DIR and RDIR TSE using 200% preparation slice-thickness. RDIR results in a significant improvement in the proportion of images with good-to-excellent image quality in the RV (p=0.02) and a trend towards such improvement in the LV (p=0.13).
Discussion
In this work, the standard DIR preparation was modified to improve its robustness to through-plane motion and the improvement was demonstrated in healthy volunteers and patients. The study showed that the RDIR preparation results in several improvements of the dark-blood TSE sequence. The most prominent improvement was observed in the RV, including RV signal homogeneity in both volunteers and patients, RV extent of dropout in both volunteers and patients, qualitative evaluation of RV visualization quality, and the proportion of patients with good-to-excellent RV qualities. RDIR also seems to improve the image quality of the LV, although not always significantly. Nevertheless, the qualitative evaluation of the LV in the patients suggested a significant improvement in the LV signal homogeneity by using RDIR. Lastly, the overall image quality of the patient data was significantly improved with RDIR. Based on these results, RDIR may be a valuable approach to improve the clinical evaluation of RV edema, RV morphology, and LV edema. Furthermore, the technique may be used to improve the reliability in identification of RV fat infiltration in ARVC patients.
Although we observed improved quality with RDIR in the LV, the improvement was less dramatic than in the RV. This can be understood since the RV generally has greater through-plane motion compared with the LV (8). Furthermore, the comparison of DIR 200% with DIR 110% shows that the increased slice-thickness indeed removes most of the artifacts in the LV that are present in DIR 110%. Thus, while RDIR is able to significantly improve RV visualization, the improvement of the LV assessment is less dramatic.
The difference of heterogeneity between the standard TSE and RDIR TSE reflects the reduction of motion artifacts due to minimization of slice mis-registration. Other causes of signal heterogeneity, such as motion during the TSE readout and coil profiles, contribute to the residual heterogeneity of signal in the RDIR TSE images. Coil sensitivity is a recognized source of signal variation in dark-blood imaging (2). Additionally, motion during the TSE readout may also severely impair the image quality (3,10). To understand whether motion during the TSE readout is the main cause of residual heterogeneity, we performed an extra T1-weighted RDIR in the last 10 patients. The T1-weighted RDIR had the same parameters as the T2-weighted RDIR except a TE=4.9ms. A short TE reduces the risk of motion occurring between the 90° RF pulse and the collection of central k-space, and therefore reduces the motion artifacts. Using this sequence, we found one patient who had a visible LV dropout that appeared in both DIR and T2-weighted RDIR images but not in the T1-weighted RDIR image. This observation suggests that the dropout in the T2-weighted RDIR was caused by the TSE readout in this patient. There was no significant difference between T2-weighted and T1-weighted RDIR in the 10 patients. A more thorough study is necessary to understand the effects of motion artifacts caused by the TSE readout. Prior investigation (3) has suggested that a radial bSSFP readout can considerably reduce the sensitivity of the dark-blood sequence to motion. The technique can be combined with RDIR preparation to reduce both motion artifacts from the TSE readout and the dark-blood preparation.
A main limitation of RDIR TSE is its sensitivity to arrhythmias. A basic assumption underlying RDIR is that the pattern of cardiac motion within a cardiac cycle remains approximately unchanged throughout the sequence execution. Arrhythmias, by their nature, can violate the assumption by causing interbeat changes of cardiac motion patterns. As a result, residual slice mismatching may be present even with RDIR, causing myocardial signal reduction in the image. Furthermore, RDIR is more sensitive to arrhythmias compared to DIR. DIR TSE and RDIR TSE have the same sensitivity to arrhythmias or missed triggers that occur after the TSE readout. However, an arrhythmia occurring across the RDIR preparation will change TD, resulting in an additional signal change of myocardium for RDIR. More seriously, arrhythmias during the RDIR preparation may lead to missed triggers, which may considerably reduce the myocardial signal and moderately elevate the blood signal. Together, these factors will cause loss of contrast, loss of SNR, and ghosting artifacts, which are more severe with RDIR. Based on these limitations, RDIR TSE in its current implementation is not suitable for patients who have significant arrhythmias.
Several other limitations are also associated with RDIR. Firstly, since RDIR requires two heartbeats in its current implementation, it is less efficient than DIR for sequences that acquire data in every heartbeat, such as those using bSSFP readout (3). Secondly, RDIR reduces SNR, about 20% on average, compared to standard DIR. In practice, this may not be problematic, due to the relatively high baseline SNR and blood-to-myocardium CNR in black-blood TSE. Lastly, an accurate fat saturation for RDIR TSE calls for an estimate of average RR duration of the patient. This information can be automatically collected by the sequence or manually input by the operator, which however would increase the procedural complexity. The study also has several limitations. The study did not explore axial imaging, which is a common view for evaluation of the RV free wall and RV outflow tract (11). The through-plane motion of the RV in the axial view is reported to be less problematic (10). In addition, our study did not explore the use of short-inversion-time inversion-recovery (STIR) for fat saturation (1). The major advantage of STIR is its robustness against B0 inhomogeneity; however, it leads to a lower SNR and higher sensitivity to motion compared to SPAIR (9). There is no difference in terms of sequence design to combine RDIR with STIR. Combination of the two techniques is feasible and is warranted with future exploration.
In conclusion, we propose a novel RDIR TSE sequence with superior robustness to cardiac motion compared to the standard dark-blood TSE sequence. The new sequence leverages a simple adjustment of timing of the two inversion pulses to minimize the risk of slice mis-registration. We have demonstrated that the RV quality in dark-blood imaging is significantly improved by using this technique. There is also an improvement of the LV image quality with RDIR, although not always significant. Further studies are warranted to evaluate this new T2-weighted dark-blood TSE sequence in a variety of applications, including edema imaging, and tissue characterization of the RV.
Acknowledgments
Grant Support: This work was partially supported by grants from the NIH R01HL122560
References
- 1.Simonetti OP, Finn JP, White RD, Laub G, Henry DA. “Black blood” T2-weighted inversion-recovery MR imaging of the heart. Radiology. 1996;199(1):49–57. doi: 10.1148/radiology.199.1.8633172. [DOI] [PubMed] [Google Scholar]
- 2.Kellman P, Aletras AH, Mancini C, McVeigh ER, Arai AE. T2-prepared SSFP improves diagnostic confidence in edema imaging in acute myocardial infarction compared to turbo spin echo. Magn Reson Med. 2007;57(5):891–897. doi: 10.1002/mrm.21215. [DOI] [PMC free article] [PubMed] [Google Scholar]
- 3.Edelman RR, Botelho M, Pursnani A, Giri S, Koktzoglou I. Improved dark blood imaging of the heart using radial balanced steady-state free precession. J Cardiovasc Magn Reson. 2016;18(1):69. doi: 10.1186/s12968-016-0293-7. [DOI] [PMC free article] [PubMed] [Google Scholar]
- 4.Wince WB, Kim RJ. Molecular imaging: T2-weighted CMR of the area at risk—a risky business? Nature Reviews Cardiology. 2010;7(10):547–549. doi: 10.1038/nrcardio.2010.124. [DOI] [PubMed] [Google Scholar]
- 5.Ferreira PF, Gatehouse PD, Mohiaddin RH, Firmin DN. Cardiovascular magnetic resonance artefacts. J Cardiovasc Magn Reson. 2013;15:41. doi: 10.1186/1532-429X-15-41. [DOI] [PMC free article] [PubMed] [Google Scholar]
- 6.Giri S, Chung YC, Merchant A, et al. T2 quantification for improved detection of myocardial edema. J Cardiovasc Magn Reson. 2009;11:56. doi: 10.1186/1532-429X-11-56. [DOI] [PMC free article] [PubMed] [Google Scholar]
- 7.Nguyen TD, de Rochefort L, Spincemaille P, et al. Effective motion-sensitizing magnetization preparation for black blood magnetic resonance imaging of the heart. J Magn Reson Imaging. 2008;28(5):1092–1100. doi: 10.1002/jmri.21568. [DOI] [PMC free article] [PubMed] [Google Scholar]
- 8.Srinivasan S, Hu P, Kissinger KV, et al. Free-breathing 3D whole-heart black-blood imaging with motion sensitized driven equilibrium. J Magn Reson Imaging. 2012;36(2):379–386. doi: 10.1002/jmri.23662. [DOI] [PMC free article] [PubMed] [Google Scholar]
- 9.Keegan J, Gatehouse PD, Prasad SK, Firmin DN. Improved turbo spin-echo imaging of the heart with motion-tracking. J Magn Reson Imaging. 2006;24(3):563–570. doi: 10.1002/jmri.20655. [DOI] [PubMed] [Google Scholar]
- 10.Berkowitz SJ, Macedo R, Malayeri AA, et al. Axial black blood turbo spin echo imaging of the right ventricle. Magn Reson Med. 2009;61(2):307–314. doi: 10.1002/mrm.21864. [DOI] [PMC free article] [PubMed] [Google Scholar]
- 11.te Riele AS, Tandri H, Bluemke DA. Arrhythmogenic right ventricular cardiomyopathy (ARVC): cardiovascular magnetic resonance update. J Cardiovasc Magn Reson. 2014;16:50. doi: 10.1186/s12968-014-0050-8. [DOI] [PMC free article] [PubMed] [Google Scholar]
- 12.Castillo E, Tandri H, Rodriguez ER, et al. Arrhythmogenic right ventricular dysplasia: ex vivo and in vivo fat detection with black-blood MR imaging. Radiology. 2004;232(1):38–48. doi: 10.1148/radiol.2321030688. [DOI] [PubMed] [Google Scholar]
- 13.Galea N, Carbone I, Cannata D, et al. Right ventricular cardiovascular magnetic resonance imaging: normal anatomy and spectrum of pathological findings. Insights Imaging. 2013;4(2):213–223. doi: 10.1007/s13244-013-0222-3. [DOI] [PMC free article] [PubMed] [Google Scholar]
- 14.Bluemke DA, Krupinski EA, Ovitt T, et al. MR Imaging of arrhythmogenic right ventricular cardiomyopathy: morphologic findings and interobserver reliability. Cardiology. 2003;99(3):153–162. doi: 10.1159/000070672. [DOI] [PubMed] [Google Scholar]
- 15.Lauenstein TC, Sharma P, Hughes T, Heberlein K, Tudorascu D, Martin DR. Evaluation of optimized inversion-recovery fat-suppression techniques for T2-weighted abdominal MR imaging. J Magn Reson Imaging. 2008;27(6):1448–1454. doi: 10.1002/jmri.21350. [DOI] [PubMed] [Google Scholar]
- 16.Karim R, Housden RJ, Balasubramaniam M, et al. Evaluation of current algorithms for segmentation of scar tissue from late Gadolinium enhancement cardiovascular magnetic resonance of the left atrium: an open-access grand challenge. J Cardiovasc Magn Reson. 2013;15:105. doi: 10.1186/1532-429X-15-105. [DOI] [PMC free article] [PubMed] [Google Scholar]


