Abstract
We investigated the combined effect of fluoride exposure and Vitamin D deficiency in causing bone damage as a precursor to development of Fluorotoxic Metabolic Bone Disease. Thirty-six male Sprague–Dawley rats were divided into 6 groups of six; 3 groups received a Vitamin D deficient diet whereas the other 3 received a Vitamin D adequate diet. Serum total 25-hydroxyvitamin D (25OHD), calcium, phosphorus, creatinine, Alkaline phosphatase (ALP), albumin, Parathyroid hormone (PTH), Osteocalcin and C terminal telopeptide (CTx) were measured following exposure to varying levels of fluoride in drinking water (< 1.0, 15 and 50 ppm). Full body Dual-energy X-ray Absorptiometry (DXA) scans were used to examine changes in bone morphology pre and post exposure to fluoride. Renal tubular function was assessed using serum creatinine and urine Cystatin C. Histopathological examination of sections of bone and kidney tissues were also performed. Prior to fluoride exposure, DXA scans revealed a significant decrease in Bone Mineral Density (BMD) and Bone Mineral content (BMC) (p < 0.05) but a significant increase in fat mass (p < 0.05) and fat percentage (p < 0.01) among Vitamin D deficient rats, with no significant change in biochemical parameters. Following exposure to fluoride, BMD was significantly increased (p < 0.05) in both groups with a corresponding increase in serum ALP, bone fluoride content, Osteocalcin, CTx and urine fluoride with increasing levels of fluoride exposure. Serum creatinine calcium and phosphate and urinary cystatin C levels showed no significant changes. Light microscopy examination revealed mild thickening and increased osteoid in 80% of the Vitamin D deficient rats exposed to high levels of fluoride but renal tubular changes were found only in one experimental and one control animal. Fluoride deposited in rat bone affects both osteoblastic and osteoclastic activity. Also, these effects are accentuated in the presence of Vitamin D deficiency.
Electronic supplementary material
The online version of this article (10.1007/s12291-017-0709-7) contains supplementary material, which is available to authorized users.
Keywords: Vitamin D deficiency, Fluoride, Drinking water fluoride levels, Fluorosis, Fluorotoxic metabolic bone disease, Bone mineral density
Introduction
Exposure to high levels of fluoride in drinking water causes changes in bone morphology and metabolism which eventually progresses to Fluorosis. This is also known as Fluorotoxic Metabolic Bone Disease (FMBD) and its toxic manifestations are Dental Fluorosis, Skeletal Fluorosis and Genu Valgum (bowing of lower limbs) among children [1]. Skeletal Fluorosis (associated with fluoride intake in water from 3.0 to 6.0 ppm per day or more) may lead to disabilities such as musculoskeletal dysfunction, arthritis, ankylosis of the spine with radiculopathy, osteosclerosis with ligament calcifications as well as peripheral neuropathy [2, 3]. Genu valgum has been found to coexist with bone disorders: osteomalacia, osteosclerosis and osteopenia [4]. The magnitude of this problem is alarming in India, as it is known to affect 62 million people including 6 million children [5]. Thus studying the causes, related factors and consequences of this major public health problem is essential.
Vitamin D deficiency is very common in India and it has been suggested that vitamin D and calcium deficiencies may render individuals more susceptible to FMBD [6–8]. This study looks at the combined effect of Vitamin D deficiency and fluoride exposure on bone morphology and metabolism which may lead to the development of FMBD. Since increased blood fluoride levels are found to be associated with impaired renal function, renal dysfunction maybe another factor contributing to fluorosis [9]. Some case reports have shown that fluorosis causes changes in the glomerular filtration rate and severe tubular damage [3, 10]. These studies have hypothesised that there is a vicious cycle wherein fluoride induced renal damage leads to further increase in the blood fluoride levels, which in turn results in further damage to the kidneys. But this area is yet to be researched extensively.
Materials and Methods
Ethical Considerations
Approval for conducting the animal experiments was obtained from the Institutional Review Board (IRB), Institutional Animal Ethics committee and the Committee for the Purpose of Control and Supervision of Experimentation on Animals (CPCSEA), as per the regulations of Government of India.
Induction of Vitamin D Deficiency in the Rat Model
Male Sprague–Dawley rats (weighing approximately 250 gm each) were divided into 6 groups with 6 rats in each group. Rats in group 2, 4 and 6 received a diet deficient in vitamin D [obtained from National Institute of Nutrition (NIN), Hyderabad]. They were housed in rooms in the animal house where there was no exposure to UV radiation. Animals in group 1, 3 and 5 were fed with a control diet that contained 400 IU of vitamin D per kg of diet (also obtained from NIN, Hyderabad) and were housed under standard lighting conditions. All animals received drinking water that contained normal levels of fluoride (< 1.0 ppm).
Laboratory Investigations
The rats maintained on the vitamin D deficient diet for 4 months were confirmed to be vitamin D deficient by serum estimation of 25OHD and calcium. At this same time, serum levels of calcium, phosphorus, creatinine, ALP and albumin were estimated in blood obtained from the retro-orbital venous plexus sinus of the rats in both control and experimental groups. Whole body animal BMD and BMC was estimated in the rats using DXA scans after inducing general anaesthesia.
Assessing Effect of Fluoride on Bone and Kidney
After the initial 4 months period of pre-conditioning, the control group and deficient group rats were administered drinking water with varying levels of fluoride (< 1.0, 15 and 50 ppm) using feeding bottles, but with the same diets as before. Rats in groups 1 and 2 continued to receive a normal (< 1 ppm) concentration of fluoride. Rats in groups 3 and 4 received 15 ppm fluoride in drinking water and rats in groups 5 and 6 received 50 ppm fluoride. This treatment was continued for 7 months. Ionized plasma fluoride levels tend to be lower in rats than in humans. It is shown that drinking water containing 15 and 50 ppm of fluoride produces plasma levels of ionized fluoride in rats equivalent to humans consuming 3 and 10 ppm of fluoride in drinking water [11, 12]. Following this, urine samples (24 hrs) were collected using metabolic cages and blood samples were obtained by cardiac puncture after sacrificing the rats.
Laboratory Investigations
To study the effect of fluoride on bone, the following tests were performed in rat serum: total 25OHD, PTH, Osteocalcin, CTx, ALP, calcium, phosphorus and creatinine. Albumin, fluoride and cystatin C were assessed in urine. Urine fluoride levels were measured by ISE in the Thermo Scientific Orion 4 star pH.ISE Bench top. Total Ionic Strength Adjustment Buffer (TISAB) was added to equal amount of urine sample in a non-glass beaker. After continuous mixing of this sample, a stable reading was displayed on the meter.
Imaging and Pathological Examinations
After 7 months of exposure to fluoride, rat BMD was measured under general anaesthesia by DXA scan and then after sacrificing the rats, the femur and vertebrae were retrieved. The rat bone morphology was assessed using light microscopy [13]. The bone content of fluoride, calcium and phosphorus were also estimated after ashing the bone [14]. Light microscopy was carried out on rat kidney sections to assess morphological damage in the kidney.
Statistical Analysis
The data was screened for outliers and extreme values using the Box-Cox plot and histogram. Descriptive statistics were used to report the clinical characteristics of rats and the data was expressed as mean ± standard deviation. The Mann–Whitney U test was used for between group (experimental and control) and risk variables. The two way Analysis of Variance (ANOVA) was used for determining statistically significant differences between the various treatment groups. A p value of less than 0.05 was considered statistically significant. The Statistical Package for Social Scientists (SPSS) version 17.0 was used for all statistical analysis.
Results
Changes in Bone Morphology and Metabolism Induced by Vitamin D Deficiency in the Rat
The only change in any biochemical parameters after 4 months exposure to a vitamin D deficient diet and prior to exposure of any group to fluoride was that, the experimental group rats had a statistically significant decrease in serum vitamin D levels (4.5 ± 3.0 vs 27 ± 6 ng/ml), but there was no significant change in levels of serum calcium (10.1 ± 0.6 vs 10 ± 0.8 mg/dl), albumin (3.3 ± 0.5 vs 3.2 ± 0.5 g/dl) or ALP (52 ± 8 vs 55 ± 8 U/L).
Table 1 shows the changes in BMD, BMC and fat mass after 4 months on a Vitamin D deficient diet. The BMC and BMD were significantly higher in the control group rats than in the experimental rats (p < 0.05). There was a significant increase in the fat mass (p < 0.05) and percentage of fat in the vitamin D deficient group (p < 0.01). The total mass of the rats in the vitamin D deficient group was found to be higher when compared to the control group, but this increase was not statistically significant.
Table 1.
The DXA scan results prior to exposure to fluoride (N = 36)
| Test | Control group n = 18 | Experimental group n = 18 | Probability (p value) | ||
|---|---|---|---|---|---|
| Mean | SD | Mean | SD | ||
| BMC (g) | 12.44 | 0.72 | 11.22 | 0.79 | 0.03* |
| BMD (g/cm2) | 0.20 | 0.01 | 0.19 | 0.01 | 0.04* |
| Fat mass (g) | 64.38 | 14.77 | 84.68 | 20.12 | 0.03* |
| % of fat | 15.5 | 3.07 | 20.48 | 3.52 | 0.01** |
| Total mass (g) | 371 | 21.11 | 377.75 | 18.49 | 0.29 |
*p < 0.05, **p < 0.01
Changes in Bone Morphology and Metabolism Induced by Varying Levels of Fluoride Intake in the Rat Model of Vitamin D Deficiency
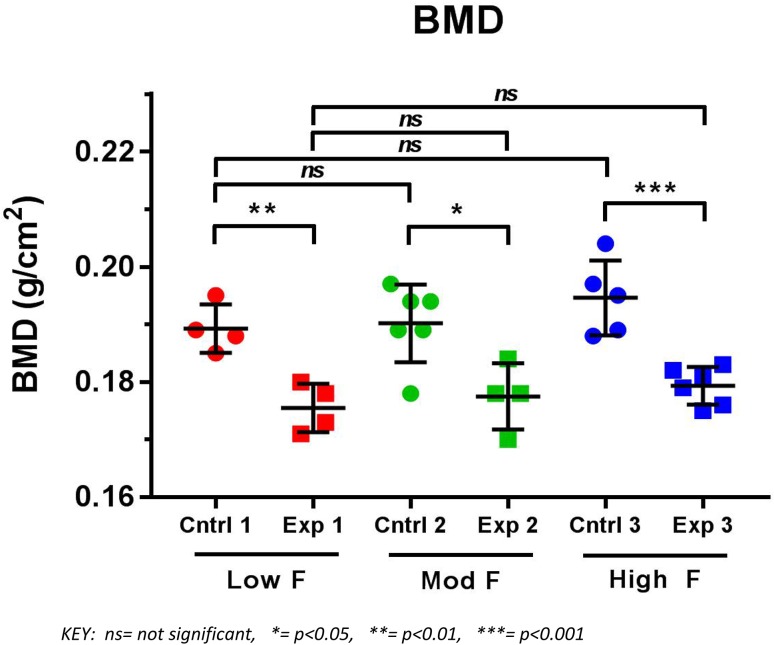
Figure 1 shows that the BMD of the rats in control group increased with increasing fluoride exposure. A similar trend was observed in the experimental group but neither findings were statistically significant. The rats from each control group had significantly higher BMD (p < 0.05) than the respective Vitamin D deficient rats exposed to the same level of fluoride. All the fluoride exposed Vitamin D deficient rats still maintained their increased fat mass and percentage of fat as compared to their respective controls, but there were no significant differences in BMC between each experimental group and its corresponding controls.
Fig. 1.
Results of DXA scans depicting BMD of vitamin D sufficient (Cntrl) and vitamin D deficient (Exp) rats after exposure to low, moderate and high fluoride in their drinking water (n = 30)
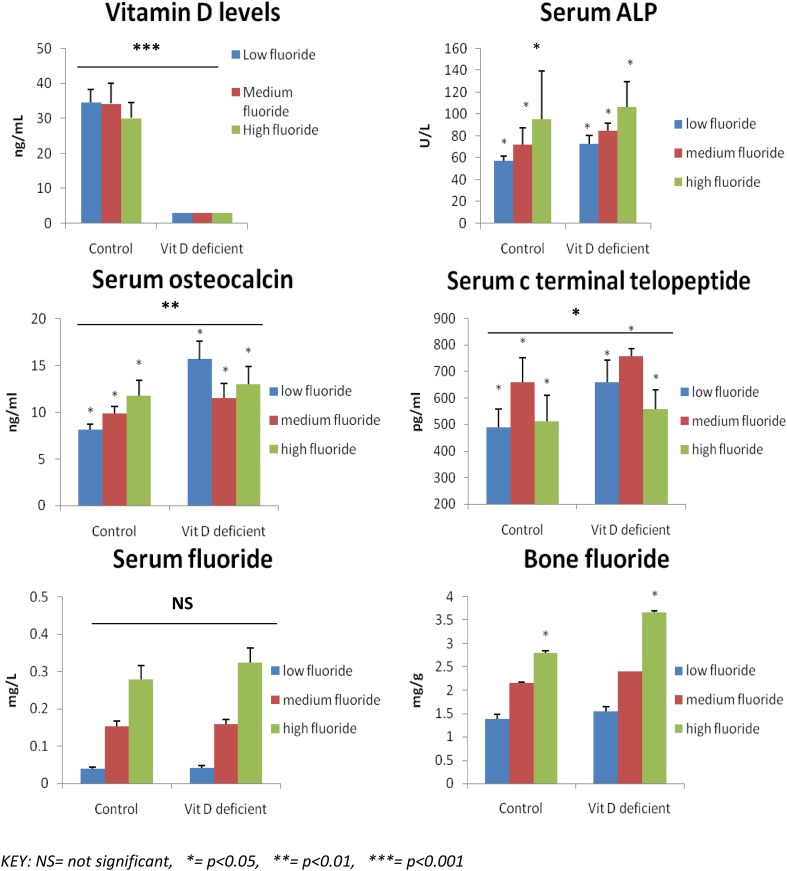
After 7 months exposure to fluoride (Fig. 2), a number of biochemical parameters of bone formation and destruction were assessed in control and experimental animals. It was observed that the Vitamin D levels of the experimental group (vitamin D deficient) in comparison with control group were undetectable (< 3 ng/ml) (p < 0.001). There were no significant changes observed in the serum calcium and serum albumin levels within or between the groups. The control group rats treated with low, moderate and high levels of Fluoride had almost the same levels of serum calcium (9.85 ± 0.55, 9.82 ± 0.17 and 9.82 ± 0.55 mg/dl respectively). There were no significant changes observed in the serum calcium values after being treated with low, moderate and high levels of fluoride, among the Vitamin D deficient rats too (10.13 ± 0.46, 9.75 ± 0.48, 10.1 ± 0.47 mg/dl). Serum levels of phosphorus were found to be increasing with increasing levels of fluoride in the control group rats (p < 0.05) but this trend was not appreciated among Vitamin D deficient group. The rats in the control group, exposed to high levels of Fluoride, had significantly higher levels (6.96 ± 0.87 mg/dl) of phosphorus when compared to the rats treated with moderate (6.18 ± 0.44 mg/dl) and low levels (5.58 ± 0.65 mg/dl) of fluoride (p < 0.05). The Vitamin D deficient rats with high levels of fluoride had higher levels (6.9 ± 0.65 mg/dl) of serum phosphorus than the group of rats treated with moderate (6.2 ± 0.29 mg/dl) and low levels (6.38 ± 0.44 mg/dl) of Fluoride.
Fig. 2.
Biochemical Parameters related to changes in bone in the control (n = 15) and experimental group (n = 15) of rats following exposure to low, moderate and high fluoride in their drinking water (N = 30)
Serum ALP was found to be increasing in both control and Vitamin D deficient groups with increasing fluoride exposure (p < 0.05). Vitamin D deficient rats also had higher ALP levels when compared to their respective controls. Serum osteocalcin (bone formation marker) was higher in Vitamin D deficient groups (p < 0.01) than in their controls. Osteocalcin levels increased with increasing fluoride exposure among control group rats (p < 0.01). After moderate fluoride exposure osteocalcin levels were lower than with high and low fluoride exposure. Overall the combined osteocalcin levels of Vitamin D deficient rats were found to be significantly higher than the combined control group data (p < 0.01).Serum CTx (bone resorption marker) levels, on an overall comparison were significantly higher among rats from the Vitamin D deficient groups when compared to their respective controls group (p < 0.05).The highest serum CTx levels were in the group with moderate fluoride exposure. There were no significant differences found between the serum fluoride levels of the Vitamin D deficient and the control group rats but serum fluoride increased with increasing fluoride exposure in all groups.
The Vitamin D deficient group had consistently higher bone fluoride levels than the control group rats which was statistically significant among the group exposed to high levels of fluoride (p < 0.05) There were no changes in bone calcium and bone phosphorus levels among the vitamin D deficient and control group rats or between the groups.
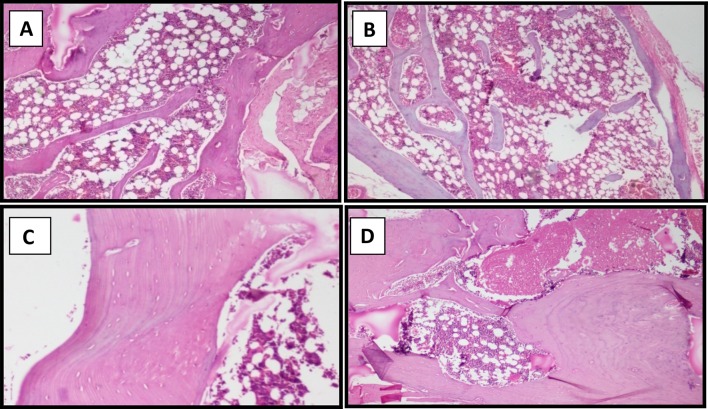
Bone histopathological examination (Fig. 3) revealed normal bone in both control and Vitamin D deficient group rats treated with low and moderate levels of fluoride. But in the Vitamin D deficient rats treated (n = 5) with a high fluoride intake of 50 ppm, examination revealed mild thickening of bone with increased osteoid. In addition, two of the rats from control group treated with high levels of fluoride had mild thickening and increased osteoid in the bone.
Fig. 3.
a and b represent light microscopy images of sections of normal bone while c and d represents images of sections of bone showing mild thickening of bone with increased osteoid rats from the control and experimental group exposed to high (50 ppm) levels of Fluoride
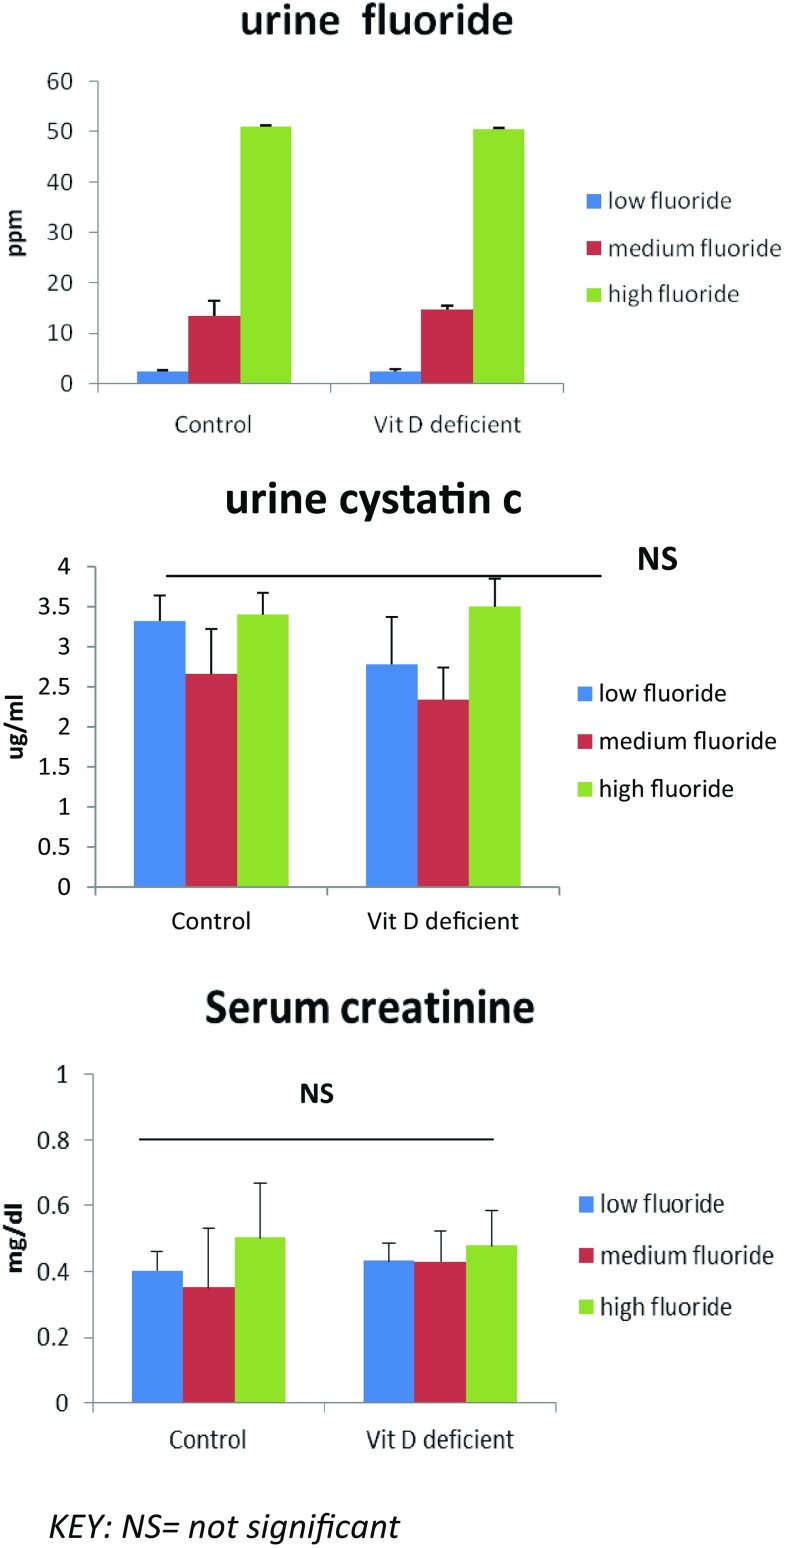
Figure 4 shows the effects of fluoride intake in drinking water on its renal excretion in the rat model of Vitamin D deficiency. Urine fluoride levels increase with increasing levels of fluoride exposure in water (p < 0.001) but there was no significant difference between the control and experimental rat groups. Urine low molecular weight protein, Cystatin C (renal tubular marker) and serum creatinine levels showed no significant changes within or between the groups.
Fig. 4.
Effects of fluoride intake in drinking water on the renal tubular function in the rat model of Vitamin D deficiency (n = 30)
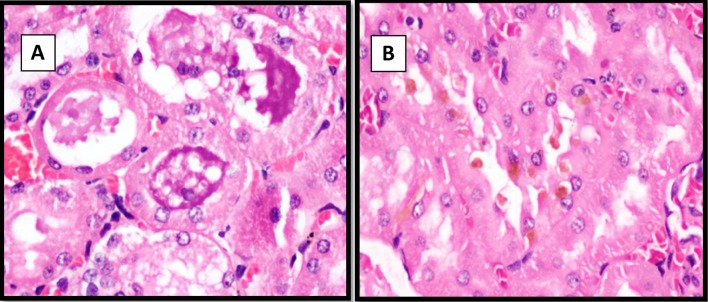
After sacrificing the 14 control group and 16 experimental group rats a light microscopic examination of the renal tissue was carried out (Fig. 5a, b. It was found that out of the rats treated with high levels of fluoride (50 ppm), one each from the control and the Vitamin D deficient group, showed sparse necrotic debris in occasional renal tubules. Both these animals had elevated serum creatinine levels (0.79 and 0.65 mg/dl respectively)
Fig. 5.
Figures a represents light microscopy sections of renal tissues showing acute tubular necrosis. Figures b represents the light microscopy sections of the normal renal tissue
Discussion
The Vitamin D deficient diet was effective in producing deficiency after 4 months, as evidenced by serum levels of total 25OHD. This is consistent with the 10 week period described in the literature [15]. Serum calcium, albumin and ALP were not significantly different in normal diet and Vitamin D deficient diet rats. This is in accordance with a study assessing Vitamin D deficiency in rats, which also found normal serum calcium concentrations [15]. Among humans also it was found that in early Vitamin D deficiency there will be no changes in serum ALP [16].
DXA scan has been found to be a sensitive, non-invasive and precise method of measurement of BMD in animals. DXA scans seem to be able to detect even the slightest change in BMD over short-periods of time, revealing a significant decrease in BMD and BMC in the Vitamin D deficient rats compared to control animals [17]. Pre and post-menopausal women with Vitamin D deficiency also had a coexisting low BMD [18] so our BMD findings in rats are consistent with this data in humans.
In the present study, there was a significant increase in the fat mass and percentage of fat among Vitamin D deficient rats. Adipose tissue is known to regulate and be regulated by Vitamin D, because intracellular calcium has a blunting effect on the lipolytic response to catecholamines [19]. This occurs by activation of the enzyme phosphodiesterase-3B (also known to mediate the antilipolytic response of insulin) and by compromising efficiency of insulin-stimulated glucose uptake [19]. Increased levels of PTH are also known to increase calcium in the adipocytes [19]. As PTH is also known to increase in Vitamin D deficiency, we can hypothesise that this is the mechanism by which Vitamin D deficiency increases fat mass in rats as well as humans.
Studying the Changes in Bone Morphology and Metabolism Induced by Varying Levels of Fluoride Intake in the Rat Model of Vitamin D Deficiency
DXA scans revealed that increasing levels of fluoride in drinking water increased the BMD of all the rats, although the BMD of the controls were higher. Other studies have found that Wistar rats fed a diet rich in sodium fluoride and calcium showed an increase in BMD [20]. Women consuming water with fluoride levels below 0.6 ppm had slightly decreased bone densities in comparison to women drinking water with fluoride levels above 0.6 ppm [21]. The BMD of axial and vertebral bone increased among women consuming water with high fluoride levels (> 8.5 ppm) [22]. Our study shows that despite Vitamin D deficiency, fluoride can cause an increase in BMD. Thus demonstrating that fluoridation of drinking water improves the mineralization of bone but its effect on bone strength has not yet been explored.
Serum ALP levels and Osteocalcin (specific marker for bone formation) levels significantly increased with increasing concentrations of fluoride in both the groups. ALP and osteocalcin levels were higher in Vitamin D deficient rats when compared to control group rats. These findings agree with a study which assessed the serum, bone ALP and serum osteocalcin levels in rats exposed for 90 days to high (150 ppm) levels of fluoride [23]. In human, Osteocalcin levels were found to be higher after exposure to fluoride for 3 weeks among healthy males [24]. Bone morphology studies, using pure hydroxyapatite (Fluoride containing discs), showed increased cell attachment, proliferation and higher ALP activity in cells cultured on these discs [25]. This demonstrates that increased concentrations of fluoride increase osteoblastic cell activity.
Other studies, over the past two decades, have shown that fluoride inhibits the activity of osteoclasts [26, 27]. The present study however found that activity of osteoclasts (as measured by serum CTx) levels, increased with low and moderate concentration of fluoride exposure but a higher concentration of fluoride appeared to have an inhibitory effect on activity of osteoclasts. CTx levels were significantly higher among all the vitamin D deficient rats compared to all the controls. We can conclude that though concomitant presence of Vitamin D deficiency and moderate levels of fluoride has a stimulatory effect on osteoclast activity, higher concentrations of fluoride may have an inhibitory effect.
Histopathological examination showed normal bone in control and Vitamin D deficient rats exposed to low and moderate levels of fluoride. However 80% of rats from the Vitamin D deficient group exposed to high levels of fluoride had mild thickening of bone with increased osteoid, whereas only 30% of their control rats had mild thickening and increased osteoid. These findings taken along with the changes in BMD, Osteocalcin, C-terminal peptide and elevated bone fluoride levels, indicates that vitamin D deficiency makes the rats more susceptible to bone damage when exposed to high levels of fluoride (50 ppm) in their drinking water. We hypothesize that Fluoride is causing a flux in bone remodelling, getting incorporated in the bone and affecting both construction and breakdown of bone.
Studying the Effects of Fluoride Intake in Drinking Water on the Renal Tubular Function of Rat Model
After exposure to fluoride, serum creatinine levels and Urinary Cystatin C concentrations did not show any significant changes. This does not agree with other studies where male Wistar rats treated for 40 days with 15 ppm and 50 ppm of fluoride had a considerable dose dependent rise in biomarkers of renal tubular function i.e. urinary beta 2 microglobulin, cystatin C, Kidney injury molecule-1 (Kim-1), Clusterin(Clu) and Osteopontine (OPN) [28]. However pathological examination of the rat renal tissue detected signs of tubular damage in two rats, exposed to high fluoride, one from control and the other from experimental group. In addition they both had elevated serum creatinine levels. Hence, we are able to conclude that there is an incidence of renal tubular damage occurring with increased fluoride intake in individual rats. It is noteworthy that increasing levels of fluoride in serum produced increased urinary excretion of fluoride, regardless of vitamin D status of the rats.
Conclusion
Our study showed that, Vitamin D deficiency significantly reduces BMD, BMC while increasing fat mass in rats. Subsequent to fluoride exposure, it was found to be depositing in bone and affecting bone remodelling. These effects were accentuated in the presence of Vitamin D deficiency. Our study also shows that Vitamin D deficiency can aggravate fluoride toxicity on the bone even in the absence of significant renal tubular dysfunction or renal failure. In our country Vitamin D deficiency is rampant and a large proportion of the population is exposed to high fluoride in drinking water. We hypothesize that correcting Vitamin D deficiency in the population at risk may decrease fluoride toxicity on the skeleton.
Limitations
The rat model of Vitamin D deficiency following Fluoride exposure was not clinically examined for signs and symptoms of FMBD.
Rat serum PTH could not be analysed due to technical problems.
Due to the non-availability of bone histomorphometry in India only light microscopic examination could be carried out.
We cannot rule out that Vitamin D rats gained weight from being kept in dark conditions rather than from Vitamin D deficiency.
Electronic Supplementary Material
Below is the link to the electronic supplementary material.
Acknowledgements
We gratefully acknowledge the Department of Clinical Biochemistry, Department of General Pathology and the Institutional Research Board for their financial support. Special thanks to Mr Matthew Boyton for help in preparation of figures.
References
- 1.Park K. Park’s textbook of preventive and social medicine. 23. Jabalpur: Banasaridas Bhanot publishers; 2011. p. 644. [Google Scholar]
- 2.WHO Guidelines for drinking-water quality. 3rd ed. incorporating first and second addenda [Internet]. [cited 2016 June 22]. http://www.who.int/water_sanitation_health/dwq/gdwq3rev/en/.
- 3.Harinarayan CV, Kochupillai N, Madhu SV, Gupta N, Meunier PJ. Fluorotoxic metabolic bone disease: an osteo-renal syndrome caused by excess fluoride ingestion in the tropics. Bone. 2006;39(4):907–914. doi: 10.1016/j.bone.2006.04.021. [DOI] [PubMed] [Google Scholar]
- 4.Teotia M, Teotia SP, Singh RK. Skeletal fluoride toxicity in children. Indian J Pediatr. 1979;46(382):389–396. doi: 10.1007/BF02902970. [DOI] [PubMed] [Google Scholar]
- 5.Susheela AK. Fluorosis management programme in India. Curr Sci. 1999;77:1250–1256. [Google Scholar]
- 6.Misra UK, Gujral RB, Sharma VP, Bhargava SK. Association of vitamin D deficiency with endemic fluorosis in India. Fluoride. 1992;25(2):65–70. [Google Scholar]
- 7.Harinarayan CV, Joshi SR, Vitamin D deficiency, rickets, and fluorosis in India. In: Holick MF, editors. Vitamin D [Internet]. Humana Press; 2010 [cited 2016 Apr 1]. p. 543–61. (Nutrition and Health). http://link.springer.com/chapter/10.1007/978-1-60327-303-9_28.
- 8.Khandare AL, Harikumar R, Sivakumar B. Severe bone deformities in young children from vitamin D deficiency and fluorosis in Bihar-India. Calcif Tissue Int. 2005;76(6):412–418. doi: 10.1007/s00223-005-0233-2. [DOI] [PubMed] [Google Scholar]
- 9.Juncos LI, DonadioJr JV. Renal failure and fluorosis. JAMA. 1972;222(7):783. doi: 10.1001/jama.1972.03210070017005. [DOI] [PubMed] [Google Scholar]
- 10.Lantz O, Jouvin MH, De Vernejoul MC, Druet P. Fluoride-induced chronic renal failure. Am J Kidney Dis. 1987;10(2):136–139. doi: 10.1016/S0272-6386(87)80046-X. [DOI] [PubMed] [Google Scholar]
- 11.Dunipace AJ, Brizendine EJ, Zhang W, Wilson ME, Miller LL, Katz BP, et al. Effect of aging on animal response to chronic fluoride exposure. J Dent Res. 1995;74(1):358–368. doi: 10.1177/00220345950740011201. [DOI] [PubMed] [Google Scholar]
- 12.Turner CH, Owan I, Brizendine EJ, Zhang W, Wilson ME, Dunipace AJ. High fluoride intakes cause osteomalacia and diminished bone strength in rats with renal deficiency. Bone. 1996;19(6):595–601. doi: 10.1016/S8756-3282(96)00278-5. [DOI] [PubMed] [Google Scholar]
- 13.Axelrod DJ. An improved method for cutting undecalcified bone sections and its application to radio-autography. Anat Rec. 1947;98(1):19–24. doi: 10.1002/ar.1090980103. [DOI] [PubMed] [Google Scholar]
- 14.McCann HG. Determination of fluoride in mineralized tissues using the fluoride ion electrode. Arch Oral Biol. 1968;13(4):475–477. doi: 10.1016/0003-9969(68)90174-X. [DOI] [PubMed] [Google Scholar]
- 15.Lester GE, VanderWiel CJ, Gray TK, Talmage RV. Vitamin D deficiency in rats with normal serum calcium concentration. Proc Natl Acad Sci USA. 1982;79(15):4791–4794. doi: 10.1073/pnas.79.15.4791. [DOI] [PMC free article] [PubMed] [Google Scholar]
- 16.Hashemipour S, Larijani B, Adibi H, Sedaghat M, Pajouhi M, Bastan-Hagh MH, et al. The status of biochemical parameters in varying degrees of vitamin D deficiency. J Bone Miner Metab. 2006;24(3):213–218. doi: 10.1007/s00774-005-0674-8. [DOI] [PubMed] [Google Scholar]
- 17.Ammann P, Rizzoli R, Slosman D, Bonjour JP. Sequential and precise in vivo measurement of bone mineral density in rats using dual-energy x-ray absorptiometry. J Bone Miner Res. 1992;7(3):311–316. doi: 10.1002/jbmr.5650070310. [DOI] [PubMed] [Google Scholar]
- 18.Harinarayan CV, Sachan A, Reddy PA, Satish KM, Prasad UV, Srivani P. Vitamin D status and bone mineral density in women of reproductive and postmenopausal age groups: a cross-sectional study from south India. J Assoc Physicians India. 2011;59:698–704. [PubMed] [Google Scholar]
- 19.McCarty MF, Thomas CA. PTH excess may promote weight gain by impeding catecholamine-induced lipolysis-implications for the impact of calcium, vitamin D, and alcohol on body weight. Med Hypotheses. 2003;61(5–6):535–542. doi: 10.1016/S0306-9877(03)00227-5. [DOI] [PubMed] [Google Scholar]
- 20.Nakahara H. The effect of sodium fluoride on bone mineral density and bone strength in ovariectomized rats. Nippon Seikeigeka Gakkai Zasshi. 1995;69(11):1182–1192. [PubMed] [Google Scholar]
- 21.Lan CF, Lin IF, Wang SJ. Fluoride in drinking water and the bone mineral density of women in Taiwan. Int J Epidemiol. 1995;24(6):1182–1187. doi: 10.1093/ije/24.6.1182. [DOI] [PubMed] [Google Scholar]
- 22.Meunier PJ, Femenias M, Duboeuf F, Chapuy MC, Delmas PD. Increase of vertebral bone density in heavy drinkers of mineral water with a high fluoride content. Presse Med. 1989;18(29):1423–1426. [PubMed] [Google Scholar]
- 23.Song Y, Tan H, Liu K, Zhang Y, Liu Y, Lu C, et al. Effect of fluoride exposure on bone metabolism indicators ALP, BALP, and BGP. Environ Health Prev Med. 2011;16(3):158–163. doi: 10.1007/s12199-010-0181-y. [DOI] [PMC free article] [PubMed] [Google Scholar]
- 24.Dandona P, Coumar A, Gill DS, Bell J, Thomas M. Sodium fluoride stimulates osteocalcin in normal subjects. Clin Endocrinol (Oxf) 1988;29(4):437–441. doi: 10.1111/j.1365-2265.1988.tb02893.x. [DOI] [PubMed] [Google Scholar]
- 25.Qu H, Wei M. The effect of fluoride contents in fluoridated hydroxyapatite on osteoblast behavior. Acta Biomater. 2006;2(1):113–119. doi: 10.1016/j.actbio.2005.09.003. [DOI] [PubMed] [Google Scholar]
- 26.Pei J, Li B, Gao Y, Wei Y, Zhou L, Yao H, et al. Fluoride decreased osteoclastic bone resorption through the inhibition of NFATc1 gene expression. Environ Toxicol. 2014;29(5):588–595. doi: 10.1002/tox.21784. [DOI] [PubMed] [Google Scholar]
- 27.Bhawal UK, Lee H-J, Arikawa K, Shimosaka M, Suzuki M, Toyama T, et al. Micromolar sodium fluoride mediates anti-osteoclastogenesis in Porphyromonasgingivalis-induced alveolar bone loss. Int J Oral Sci. 2015;7(4):242–249. doi: 10.1038/ijos.2015.28. [DOI] [PMC free article] [PubMed] [Google Scholar]
- 28.Cárdenas-González MC, Del Razo LM, Barrera-Chimal J, Jacobo-Estrada T, López-Bayghen E, Bobadilla NA, et al. Proximal renal tubular injury in rats sub-chronically exposed to low fluoride concentrations. Toxicol Appl Pharmacol. 2013;272(3):888–894. doi: 10.1016/j.taap.2013.07.026. [DOI] [PubMed] [Google Scholar]
Associated Data
This section collects any data citations, data availability statements, or supplementary materials included in this article.


