

Abstract
Insertions of mobile elements1-4, mitochondrial DNA5 and fragments of nuclear chromosomes6 at DNA double strand breaks (DSBs) threaten genome integrity and are common in cancer7-9. Insertions of chromosome fragments at V(D)J loci can stimulate antibody diversification10. The origin of insertions of chromosomal fragments and the mechanisms that prevent such insertions remain unknown. Here we found the first mutant, lacking evolutionarily conserved Dna2 nuclease, that shows frequent insertions of ~0.1-1.5 kb long sequences into DSBs with many events carrying multiple DNA fragments joined together. Sequencing of ~500 DNA inserts revealed that they originate from Ty retrotransposons (~8%), rDNA (~15%) and from throughout the genome with preference for fragile regions such as origins of replication, R-loops, centromeres, telomeres or replication fork barriers. Inserted fragments are not lost from their original loci and therefore represent duplications. These duplications depend on nonhomologous end-joining (NHEJ) and Pol4. We propose a model in which alternative processing of DNA structures arising in Dna2-deficient cells can result in the release of DNA fragments and their capture at DSBs.Similar DNA insertions at DSBs are expected in any cells with linear extrachromosomal DNA fragments.
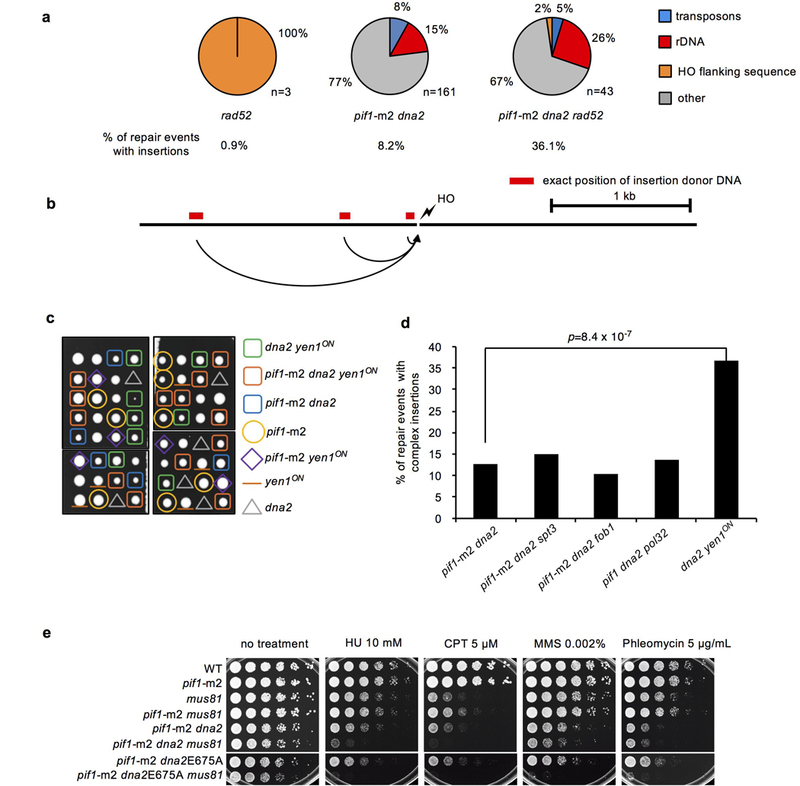
We followed DSB repair by NHEJ in yeast cells deficient in the nuclease/helicase Dna2 and found that ~8% of survivors carried large ~100 bp to ~1,500 bp insertions whereas the remaining events were comparable to wild type (Fig. 1a-b, Extended Data Fig. 1, Extended Data Table 1-2, Supplementary Information Table 1). In this experimental design11, HO endonuclease-induced DSBs at the MATa locus can only be repaired by imprecise NHEJ that alters the HO cleavage site preventing further cutting. Analysis was done in cells carrying a suppressor of dna2Δ lethality, pif1-m2 mutation12. No insertions were found in pif1-m2 or wild-type control cells. Dna2’s nuclease but not helicase activity is required to suppress insertions at DSBs (Fig. 1b). Similar insertions are observed at a DSB induced at an artificially introduced ACT1 intron within the URA33 or at CRISPR/Cas9-induced DSB at LYS2 (Extended Data Fig. 1, Extended Data Table 1). Sequencing analysis of ~500 insertions from all Dna2-deficient cells reveals that ~15% of events carried 2 to 4 fragments from different chromosomes joined together at the DSB (Fig. 1c,d).
Figure 1. Dna2 inhibits large insertions at DSBs.
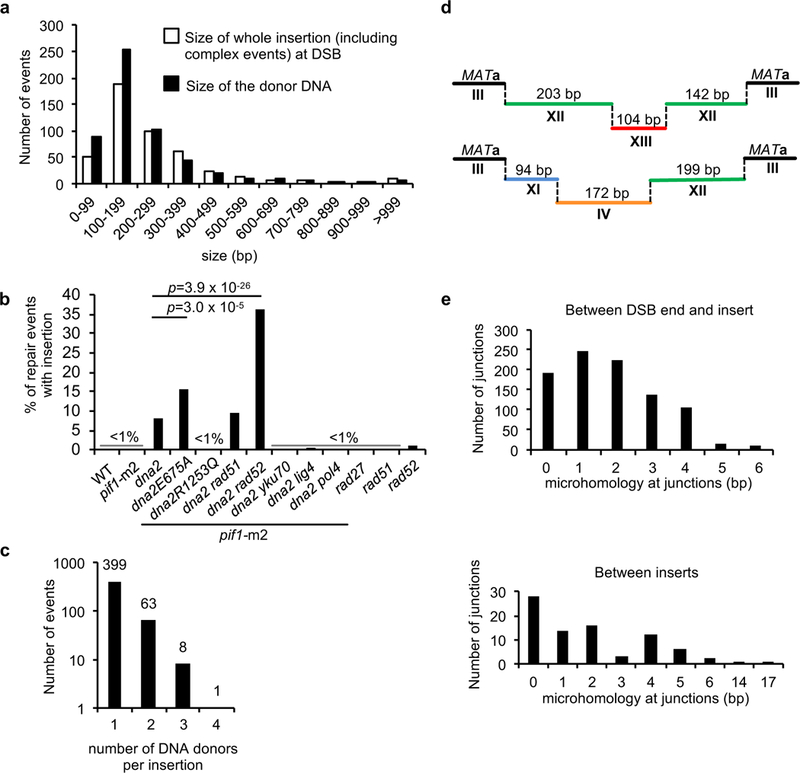
a, Insertion size analysis in Dna2-deficient cells. b, Frequency of insertions in indicated mutants. χ2 test is used to determine the p value, number of colonies tested per mutant is indicated in Extended Table 1. c Number of DNA fragments per insertion. d, Two examples of complex insertions at DSBs. e, Analysis of microhomologies at junctions of inserted DNA or between inserted fragments.
Inserted pieces of other chromosomes are duplicated as none of 25 randomly tested donor DNAs are deleted from their original locus and the number of insertions originating from essential genes (46/222 in all strains tested) is proportional to the number of essential genes in yeast (~20%). Duplications include short complete genes, replication origins and fragments of telomeres or centromeres (Supplementary Information Table 1). NHEJ is the primary pathway mediating these insertions as most of the junctions carried 0-4 nt of microhomology (Fig. 1e), DSB ends were mostly maintained (Extended Data Fig. 1) and elimination of NHEJ components (Ku, Lig4 or Pol4) nearly abolished insertions (Fig. 1b). Single insertion captured in NHEJ-deficient cells show an increased microhomology and loss of sequences at DSB ends, typical features of alternative end joining (alt-EJ). In contrast, elimination of homologous recombination specific Rad51 or Rad52 enzymes had no effect or even increased the level of insertions in pif1-m2 dna2Δ cells, respectively (Fig. 1b).
The origins of inserted DNAs in pif1-m2 dna2Δ were grouped into four major categories. First, ~8% of the insertions are fragments of retrotransposons which comprise ~3% of the 12.1 Mb yeast genome. Second, ~15% came from rDNA representing ~10% of the genome. The third group (74%) came from all over the genome. Lastly, 3% originates from 6.3 kb resident 2μ DNA plasmids (~50 copies/cell), proportional to their nuclear DNA content. Mitochondrial DNA was not inserted. Proximity of insertion donor DNA to the DSB is not important as few insertions originate from chromosome carrying DSB, and the number of donor DNAs from different chromosomes correlates simply with their size. The only exception is chromosome XII that carries the largest hotspot of insertion donor DNA, rDNA (Extended Data Fig. 2). Accordingly, analysis of the 3-dimensional proximity of the donor DNAs, as measured by chromosome conformation capture13, was not different from the contact probability of random sequences to the locus of DSB (Extended Data Fig. 2).
Pieces of all four active yeast transposons are inserted at DSBs (Fig. 2a-b) whereas previously only the most abundant Ty1 transposon insertions were reported1,3. The reverse transcriptase activity of retrotransposons is important for transposon insertions since elimination of Spt3 required for Ty transcription14 in pif1-m2 dna2Δ cells decreases Ty insertions to the genomic level of transposons (~3%) (Extended Data Table 1). Ty1 cDNA levels increased in pif1-m2 dna2Δ cells (Fig. 2c) and the rate of retrotransposition measured via Ty1-His3 reporter15 also increased (Fig. 2d). Elevated levels of cDNA in pif1-m2 dna2Δ are not related to increased transcription of Ty but may result from an increased cDNA stability (Extended Data Fig. 3). Thus Dna2 inhibits retrotransposition and insertions of transposon pieces at DSBs.
Figure 2. Dna2 limits mobility of transposable elements.
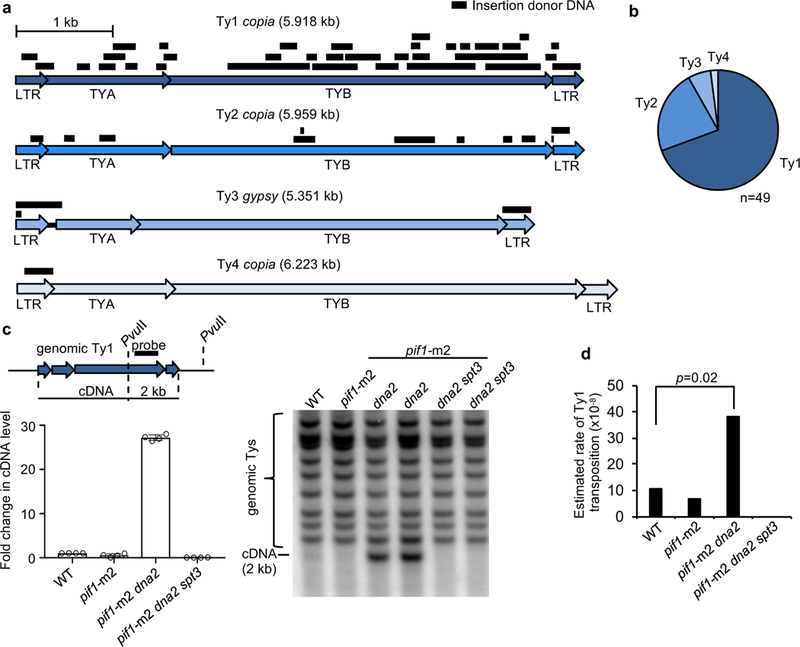
a, Position of inserted DNA coming from yeast transposons. b, Contribution of yeast transposons to insertions. c, Scheme of Ty1 cDNA analysis, Southern blot analysis and quantification of Ty1 cDNA amount in indicated mutants. Plotted are the mean values ± s.d., n=3 and represents number of independent experiments. For gel source data, see Supplementary Data Figure 1. d, Rates of retrotransposition in indicated mutants. Bootstrap resampling approach (two-tailed) was used to determine p value; n=4 and represents number of independent experiments.
About 15% of insertions originate from ~150 rDNA repeats. Each 9.1 kb long repeat contains 5S and 35S genes, origin of replication (ARS) and replication fork blocking (RFB) sequences (Fig. 3a). RFB bound by Fob1 protein prevents head-on collisions between replication forks and 35S transcription bubbles. Most DNA inserted at DSB and originating from rDNA comes from region between ARS and RFB sequences, where Dna2 prevents fork stalling16. This distribution depends entirely on Fob1 and thus fork pausing at RFB (Fig. 3a). Proximity of insertion donor DNA to ARS elements is a general feature as 34 out of 41 donor DNA hotspots providing at least two inserted fragments within 3 kb are located in the vicinity of replication origins. Also, nearly half of 18 insertions from 2μ plasmids come from origin of replication sequences (Fig. 3b-c, Extended Data Fig. 4). Genome wide analysis of the overlap or proximity of insertion donor DNAs to ARS sequences confirms this correlation (Fig. 4a). Donor DNAs were found to be close to sites of prominent R-loops, centromeres or telomeres when compared to randomly selected sequences of equal size and frequency per chromosome (Fig. 4b-c). These regions are known to cause fork stalling17-19 and require Dna2 for proper replication (e.g. 20,21). Finally, treatment of pif1-m2 dna2Δ mutant cells with a high dose of hydroxyurea, a drug known to cause fork stalling and reversal22, results in ~2-fold increase of insertions (Fig. 4d). Together, inserted donor DNAs often originate from fragile genomic regions where fork stalling is more likely.
Figure 3. Origin of inserted DNA at DSBs.
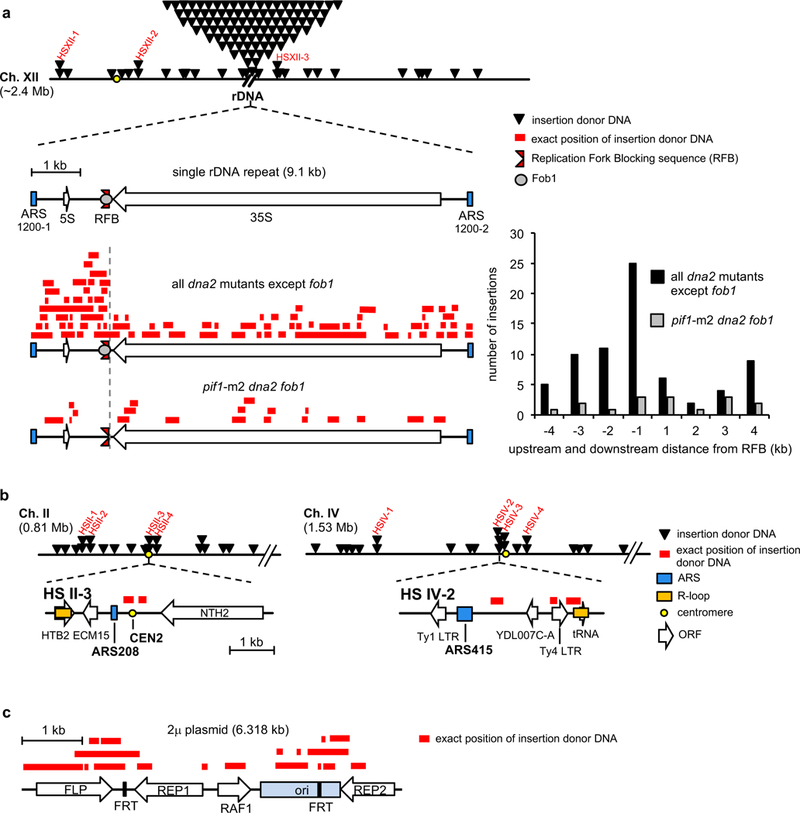
a, Location of inserted DNA at DSB arising from chromosome XII. Hotspots are marked in red. Below, a schematic of single rDNA repeat and position of inserted DNA coming from rDNA repeats. Graph showing number of insertions with respect to RFB position. b, Examples of hotspots of the origin of insertions with genomic features shown. c, Inserted DNA from 2μ plasmid.
Figure 4. Insertions originate from regions where replication forks stall.
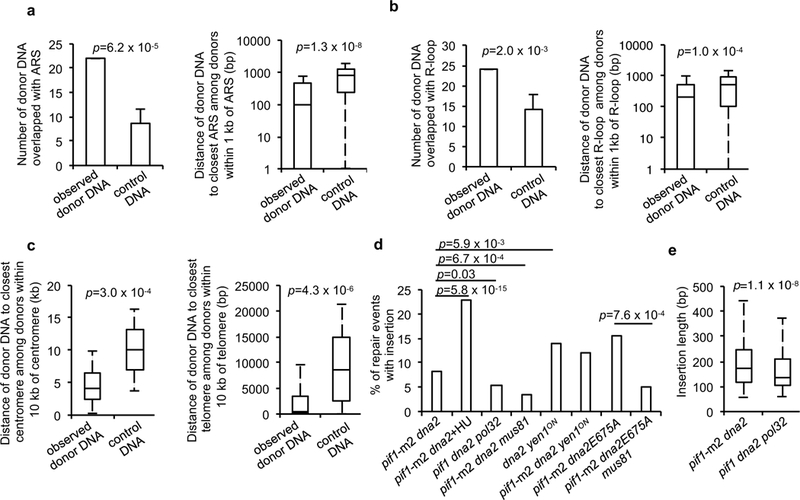
Bar, data are presented as mean ± s.d. Box, centre line is median; boxes, first and third quartiles; whiskers, the maximum of minimum value and Q1-1.5 x IQR, the minimum value of maximum value and Q3 + 1.5 x IQR. a-c, Plots showing overlap or proximity of observed insertions and control DNA with indicated genomic features. P values for overlap and proximity are determined by bootstrapping and one-tail Wilcoxon test, respectively; 4a,b n=370, 4c ncentromere=370, ntelomere=371 and represents the number of independent insertions. Experiments with control DNA were repeated 1,000,000 times (4a) or 1,000 times (4b, c). d, Insertion frequencies in indicated mutants. χ2 test is used to determine the p values; number of colonies tested per mutant is indicated in Extended Table 1. e Insertion length analysis in indicated mutants. P value is calculated by one-tail one sample Wilcoxon test; number of independent insertions per mutant is shown in Extended Table 1.
Inserted DNA is not deleted from its original locus therefore it is either over-replicated and then pasted into a DSB or it originates from a fragmented sister chromatid. We favor the first scenario because Dna2 plays two functions that prevent over-replication: it removes long 5’ flaps during lagging strand synthesis and it prevents and/or degrades reversed forks22-24. Long unprocessed 5’ flaps may contribute to insertions because elimination of Pol32, the processivity subunit of Polδ, as well as Pif1 helicase, both of which stimulate displacement synthesis that generates long flaps25,26, reduces insertion frequency by about 50% and the remaining insertions in pif1Δ pol32Δ dna2Δ are shorter (Fig. 4d-e). The size range of 5’ flaps generated in Dna2-deficient mutants resembles that of insertions observed here24. Overexpression of Rad52 was previously shown to reduce the level of Dna2 substrates, presumably 5’ flaps27. Consistently we found a dramatic increase of insertions in pif1-m2 dna2Δ rad52Δ. We note that rad52Δ mutants showed rare insertions (1%) of DNA from the first 2 kb surrounding the DSB (Extended Data Fig. 5). Elimination of nonessential Rad27, the other nuclease that processes much shorter 5’ flaps, does not result in insertions, suggesting efficient alternative processing of the flaps arising in rad27Δ cells (Fig. 1b). Reversed forks could also contribute because inserted DNAs originate from genomic regions prone to fork stalling (Fig. 4a-c). Unprocessed DNA structures in the absence of Dna2 can be cleaved by alternative nucleases leading to release of DNA fragments subsequently inserted at DSBs. A significant increase of insertions in dna2-E675A cells suggests that the nuclease-dead dna2 may bind and stabilize such DNA structures (Fig. 1b). Elimination of structure specific nuclease Mus81 which cleaves stalled or reversed forks decreased insertions by over two-fold (Fig. 4d) and sensitized dna2Δ mutants to DNA damage (Extended Data Fig. 5). Yen1 nuclease cleaves 5’ flaps or stalled and reversed forks28. This nuclease is essential for growth in cells carrying hypomorphic mutants of Dna229 and constitutively active yen1ON28 could suppress lethality of dna2Δ (30 and Extended Data Fig. 5). This means that Yen1 can cleave at least some unprocessed structures in dna2Δ cells. Although dna2Δ yen1Δ cannot be constructed, we found that dna2Δ cells carrying hyperactive yen1ON exhibited increased insertions and an increased number of complex events (Fig. 4d, Extended Data Fig. 5). Thus, Mus81 and likely Yen1 are needed for at least some of the insertions observed in Dna2-deficient cells. A model of insertions by alternative cleavage of structures normally processed by Dna2 is presented in Extended Data Fig. 6. To test whether there is any small mass DNA in Dna2-deficient cells we separated DNA from wild type and mutant cells and fragments corresponding to the size of insertions were extracted from the gel and subjected to qPCR analysis using sets of primers specific for the largest source of inserted DNA, rDNA. We observed much higher levels of DNA in pif1-m2 dna2Δ cells when compared to wild type, and this difference was dependent on Fob1 (Extended Data Fig. 7).
The absence of Dna2 nuclease is not required for insertions as long as extrachromosomal DNA is present in cells. Transformed dsDNA or even ssDNA was incorporated into DSBs in both wild-type and pif1-m2 dna2Δ cells (Extended Data Fig. 7). An increase of insertions of ssDNA in pif1-m2 dna2Δ cells suggests that Dna2 can also limit insertions by degrading ssDNA formed in a Dna2-independent manner.
The mechanism of genome instability reported here may be related to insertions of comparable size reported in cancer7, at V(D)J loci10, and in the formation of short interstitial telomeric sequences common in the human genome, and may contribute to short gene duplications and chromosome evolution.
Methods
Media, yeast strains and plasmids
All strains used in this work are derivatives of three strains: (i) JKM139 to study insertion at MATa locus (DELho hml::ADE1 MATa hmr::ADE1 ade1 leu2-3,112 lys5 trp1::hisG ura3-52 ade3::GAL10::HO)11; (ii) yYY379 to study insertion at URA3 locus (DELho hml::ADE1 MATa::hphMX hmr::ADE1 ade1 leu2-3,112 lys5 trp1::hisG URA3::actin intron::HOcs ade3::GAL10::HO); (iii) DG1657 to study retrotransposition and Ty1 cDNA level (MATa ura3-167 his3Δ−200 trp1-hisG leu2-hisG Ty1-270his3-AI Ty1-588neo Ty1-146[tyb1::lacZ])15, a gift from Dr. David J. Garfinkel. yYY379 strain was obtained by replacing the HO cleavage site with hphMX at MATa locus and by replacing URA3 with URA3::ACT1 intron::HOcs. URA3::ACT1 intron::HOcs cassette was amplified from AGY117 strain3, a gift from Dr. Abram Gabriel. A list of all strains is presented in Supplemental Information Table 2. Helicase-dead mutant (dna2R1253Q) and nuclease-dead mutant (dna2E675A) of DNA2 were introduced into the genome using the delitto perfetto approach31.
HO induction and analysis of NHEJ efficiency
To induce HO endonuclease, cells from an overnight saturated culture in YEPD (1% yeast extract, 2% peptone, 2% dextrose) were washed twice with YEP-raffinose (1% yeast extract, 2% peptone, 2% raffinose), inoculated into 5 mL YEP-raffinose and incubated overnight at 30 °C. When the density of the culture reached ~1-2 × 10⁷ cells/mL, cells were spread on YEP-galactose plates (1% yeast extract, 2% peptone, 2% galactose) and incubated at 30 °C for up to 6 days. As a control, cells were spread onto YEPD plates. The NHEJ efficiency was calculated as the number of colonies on YEP-galactose divided by the number of colonies on YEPD. The experiment was repeated at least three times for each mutant. For hydroxyurea (HU) treatment, HU was added to a final concentration of 80 mM when the density of the culture reached ~1 × 10⁷ cells/mL in YEP-raffinose and incubated for 4 hr before plating.
Analysis of insertions at MATa locus
Single colonies from YEP-galactose plates were used for colony PCR using the following primers: mata-F (ACTTCAAGTAAGAGTTTGGGTATGT) (165 bp upstream of HO cleavage site) and mat-Rw (TACTGACAACATTCAGTACTCGAAAG) (165 bp downstream of HO cleavage site). The amfiSure PCR Master Mix (GenDEPOT, cat# P0311) was used for PCR with the following conditions: 94 °C for 5 min; 35 cycles of 94 °C for 30 s, 52 °C for 30 s and 72 °C for 2 min 30 s. PCR products were analyzed by electrophoresis (1.2% agarose in 1X TBE buffer) at 8 V/cm for 30 min. PCR products having large insertions were cleaned up with the NucleoSpin Kit (Macherey-Nagel, cat# 740609) and sequenced by Sanger sequencing. ApE software was used to analyze the microhomology of insertion. SnapGene was used to map the insertion to chromosome, Ty, rDNA and 2μ plasmid. To determine statistically significant differences in insertion frequencies between strains we used χ2 analysis.
Analysis of insertion at URA3 locus
Yeast were grown in YEP-raffinose up to a density of ~1-2 × 10⁷ cells/mL, and galactose was added to a final concentration of 2% and incubated at 30 °C for 24 hr. Cells were plated on 5-FOA plates and incubated at 30 °C for 6 days. For transient DSB induction glucose was added at 1, 2 or 4 hr to a final concentration of 2% to shut down the expression of galactose-inducible HO and the cells were plated on 5-FOA plates and incubated at 30 °C for 6 days. To screen for insertions at the DSB, primers Act1-Fw (ATATCGTGGTTATTACAGATCAGTCA) (165 bp upstream of HO cleavage site) and Ura3-Rw (ATTGTTAGCGGTTTGAAGCAGG) (165 bp downstream of HO cleavage site) were used. The sequencing and analysis of inserts was performed as described above for the MATa locus.
Analysis of insertion at LYS2 locus
Plasmids marked with the LEU2 gene containing constitutively expressed gRNA gLYS2-2W and a galactose-inducible Cas9, a gift from Dr. James Haber32, were transformed into wild-type and mutant yeast cells. To induce Cas9, cells from an overnight saturated culture in leucine drop-out glucose media were washed and inoculated into 5 mL YEP-raffinose and incubated overnight at 30°C. When the density of the culture reached ~1-2 × 10⁷ cells/mL, cells were spread on leucine drop-out galactose plates (2% galactose) and incubated at 30 °C for up to 6 days. As a control, cells were spread onto leucine drop-out-glucose plates. The NHEJ efficiency was calculated as described32. To test for large insertions, single colonies from leucine drop-out galactose plates were used for colony PCR using the following primers: Lys2-Fw (TAGACGAGTTCAAGCATCATTTAGT) (120 bp upstream of Cas9 cleavage site) and Lys2-Rw (CAAGTTCTTAGTTGGATCAGGT) (122 bp downstream of Cas9 cleavage site). PCR fragments carrying insertions were sequenced and analyzed.
Analysis of extrachromosomal DNA
Yeast were grown in YEPD to a density of ~1-2 × 10⁷ cells/mL. 1 × 10⁸ cells were harvested and washed twice in buffer A (100 mM EDTA, 50 mM Tris-HCl, pH 7.4). Cells were resuspended in melted (45 °C) 0.5% agarose prepared in buffer A with 0.3 mg/ml Zymolyase 100T (in 10 mM KPO4, pH 7.4) and transferred to a plug mold. Plugs were incubated in 400 μl buffer A at 37 °C for 1 hr followed by addition of 100 μl 5% Sarcosyl for 1.5 hr and followed by addition of 10 μl 10 mg/ml RNase A and 4 μl Riboshredder (Epicentre, cat# RS12500) for an additional 2.5 hr. The plugs containing DNA were loaded onto 0.8% agarose and electrophoresis was performed in 1X TBE buffer at 8 V/cm for 40 min. In each lane the agarose gel fragments corresponding to 75 bp-1.5 kb and to slow migrating genomic DNA were cut separately. The DNA was extracted using the NucleoSpin Kit. The Power SYBR Green PCR Master Mix (Applied Biosystems, cat# 4367659) was used for quantitative PCR with the following conditions: 95 °C for 10 min; 40 cycles of 95 °C for 15 s, 60 °C for 1 min. Primers were NTS1-QF2 (TGGCTTCCTATGCTAAATCCC) and NTS1-QR3 (GCATAATGGAGTGCTTAACTCTTC) for NTS1#A, NTS1-QF (ACACCCTCGTTTAGTTGCTTC) and NTS1-QR (CGGTATGCGGAGTTGTAAGATG) for NTS1#B. The amount of short DNA (75 bp-1.5 kb) from each lane was normalized to large mass genomic DNA. The cycle threshold numbers were used to determine the fold difference in the amount of short DNA between wild type and mutants.
Analysis of insertion of transformed DNA
To analyze the efficiency of insertions of transformed DNA into a DSB the 98 nt long oligos M13-X-98-Fw (GTACTAAGACTCATAATTACATTTGGCGTTATGTATCTGCATTAGTTGAATGTGGTATTCCTAAATCTCAACTGATGAAACGTTCAACGTGACAAGTC) and complementary M13-X-98-Rw (GACTTGTCACGTTGAACGTTTCATCAGTTGAGATTTAGGAATACCACATTCAACTAATGCAGATACATAACGCCAAATGTAATTATGAGTCTTAGTAC) were synthesized. To obtain duplex DNA, equal amounts of complementary oligos were mixed and heated at 95 °C for 5 min and cooled down at room temperature. Reverse-phase cartridge-purified oligos were purchased from Sigma-Aldrich and dissolved with annealing buffer (1 mM EDTA, 50 mM NaCl, 10 mM Tris, pH 7.5) to 200 μM. When culture density reached ~1-2 × 10⁷ cells/mL in YEP-raffinose, cells were collected and washed twice with water. For each transformation, 1.5 × 10⁸ cells were mixed with 240 μl 50% PEG3350, 36 μl 1M lithium acetate and 20 μl 100 μM dsDNA or 40 μl 100 μM ssDNA and water to total 360 μl. The transformation mixture was incubated at 30°C for 30 min followed by 42 °C for 30 min. The cells were centrifuged, resuspended in water, spread on galactose plates and incubated at 30 °C for 6 days. The primers mata-F and mat-Rw were used to test insertion of transformed DNA. All insertions were sequenced and analyzed.
Analysis of Ty cDNA amount
A single colony from each mutant was inoculated into 5 ml of YEPD and incubated overnight at 24 °C. A 5-μl aliquot of each culture was inoculated into 25 ml of fresh YEPD the next day and grown for an additional 2 days at 24 °C. Cells were collected and total genomic DNA was isolated by glass bead disruption using a standard phenol chloroform extraction protocol. DNA was then digested with PvuII and separated on 0.8% agarose gels. Southern blotting and hybridization with radiolabeled DNA probes was carried out using a standard protocol33. Ty1 PvuII-SnaBI fragment of Ty1-H3 was used as a P32-labeled DNA probe and was prepared by PCR using primers PvuII-F1 (CTGTAAAAGCAGTAAAATCAATCAAAC) and SnaBI-R1 (GTATAGATTATTACCTGATACTTCATCTCT). Intensity of bands on Southern blots corresponding to probed DNA fragments was analyzed using ImageQuant TL software (Amersham Biosciences) and normalized to three genomic Ty1 fragments, as previously described15.
Analysis of Ty cDNA stability
A single colony from each mutant was inoculated in 80 ml of YEPD liquid for 2 days at 24 °C. 20 ml of this culture was then pelleted, washed, and resuspended in 250 ml of fresh YEPD. Cultures were then shaken at 24 °C for 2 hr. 50 ml aliquots were removed (time 0) before adding the reverse transcriptase inhibitor phosphonoformic acid (PFA; Sigma) to a concentration of 600 μg/ml as previously described34. 50-ml aliquots were removed after 1, 2, 4, or 6 hr of growth at 24 °C. Cells were then pelleted, and total genomic DNA was isolated, digested with PvuII, and processed for Southern analysis as described above. The stability of cDNA was calculated from the slope of the best-fit line. The amount of DNA in each lane was normalized using bands corresponding to genomic Ty. The amount of cDNA over time was quantified by dividing pixel intensities of the bands corresponding to cDNA with PFA by the intensity of the bands corresponding to cDNA without PFA in each time point. All quantification was done using ImageQuant TL software.
Analysis of Ty1 transcription
A single colony from each mutant was inoculated in 5 ml of YEPD overnight at 24 °C. A 5 μl aliquot of each culture was inoculated into 25 ml of fresh YEPD and grown for an additional 2 days at 24 °C. A 5 ml aliquot of each culture was pelleted, and RNA was extracted using the MasterPure Yeast RNA Purification Kit (Lucigen cat# MPY03100). RNA samples mixed with glyoxal loading dye were separated on a 1% agarose gel and transferred to nitrocellulose membrane using the NorthernMax-Gly Kit (Invitrogen cat# AM1946). The P32- labeled DNA probes were made by randomly primed DNA synthesis. Ty1 PvuII-SnaBI fragment of Ty1-H3 was used as a P32-labeled DNA probe and was prepared as described above. The control PYK1 probe was prepared by PCR using two primers PYK1-F1 (GTTGTTGCTGGTTCTGACTTGAGAA) and PYK1-R1 (TCAAGATACCGAATTCCTTAGCC). The intensity of bands on Southern blots corresponding to Ty RNA fragments was analyzed with ImageQuant TL and normalized to the PYK1 RNA signal.
Analysis of Ty retrotransposition rates
The rate of retrotransposition was estimated in strains carrying the Ty1-270his3-AI reporter15. Wild-type and mutant cells were streaked for single colonies on YEPD plates. Individual colonies were used to inoculate 5 ml YEPD cultures that were incubated at 24 °C, diluted, and grown to 1×10⁷ cells/ml before plating 20-30 cells per plate on YEPD. Plates were incubated at 24 °C for 6 days. For each strain tested, 10-20 individual colonies were diluted in water and spread on synthetic complete medium lacking histidine (SC-His) and incubated at 24 °C for 3-4 days. His+ colonies were then counted. To perform statistical comparisons of spontaneous transposition rates between genotypes we utilized the Drake estimator as described previously35. The bootstrap resampling approach was used to determine p values.
Bioinformatic analysis of genomic features related to insertion sites
Positions of confirmed origins of replication (ARSes) were downloaded from the OriDB database (http://cerevisiae.oridb.org/)36. R-loop reference positions were collected from a published source37. Hi-C interaction maps were collected from the GEO database (with accession numbers GSM1905067 and GSM1905068)13. All other genome features were acquired from the SGD database (https://downloads.yeastgenome.org/). Random control insertions were created based on the size and distribution of real insertions. Specifically, for each real insertion a corresponding control insertion of the same size with a random location and on the same chromosome was generated. For analysis of hotspots (multiple insertion donor DNAs within a region of 3 kb or shorter), a random hotspot with the same size, distance and on the same chromosome was generated. The randomization was repeated 1000 times and the mean value for each type of analysis was taken for comparison with observed inserted DNA. All values for random control insertions are the average of 1000 different sets of random insertion controls. Overlapped events between insertions and genome features are defined as having at least 1 bp overlap. For distance analysis, each insertion’s distance is calculated by the edge distance between the insertion and its closest genome feature. If an insertion is overlapped with a genomic feature, then its distance is defined as 1 bp. For analysis presented in Fig. 4a-c, all insertions coming from Ty retrotransposons, rDNA or 2μ plasmid are excluded. P values in bar plots were calculated by an empirical cumulative distribution function based on 1,000 times bootstrapping (Fig. 4a-c). P values in box plots were determined based on one tail Wilcoxon test (Fig. 4a-c). Correlation coefficients were calculated based on the Spearman method. For barplots (Fig. 4a-b), error bars represent the standard deviation. For box plots presented in Fig. 4a-c,e, the center line represents the median value, the bottom and top of the box are upper and lower quartiles, the upper whisker is located at the minimum value of maximum value and Q3 + 1.5 x interquartile range (IQR), and the lower whisker is located at the maximum of minimum value and Q1-1.5 x IQR. For Hi-C interaction map analysis (Extended Data Fig. 2), insertions of Ty retrotransposons, telomeres, rDNA and 2μ plasmid are excluded from analysis. A two-tail Wilcoxon test was used to determine whether the frequency of interaction between the HO cleavage site and donor DNA sites is significantly different when compared to the interaction between the HO cleavage site and randomly selected loci. The randomization was repeated 1000 times and the median p value was used to determine the significance of the difference.
Extended Data
Extended Data Figure 1. Insertion analysis at MATa, URA3 and LYS2 loci.
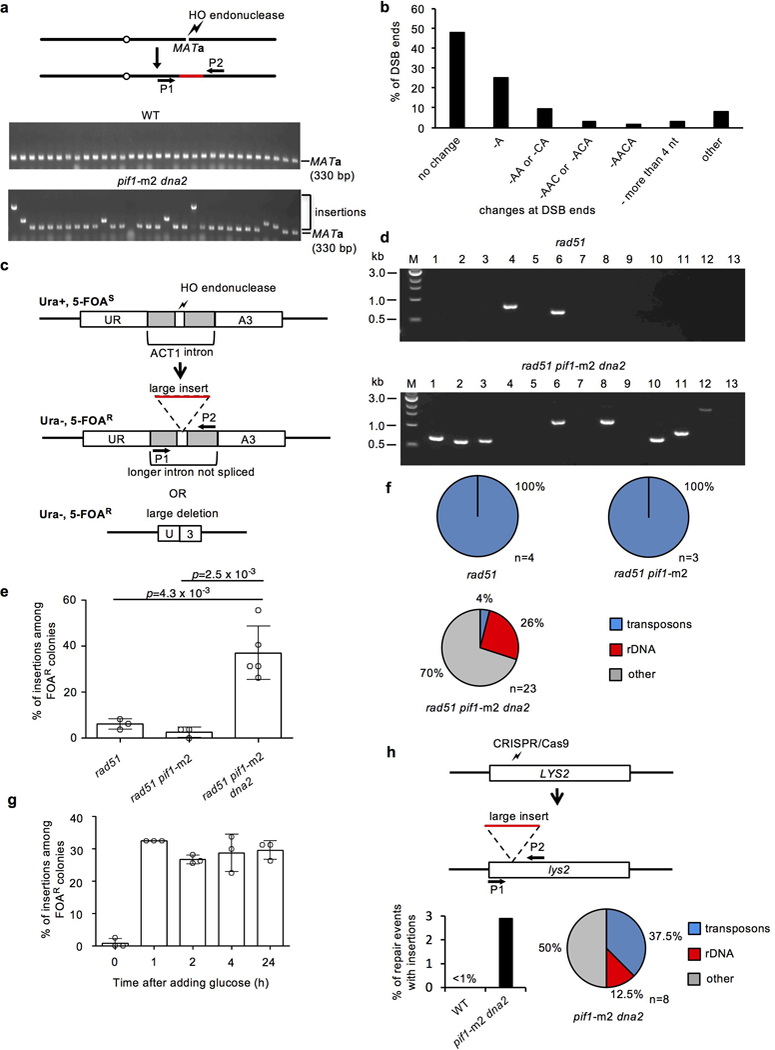
a, Experimental system to study insertions at DSBs and PCR analysis of MATa locus after DSB repair in wild-type and pif1-m2 dna2 cells. Analysis was repeated over 10 times (for gel source data, see Supplementary Data Figure 1). b, Analysis of DSB ends change among events carrying insertion. c, Schematic showing experimental system. HO break is generated at ACT1 intron integrated in URA3 gene. Insertion of a DNA fragment or large deletion interferes with splicing and generates uracil auxotrophs. d, Analysis of insertions by PCR and agarose gel electrophoresis at URA3. The experiment was repeated over three times with similar results. For gel source data, see Supplementary Data Figure 1.e, Percentage of insertions among 5-FOA resistant colonies. Plotted are the mean values ± s.d., n=3 and represents number of independent experiments, two tailed t-test was used to determine the p values. f, Analysis of origin of DNA inserted at DSB at URA3 locus in indicated mutants, n represents number of independent insertions from indicated mutants. g, Percentage of insertions among 5-FOA resistant colonies after transient induction of HO break in rad51pif1-m2 dna2. Plotted are the mean values ± s.d., n=3 and represents number of independent experiments. h, Schematic showing experimental system to follow insertions at CRISPR/Cas9-induced DSB within LYS2 locus. Below, percentage of insertions among cells maintaining CRISPR/Cas9 and analysis of origin of DNA inserted at LYS2; n represents number of independent insertions sequenced in pif1-m2 dna2 cells. The experiment was repeated four times with similar results.
Extended Data Figure 2. Origin of inserted DNA at DSBs.
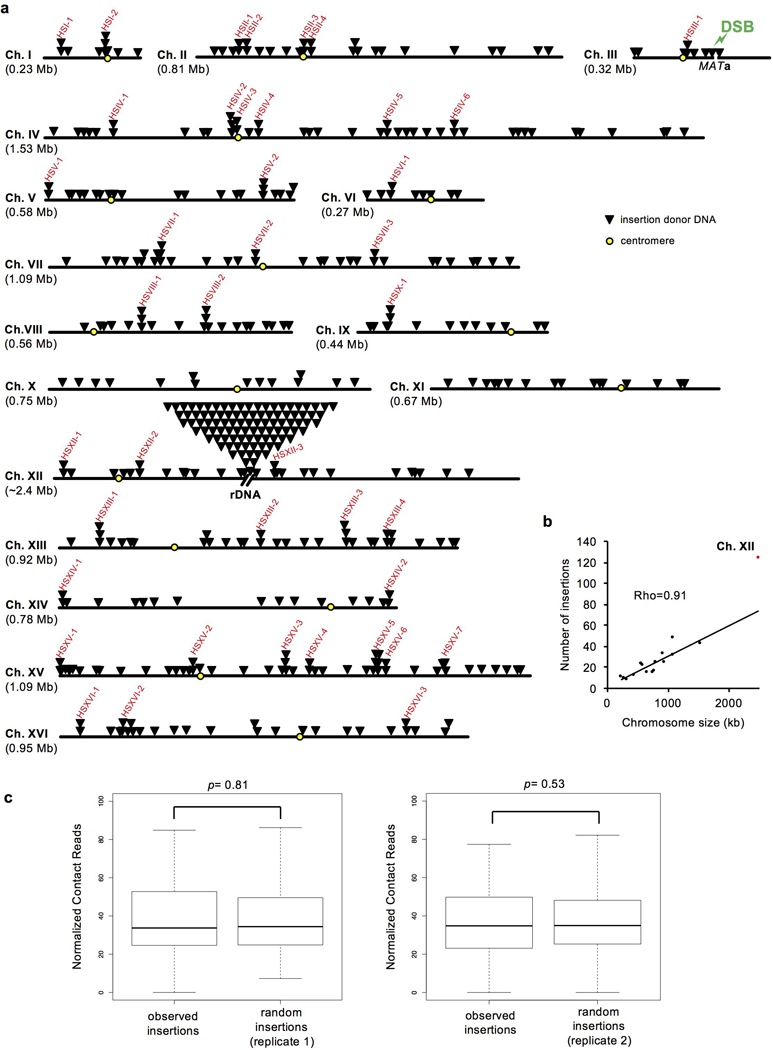
a, Each triangle indicates single insertion donor DNA and hotspots of insertion donor DNA are marked in red. b, Scatter plot of chromosome size and insertion number, n=468 and represents the number of independent insertions. Correlation coefficients were calculated based on the Spearman method. c, Contact analysis between MAT locus on chromosome III and loci from which DNA was inserted. For each replicate 1000 random sets of DNAs (equal size and number) are compared to experimental inserted DNA. P values are determined by two-tail Wilcoxon test; n=358 and represents the number of independent inserted DNAs used for contact analysis. In the box plots, centre line is median; boxes, first and third quartiles; whiskers, the upper whisker located at the minimum value of maximum value and Q3 + 1.5 x interquartile range, the lower whisker located at the maximum of minimum value and Q1-1.5 x interquartile range.
Extended Data Figure 3. Analysis of transposon cDNA stability and Ty1 expression. a,
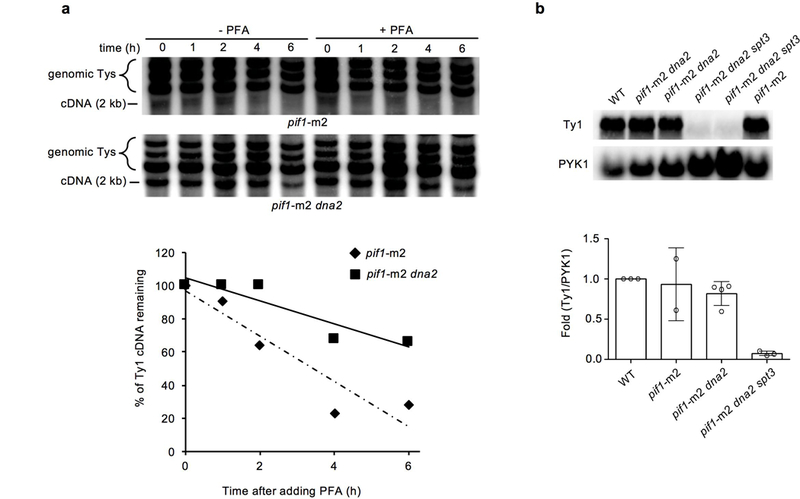
a, Analysis of Ty1 cDNA stability. The experiment was repeated four times with similar results. b, Analysis of Ty1 expression and its quantification. Plotted values are the mean values ± s.d. from three independent experiments. For gel source data, see Supplementary Data Figure 1.
Extended Data Figure 4. Hotspots of origin of inserted DNAs.
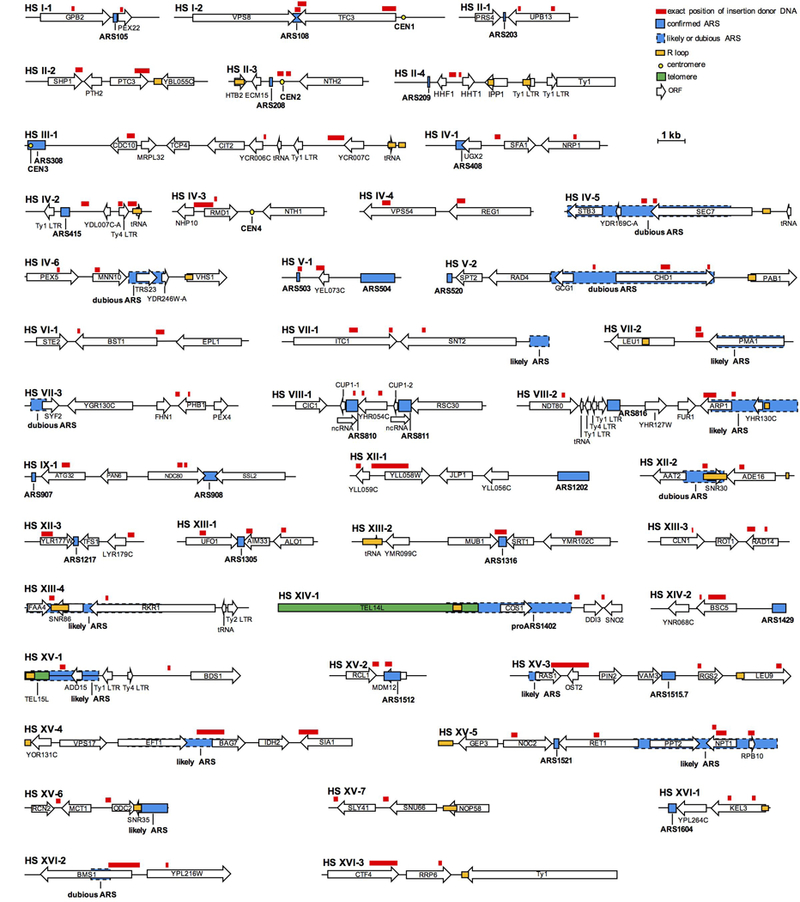
Position of DNAs inserted within DSBs is indicated in red. Blue boxes denote origins of replication, yellow circles denote centromeres, green boxes denote telomeres and open boxes denote genes. Hotspots were defined as loci that are the source of at least two inserted DNA fragments separated from each other by no more than 3 kb.
Extended Data Figure 5. Genetic interactions between Dna2 and Rad52, Yen1 and Mus81.
a, Overall frequency and analysis of origin of DNA inserted at DSB in indicated mutants; n represents the number of independent insertions analyzed by sequencing. b, Origin of insertions in rad52Δ mutant cells. c, Active Yen1 suppresses inviability of dna2Δ cells. Tetrad dissection of PIF1/pif1-m2 YEN1/yen1ON DNA2/dna2Δ triple heterozygotes is shown. The experiment was repeated twice. d, Analysis of complex insertions (2 or more DNA fragments inserted at DSB) in Dna2-deficient mutants. Sample size defined as the number of independent insertions analyzed for each mutant is presented in Extended Data Table 1. χ2 test is used to determine the p value. e, DNA damage sensitivity analysis (spot assay, 5x dilution) in indicated mutants. The experiment was repeated twice.
Extended Data Figure 6. Model of large insertions at DSBs in Dna2-deficient cells.
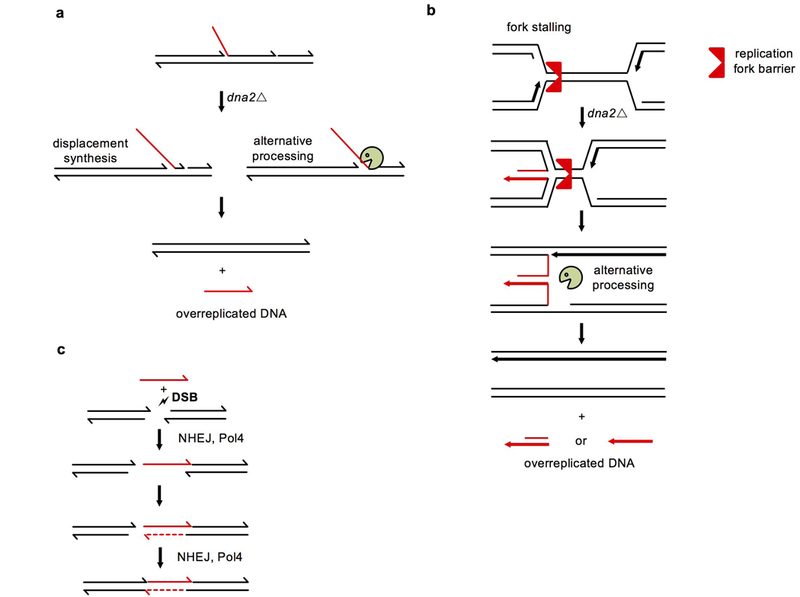
a, Unprocessed 5’ flaps are processed by alternative nuclease or displaced by synthesis leading to release of overreplicated DNA fragments. b, Stalled and reversed forks when approached by a converging fork leave overreplicated DNA that can be released by processing by other nucleases. c, ssDNA can be inserted into DSBs by NHEJ and Pol4.
Extended Data Figure 7. Analysis of insertions of transformed DNA at DSBs and analysis of free short DNA in cells.
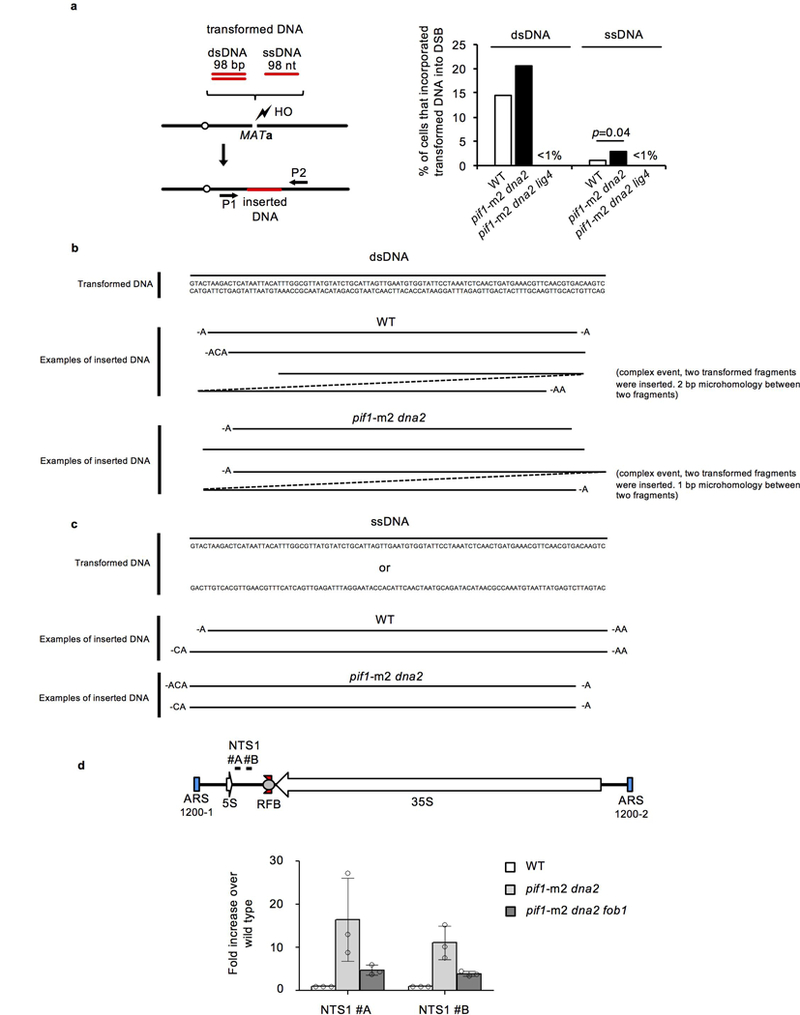
a, Analysis of insertions of transformed DNA at DSBs in wild-type and indicated mutant cells. Schematic of the experiment is shown on the left and percentage of cells carrying insertion is shown on the right. χ2 test was used to determine the p values; n=160 for dsDNA and n=320 for ssDNA and represents the number of colonies tested for the presence of insertion. b-c, Analysis of inserted DNA after transformation of dsDNA (b) and ssDNA (c). d, Quantitative PCR analysis of short free DNA in indicated mutants. Plotted are the mean values ± s.d., n = 3 and represents the number of independent experiments. Position of the primers used is shown at the top and fold change in DNA amount is shown on the bottom.
Extended Data Table 1.
Analysis of NHEJ efficiency and insertion frequency at DSBs at (a) MATa locus, (b) URA3 locus, and (c) LYS2 locus.
| Genotype | Number of insertions at MATa (%)* |
NHEJ efficiency** |
# of sequenced events |
# of inserts *** |
# of complex events*** |
transposon insertions (%) *** |
rDNA fragment insertions (%) *** |
other nuclear genome insertions (%)*** |
||||||
|---|---|---|---|---|---|---|---|---|---|---|---|---|---|---|
| WT | 0% (0/644) | 0.104%±0.058% | N/A | |||||||||||
| pifl-ml | 0% (0/160) | 0.061%±0.013% | N/A | |||||||||||
| pifl-m2 dna2 | 8.2% (148/1794) | 0.105%±0.029% | 142 | 161 | 18 | 8.1% | 14.9% | 77.0% | ||||||
| pifl-ml dna2R\153Q | 0% (0/160) | 0.116%±0.099% | N/A | |||||||||||
| pifl-m2 dna2’E675A | 15.6% (50/320) | 0.123%±0.059% | 3 | |||||||||||
| rad51 pifl-ml dna2 | 9.4% (30/320) | 0.096%±0.020% | 13 | |||||||||||
| rad51 | 0% (0/320) | 0.079%±0.001% | N/A | |||||||||||
| rad52 pifl -ml dna2 | 36.1% (52/144) | 0.228%±0.091% | 33 | 43 | 8 | 4.7% | 25.6% | 69.7% | ||||||
| rad52 | 0.9% (3/320) | 0.167%±0.037% | 3 | |||||||||||
| rad27 | 0% (0/320) | 0.193%±0.165% | N/A | |||||||||||
| yku70 pifl-ml dna2 | 0% (0/160) | 0.011%±0.009% | N/A | |||||||||||
| lig4 pifl -m2 dna2 | 0.2% (1/480) | 0.007%±0.004% | 1 | |||||||||||
| pol4 pifl -m2 dna.2 | 0% (0/160) | 0.014%±0.005% | N/A | |||||||||||
| spt3 pifl -ml dna2 | 6.3% (47/746) | 0.117%±0.055% | 47 | 55 | 7 | 3.6% | 18.2% | 78.2% | ||||||
| fobl pifl -m2 dna2 | 6.5% (107/1646) | 0.077%±0.040% | 105 | 118 | 11 | 9.3% | 16.1% | 74.6% | ||||||
| pifl pol32 dna2 | 5.5% (29/527) | 0.075%±0.023% | 29 | 33 | 4 | 9.1% | 18.2% | 72.7% | ||||||
| slxl pifl-ml dna2 | 8.6% (26/304) | 0.069%±0.009% | 5 | |||||||||||
| mus81 pifl-ml dna2 | 3.6% (16/448) | 0.081%±0.013% | 10 | |||||||||||
| mus81 pifl-ml dna2E615A | 5.0% (8/160) | N/D | N/D | |||||||||||
| sgsl | 0% (0/240) | 0.088%±0.012% | N/A | |||||||||||
| exol | 0% (0/240) | 0.104%±0.023% | N/A | |||||||||||
| yenlON | 0% (0/160) | 0.044%±0.005% | N/A | |||||||||||
| yenlCN dna2 | 13.9% (30/216) | 0.122%±0.043% | 30 | 45 | 11 | 13.3% | 6.7% | 80.0% | ||||||
| yenlONpifl -m2 dna2 | 12.0% (24/200) | 0.075%±0.015% | 20 | |||||||||||
| pifl dna2 + HU | 23.0% (70/304) | 0.057%±0.026% | N/D | |||||||||||
| Genotype | Number of insertions at URA3 among 5- FOA resistant colonies (%) |
# of sequenced events |
# of inserts |
# of complex events |
transposon
insertions (%) |
rDNA fragment
insertions (%) |
other nuclear genome
insertions (%) |
||||||||
|---|---|---|---|---|---|---|---|---|---|---|---|---|---|---|---|
| rad51 | 3.8% (5/133) | 4 | 4 | 0 | 100% | 0% | 0% | ||||||||
| rad51 pifl-ml | 2.6% (4/154) | 3 | 3 | 0 | 100% | 0% | 0% | ||||||||
| rad51 pifl-val dna2 | 32.5% (96/295) | 21 | 23 | 2 | 4.3% | 26.1% | 69.6% | ||||||||
| Genotype | Number of insertions at LYS2 (%) |
NHEJ efficiency** |
# of sequenced events |
# of inserts |
# of complex events |
transposon insertions (%) |
rDNA fragment insertions (%) |
other nuclear genome insertions (%) |
||||||
|---|---|---|---|---|---|---|---|---|---|---|---|---|---|---|
| WT | 0% (0/240) | 0.828%±0.043% | N/A | |||||||||||
| pifl-ml dna2 | 2.9% (7/240) | 0.288%±0.058% | 7 | 8 | 1 | 37.5% | 12.5% | 50% | ||||||
Number of independent insertions and number of colonies tested for presence of insertion are shown.
Presented are the mean values ± s.d., n≥3 and represents the number of independent experiments.
The number is shown only for mutants where at least 25 cases were sequenced
Extended Data Table 2.
Sequence analysis of DSB repair survivors in wild type and indicated mutants that do not carry a large insertion.
| Mutation | WT | pifl-m2 dna2 | rad27 |
|---|---|---|---|
| CGC AACA(+C A)GT A | 13.3 (6/45) | 26.6 (17/64) | 17.1 (7/41) |
| CGC(+A)AACAGTA | 4.4 (2/45) | 1.6(1/64) | 4.9 (2/41) |
| CGC AACA(+AC A)GT A | 2.2 (1/45) | 0 | 2.4(1/41) |
| CGCAA(+AA)CAGTA | 0 | 3.1 (2/64) | 7.3 (3/41) |
| CGC AAC(+C)AGT A | 0 | 0 | 2.4 (1/41) |
| CGCA(+C)ACAGTA | 0 | 0 | 2.4(1/41) |
| CGCA(-ACA)GTA | 44.4 (20/45) | 26.6 (17/64) | 17.1 (7/41) |
| CGCAA(-CA)GTA | 13.3 (6/45) | 14.1 (9/64) | 22.0(9/41) |
| CGC(-A)ACAGTA | 6.7 (3/45) | 10.9 (7/64) | 19.5 (8/41) |
| CGCAACAG(-T)A | 2.2 (1/45) | 0 | 0 |
| C(-GCA)ACAGTA | 2.2 (1/45) | 0 | 0 |
| CGCAAC(-AGT)A | 2.2 (1/45) | 0 | 0 |
| CGCAAC(-A)GTA | 0 | 1.6(1/64) | 0 |
| CGC(-AA)CAGTA | 0 | 1.6(1/64) | 0 |
| CGCAA(-CAG)TA | 0 | 3.1 (2/64) | 0 |
| CGCAA(-C)AGTA | 0 | 0 | 2.4 (1/41) |
| CGCAA(-CAGT+A)A | 2.2 (1/45) | 0 | 0 |
| CGCAA(-CAG+A)TA | 2.2 (1/45) | 0 | 0 |
| CTCAACAGTA | 0 | 1.6(1/64) | 0 |
| GGCAACAGT A | 0 | 1.6(1/64) | 0 |
| > 4 bp deletion | 4.4 (2/45) | 7.8 (5/64) | 2.4(1/41) |
Supplementary Material
Acknowledgements
We thank A. Gabriel, D.J. Garfinkel, J. Haber, M.G. Blanco and F. Storici for the gifts of strains and plasmids, and J. Haber and P. Hastings for critical reading of the manuscript. This work was funded by grants from the U.S. National Institutes of Health (GM080600 and GM125650 to G.I., GM125632 and HL133254 to K.C.) and the Cancer Prevention Research Institute of Texas (RP140456 to G.I. and G.P., RP150611 to K.C.).
Footnotes
Competing interests The authors declare no competing interests.
Additional information
Reprints and permissions information is available at http://www.nature.com/reprints
Data Availability
The authors declare that all data supporting the findings of this study are available within the manuscript. Sequences of all inserted DNA and sequences of the junctions analyzed are provided within Supplemental Table 1. Source gel images are presented in Supplemental Figure 1.
Code availability
All codes used in this project are deposited at https://github.com/fagisX/FAID.
References
- 1.Moore JK & Haber JE Capture of retrotransposon DNA at the sites of chromosomal double-strand breaks. Nature 383, 644–646 (1996). [DOI] [PubMed] [Google Scholar]
- 2.Teng SC, Kim B & Gabriel A Retrotransposon reverse-transcriptase-mediated repair of chromosomal breaks. Nature 383, 641–644 (1996). [DOI] [PubMed] [Google Scholar]
- 3.Yu X & Gabriel A Patching broken chromosomes with extranuclear cellular DNA. Mol Cell 4, 873–881 (1999). [DOI] [PubMed] [Google Scholar]
- 4.Morrish TA et al. DNA repair mediated by endonuclease-independent LINE-1 retrotransposition. Nat Genet 31, 159–165 (2002). [DOI] [PubMed] [Google Scholar]
- 5.Ricchetti M, Fairhead C & Dujon B Mitochondrial DNA repairs double-strand breaks in yeast chromosomes. Nature 402, 96–100 (1999). [DOI] [PubMed] [Google Scholar]
- 6.Onozawa M et al. Repair of DNA double-strand breaks by templated nucleotide sequence insertions derived from distant regions of the genome. Proc Natl Acad Sci U S A 111, 7729–7734 (2014). [DOI] [PMC free article] [PubMed] [Google Scholar]
- 7.Li Y et al. Patterns of structural variation in human cancer. BioRxiv doi: 10.1101/181339 (2017). [DOI] [Google Scholar]
- 8.Ju YS et al. Frequent somatic transfer of mitochondrial DNA into the nuclear genome of human cancer cells. Genome Res 25, 814–824 (2015). [DOI] [PMC free article] [PubMed] [Google Scholar]
- 9.Henssen AG et al. PGBD5 promotes site-specific oncogenic mutations in human tumors. Nat Genet 49, 1005–1014 (2017). [DOI] [PMC free article] [PubMed] [Google Scholar]
- 10.Pieper K et al. Public antibodies to malaria antigens generated by two LAIR1 insertion modalities. Nature 548, 597–601 (2017). [DOI] [PMC free article] [PubMed] [Google Scholar]
- 11.Moore JK & Haber JE Cell cycle and genetic requirements of two pathways of nonhomologous end-joining repair of double-strand breaks in Saccharomyces cerevisiae. Mol Cell Biol 16, 2164–2173 (1996). [DOI] [PMC free article] [PubMed] [Google Scholar]
- 12.Budd ME, Reis CC, Smith S, Myung K & Campbell JL Evidence suggesting that Pif1 helicase functions in DNA replication with the Dna2 helicase/nuclease and DNA polymerase delta. Mol Cell Biol 26, 2490–2500 (2006). [DOI] [PMC free article] [PubMed] [Google Scholar]
- 13.Belton JM et al. The Conformation of Yeast Chromosome III Is Mating Type Dependent and Controlled by the Recombination Enhancer. Cell Reports 13, 1855–1867 (2015). [DOI] [PMC free article] [PubMed] [Google Scholar]
- 14.Winston F, Durbin KJ & Fink GR The SPT3 gene is required for normal transcription of Ty elements in S. cerevisiae. Cell 39, 675–682 (1984). [DOI] [PubMed] [Google Scholar]
- 15.Sundararajan A, Lee BS & Garfinkel DJ The Rad27 (Fen-1) nuclease inhibits Ty1 mobility in Saccharomyces cerevisiae. Genetics 163, 55–67 (2003). [DOI] [PMC free article] [PubMed] [Google Scholar]
- 16.Weitao T, Budd M, Hoopes LL & Campbell JL Dna2 helicase/nuclease causes replicative fork stalling and double-strand breaks in the ribosomal DNA of Saccharomyces cerevisiae. J Biol Chem 278, 22513–22522 (2003). [DOI] [PubMed] [Google Scholar]
- 17.Greenfeder SA & Newlon CS Replication forks pause at yeast centromeres. Mol Cell Biol 12, 4056–4066 (1992). [DOI] [PMC free article] [PubMed] [Google Scholar]
- 18.Makovets S, Herskowitz I & Blackburn EH Anatomy and dynamics of DNA replication fork movement in yeast telomeric regions. Mol Cell Biol 24, 4019–4031 (2004). [DOI] [PMC free article] [PubMed] [Google Scholar]
- 19.Gan W et al. R-loop-mediated genomic instability is caused by impairment of replication fork progression. Genes Dev 25, 2041–2056 (2011). [DOI] [PMC free article] [PubMed] [Google Scholar]
- 20.Markiewicz-Potoczny M, Lisby M & Lydall D A Critical Role for Dna2 at Unwound Telomeres. Genetics 209, 129–141 (2018). [DOI] [PMC free article] [PubMed] [Google Scholar]
- 21.Li Z et al. hDNA2 nuclease/helicase promotes centromeric DNA replication and genome stability. EMBO J 37 (2018). [DOI] [PMC free article] [PubMed] [Google Scholar]
- 22.Hu J et al. The intra-S phase checkpoint targets Dna2 to prevent stalled replication forks from reversing. Cell 149, 1221–1232 (2012). [DOI] [PubMed] [Google Scholar]
- 23.Thangavel S et al. DNA2 drives processing and restart of reversed replication forks in human cells. J Cell Biol 208, 545–562 (2015). [DOI] [PMC free article] [PubMed] [Google Scholar]
- 24.Liu B, Hu J, Wang J & Kong D Direct Visualization of RNA-DNA Primer Removal from Okazaki Fragments Provides Support for Flap Cleavage and Exonucleolytic Pathways in Eukaryotic Cells. J Biol Chem 292, 4777–4788 (2017). [DOI] [PMC free article] [PubMed] [Google Scholar]
- 25.Pike JE, Burgers PM, Campbell JL & Bambara RA Pif1 helicase lengthens some Okazaki fragment flaps necessitating Dna2 nuclease/helicase action in the two-nuclease processing pathway. J Biol Chem 284, 25170–25180 (2009). [DOI] [PMC free article] [PubMed] [Google Scholar]
- 26.Stith CM, Sterling J, Resnick MA, Gordenin DA & Burgers PM Flexibility of eukaryotic Okazaki fragment maturation through regulated strand displacement synthesis. J Biol Chem 283, 34129–34140 (2008). [DOI] [PMC free article] [PubMed] [Google Scholar]
- 27.Lee M et al. Rad52/Rad59-dependent recombination as a means to rectify faulty Okazaki fragment processing. J Biol Chem 289, 15064–15079 (2014). [DOI] [PMC free article] [PubMed] [Google Scholar]
- 28.Blanco MG, Matos J & West SC Dual control of Yen1 nuclease activity and cellular localization by Cdk and Cdc14 prevents genome instability. Mol Cell 54, 94–106 (2014). [DOI] [PMC free article] [PubMed] [Google Scholar]
- 29.Olmezer G et al. Replication intermediates that escape Dna2 activity are processed by Holliday junction resolvase Yen1. Nature Communications 7, 13157 (2016). [DOI] [PMC free article] [PubMed] [Google Scholar]
- 30.Michel AH et al. Functional mapping of yeast genomes by saturated transposition. Elife 6, doi: 10.7554/eLife.23570 (2017). [DOI] [PMC free article] [PubMed] [Google Scholar]
Additional References
- 31.Storici F & Resnick MA The delitto perfetto approach to in vivo site-directed mutagenesis and chromosome rearrangements with synthetic oligonucleotides in yeast. Methods Enzymol 409, 329–345 (2006). [DOI] [PubMed] [Google Scholar]
- 32.Lemos BR et al. CRISPR/Cas9 cleavages in budding yeast reveal templated insertions and strand-specific insertion/deletion profiles. Proc Natl Acad Sci U S A 115, E2040–E2047 (2018). [DOI] [PMC free article] [PubMed] [Google Scholar]
- 33.Church GM & Gilbert W Genomic sequencing. Proc Natl Acad Sci U S A 81, 1991–1995 (1984). [DOI] [PMC free article] [PubMed] [Google Scholar]
- 34.Lee BS, Bi L, Garfinkel DJ & Bailis AM Nucleotide excision repair/TFIIH helicases RAD3 and SSL2 inhibit short-sequence recombination and Ty1 retrotransposition by similar mechanisms. Mol Cell Biol 20, 2436–2445 (2000). [DOI] [PMC free article] [PubMed] [Google Scholar]
- 35.Mayle R et al. DNA REPAIR. Mus81 and converging forks limit the mutagenicity of replication fork breakage. Science 349, 742–747 (2015). [DOI] [PMC free article] [PubMed] [Google Scholar]
- 36.Siow CC, Nieduszynska SR, Muller CA & Nieduszynski CA OriDB, the DNA replication origin database updated and extended. Nucleic Acids Res 40, D682–686 (2012). [DOI] [PMC free article] [PubMed] [Google Scholar]
- 37.Wahba L, Costantino L, Tan FJ, Zimmer A & Koshland D S1-DRIP-seq identifies high expression and polyA tracts as major contributors to R-loop formation. Genes Dev 30, 1327–1338 (2016). [DOI] [PMC free article] [PubMed] [Google Scholar]
Associated Data
This section collects any data citations, data availability statements, or supplementary materials included in this article.