Abstract
A major challenge to experimental studies and therapeutic uses of hematopoietic stem cells (HSC) is the limited options for analytical tools that can reliably resolve functional differences in heterogeneous HSC subpopulations at the single cell level. Currently available methods require the use of external labels and/or separate clonogenic and transplantation assays to identify bona fide stem cells, necessitating the harvest of bulk cell populations and long incubation times that obscure how individual HSCs dynamically respond to exogenous and endogenous stimuli. In this study, we employ Raman spectroscopy to noninvasively resolve the dynamics of individual differentiating hematopoietic progenitor cells during the course of neutrophilic differentiation. We collected Raman peaks of individual cells daily over the course of 14-day neutrophilic differentiation. Principal component analysis (PCA) of the Raman peaks revealed spectral differences between individual cells during differentiation that were strongly correlated with changes in the nucleus shape and surface antigen expression, the primary traditional means of monitoring neutrophilic differentiation. Additionally, our results were consistently reproducible in independent rounds of neutrophilic differentiation, as demonstrated by our partial least-squares discriminant analysis (PLS-DA) of the Raman spectral information that predicted the degree of neutrophilic differentiation with high sensitivity and specificity. Our findings highlight the utility and reliability of Raman spectroscopy as a robust molecular imaging tool to monitor the kinetics of HSC differentiation patterns.
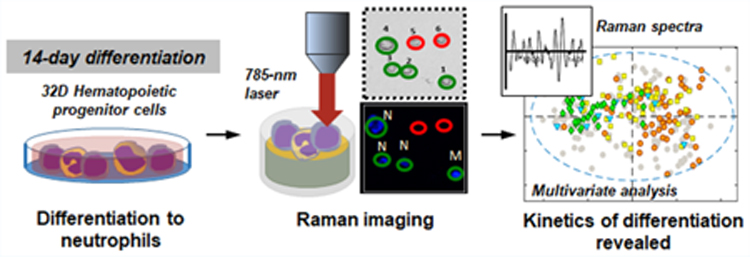
Graphical Abstract
INTRODUCTION
Hematopoietic stem cells (HSC) are adult stem cells that reside primarily in the bone marrow. They are responsible for hematopoiesis, a process that replenishes trillions of blood and immune cells daily.1–5 HSCs have high therapeutic potential, and have been utilized clinically in bone marrow transplantations to reconstitute the compromised marrow of patients with fatal bone marrow-derived diseases (e.g., leukemia, lymphoma, and myeloma).3,4 Increasingly, bioengineering applications of HSCs and their progeny are being investigated to take advantage of the therapeutic benefits of HSCs.3,4,6–12 While traditional biomedical research has identified a number of endo- and exogenous biochemical and extracellular matrix (ECM) factors as key players of HSC maintenance and regulation in several proposed HSC niches,1–5,13–16 HSC fate decision-making events that lead to HSC quiescence, self-renewal, proliferation, differentiation, mobilization, or homing are complex processes that are tightly regulated, and current bioanalytical tools such as fluorescent labeling, clonogenic, and transplantations assays fail to clearly resolve functional changes that occur to individual hematopoietic stem and progenitor cells (HSPC) at each decision-making event.3,4,17–21 Significant levels of heterogeneity reported to be present in HSPC populations further complicate data analysis and accurate data interpretations.22,23 The ability to dynamically monitor individual cells within a population in real time and in situ would be transformative toward resolving this cellular heterogeneity and could be used to improve the design of ex vivo HSC expansion strategies.
Molecular information-based screening tools provide an alternative to the conventional methods of HSC analysis by offering marker-free, in situ analysis of single cells.3,4,10,24–27 Molecular tools provide biomolecular fingerprints of individual cells with high sensitivity and specificity, and allow monitoring of the individual cells over long periods of time.27 We previously showed that time-of-flight secondary ion mass spectrometry (TOF-SIMS) and Raman spectroscopy could successfully identify primary hematopoietic cells along the lymphoid lineage (HSCs, common lymphoid progenitors (CLPs), B cells; TOF-SIMS28) and between closely related primitive HSCs (long-term HSC vs short-term HSC vs mature hematopoietic cells; Raman spectroscopy).29 Multivariate statistical analyses of the molecular information gathered from individual cells could be employed to reveal significant biomolecular differences between cell types that allowed successful discrimination between cells.29 Raman spectroscopy is particularly attractive with regards to the potential for time-lapse analysis of HSPC activity as it allows noninvasive analysis of live cells in situ, in real time.24,27,30 Raman spectroscopy takes advantage of the inelastic Raman scattering of intra-cellular elements (e.g., nucleic acids, proteins, lipids, and other biomolecules).24 Therefore, chemical compositional information on individual, live cells can be sampled repeatedly in a label-free manner, while analyzed cells can be preserved for subsequent analyses or extended culture.30 Raman spectroscopy has been increasingly used to analyze stem cells (e.g., ESCs, MSCs, NSCs),27,31,32 cell lines and primary cells,24 tissues, and tissue engineering constructs27,33 for biomedical applications. Raman spectroscopy has also proved to be useful for the discrimination of cells of hematopoietic lineage. In addition to our own work with fixed HSPCs,29 recent efforts have begun to compare mature and pathological cells of lymphoid and myeloid lineages (e.g., T cells, B cells, NK cells, dendritic cells; leukemia and multiple myeloma samples).10,34–38 While the majority of studies were performed on fixed samples, others have also observed no detrimental effects of Raman spectral acquisition on morphology, proliferation, or pluripotency of living cells,39 suggesting that Raman spectroscopy is a noninvasive analytical tool that could discern heterogeneous cell mixtures at single cell resolution.
In this study, we employ Raman spectroscopy to resolve the kinetics of neutrophilic differentiation of the 32D hematopoietic progenitor cell line. We used this cell line as its kinetics of differentiation in response to exogenous biomolecules are well-defined. Further, there exist robust strategies to quantify differentiation via nuclear morphology and surface antigen expression.40 We collected in situ Raman peaks of individual cells daily during the course of neutrophilic differentiation induced by the removal of interleukin-3 (IL-3) and the addition of granulocyte colony-stimulating factor (G-CSF). Principal component analysis (PCA) of the Raman peaks was used to determine spectral differences between cells at different stages of differentiation, and to examine correlations with changes in the nuclear shape and surface antigen expression. We performed repeated rounds of differentiation to evaluate the reproducibility of Raman-based classification. We aim to demonstrate a Raman approach to monitor the kinetics of neutrophilic differentiation with high sensitivity and specificity.
RESULTS AND DISCUSSION
Traditional Methods Confirm Neutrophilic Differentiation of 32D Hematopoietic Progenitor Cells.
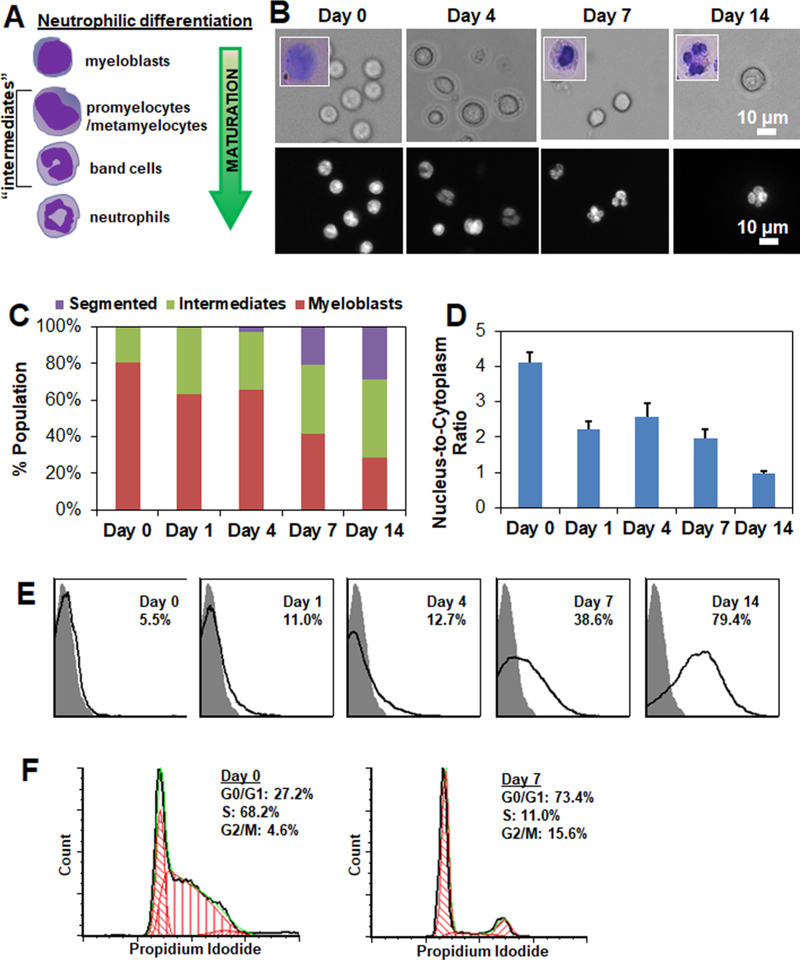
Spontaneous differentiation of the 32D Clone 3 hematopoietic progenitor cell line (ATCC CRL-11346) into granulocytic neutrophils, or simply neutrophils, was induced by removing IL-3 and introducing G-CSF (25 ng/mL) to the culture media.41,42 Lineage specification was confirmed via analysis at days 0, 1, 4, 7, and 14 post-induction via the presence of segmented nuclei and Gr1+ expression. 32D cells exhibited characteristic changes in their nucleus shape (Figure 1A,B). As expected, subpopulations of myeloblasts with rounded nuclei decreased while subpopulations of neutrophils with segmented nuclei increased during differentiation (Figure 1C), also reflected in decreasing nucleus-to-cytoplasmic ratios over culture time (Figure 1D). A significant portion of intermediate cells (promyelocytes, metamyelocytes, band cells) were observed on all days post-induction (Figure 1B,C). During differentiation, expression of Gr-1 granulocytic cell surface antigen significantly increased (Figure 1E), as measured by flow cytometry following staining of the cells against the Gr-1 antibody. Further, cell cycle analysis showed while a significant portion of the cells were replicating (S phase) pre-induction, growth arrest was observed upon induction, with most cells found in the resting phase (G0/G1 phase) (Figure 1F). These findings were consistent with previous reports,42,43 and highlight that neutrophilic differentiation is a stochastic process where cells are initially undifferentiated and end as differentiated, but that in between cell subsets exhibit significantly different differentiation kinetics and motivate our efforts to develop Raman tools to assess this populational heterogeneity.
Figure 1.
Tracing neutrophilic differentiation of 32D hematopoietic progenitor cells. (A) Neutrophilic differentiation of 32D cells is accompanied by characteristic changes in their nuclear shape. Undifferentiated 32D cells display large circular nuclei. During neutrophilic differentiation, 32D cells transition from myeloblasts to promyelocytes, metamyelocytes, band cells, and finally mature neutrophils with a segmented nucleus. (B) Representative bright field (top panel; inset: Wright Giemsa-stained cells) and fluorescent (bottom panel; Hoechst 33342) labeled 32D cells during the course of 14-day neutrophilic differentiation. Day 0 cells refer to undifferentiated cells before inducing differentiation. Scale bar: 10 μm. (C) 32D cells were classified as myeloblasts, intermediates (promyelocytes, metamyelocytes, band cells), or segmented neutrophils during the course of differentiation based on Hoechst 33342-stained nuclear shape. N = 7–93. (D) Change in nucleus-to-cytoplasm ratiobased on brightfield and fluorescent images. N = 5–40. (E) Gr-1 expression of 32D cells over the course of neutrophilic differentiation as measured by flow cytometry. Gray peak represents isotype control. Peaks (black line) represent histograms of the analyzed cells, and the percentages of Gr-1+ cells in the cell populations increased from 5.5% (Day 0) to 38.6% (Day 7) and 79.4% (Day 14) post-inducing differentiation. (F) Cell cycle status of Day 0 (undifferentiated) and Day 7 cells were quantified with Multicycle DNA analysis available in FCS Express software.
Raman Spectroscopy Reveals Changes in 32D Cell Biomolecular Composition during Neutrophilic Differentiation.
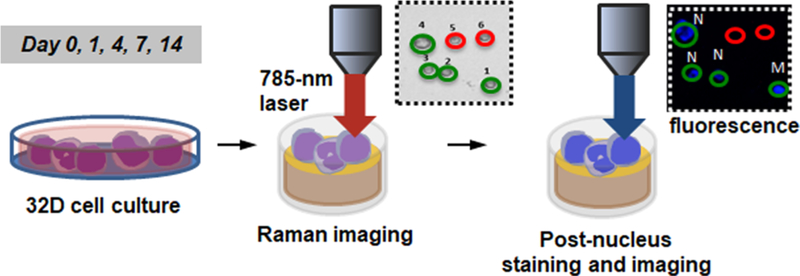
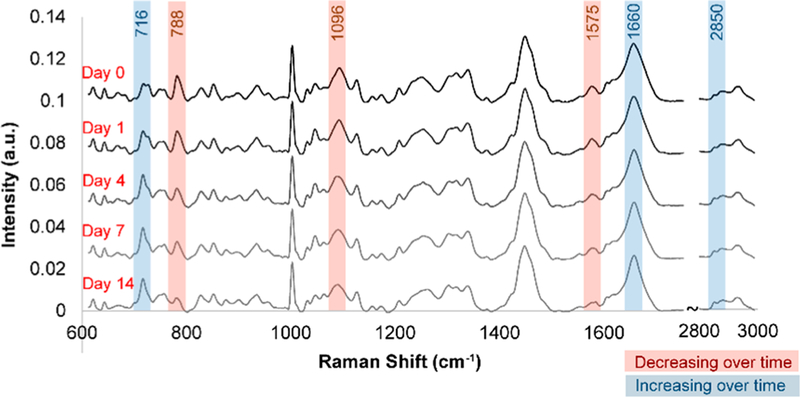
For Raman spectroscopic analysis, 32D cells seeded on glass-coated gold mirror substrates were analyzed on days 0, 1, 4, 7, and 14 post-induction using a 785 nm laser (Figure 2). Briefly, Raman spectra were acquired at room temperature using a Horiba LabRAM HR confocal Raman microscope (Horiba Scientific) and a 785 nm laser (15 mW power at the sample, theoretical spot diameter of 958 nm) that was focused on the center of each cell for 40 s through an Olympus 60× water-dipping objective (2 mm working distance). For each time point, N = 54–63 cells were analyzed. Immediately following the Raman analysis, 32D cells were stained in situ with Hoechst 33342 and Live/Dead stain and imaged with an upright fluorescence microscope to generate corresponding nucleus images and to check cell viability. Based on the fluorescent nucleus images, individual cells were classified as a myeloblast (M), a promyelocyte or a metamyelocyte (P), a band cell (B), or a neutrophil (N). Analysis of Live/Dead stained images showed laser irradiation during Raman spectroscopic analysis did not significantly affect cell viability nor significantly increased apoptotic or necrotic cells within at least 3-h of irradiation (Figure S1A). Also, laser irradiation did not significantly increase the degree of cell detachment from the substrates, although some cells detached during the post nucleus staining and imaging step (Figure S1B). During the 14-day neutrophilic differentiation, several major changes in Raman peaks were observed, particularly those corresponding to nucleic acids (e.g., 788, 1096 cm−1) and lipids (e.g., 716, 2850 cm−1) (Figure 3).
Figure 2.
Schematic of Raman spectroscopic analysis. 32D cells seeded on glass-coated gold substrates were analyzed with Raman spectroscopy on days 0, 1, 4, 7, and 14 post-induction using a 785 nm laser. Immediately following the analysis, 32D cells were stained with Hoechst 33342 and Live/Dead stain and imaged with an upright fluorescence microscope to obtain corresponding nuclear images and to check cell viability. Individual cells were classified as a myeloblast (M), a promyelocyte or a metamyelocyte (P), a band cell (B), or a neutrophil (N).
Figure 3.
Population-wide changes in Raman spectra during differentiation. Average baseline-subtracted Raman spectra of 32D cells on days 0, 1, 4, 7, and 14 following induction of neutrophilic differentiation showed pronounced changes in several peaks corresponding to nucleic acids and lipids. Raman spectra were acquired at room temperature using a Horiba LabRAM HR confocal Raman microscope (Horiba Scientific) equipped with a Horiba Synapse back-illuminated, deep-depletion CCD camera. A 785 nm laser (15 mW power at the sample, theoretical spot diameter of 958 nm) was focused on the center of each cell for 40 s through an Olympus 60× water-dipping objective (2 mm working distance). The grating was set to 300 grooves/mm, and the pinhole and slit sizes were set to 500 and 100 μm, respectively.
Principal Component Analysis of Raman Spectra Reveal Spectral Trends Associated with Neutrophilic Differentiation.
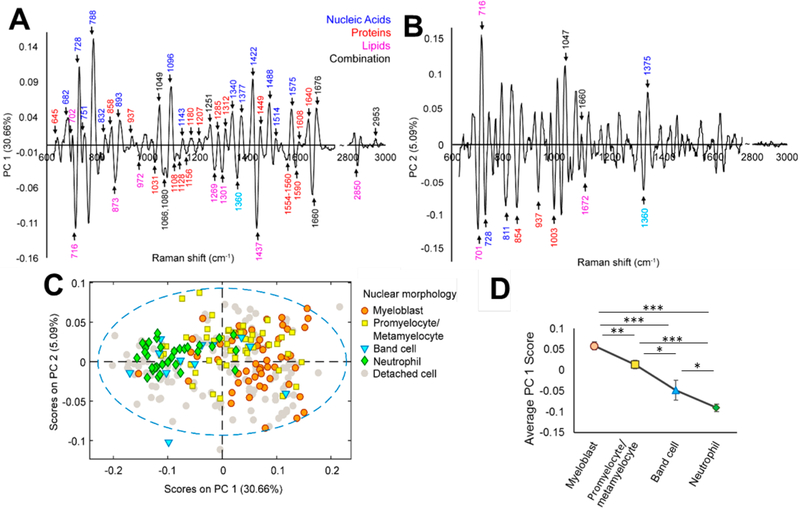
Principal component analysis (PCA) of the preprocessed Raman spectral data of 32D hematopoietic progenitor cells revealed significant trends during neutrophilic differentiation (Figure 4). PCA reduces the dimensionality of a data set by determining a small number of uncorrelated components (principal components, PCs) that define the most significant sources of variance in the data set.44 To visualize the spectral variance within and between cell populations identified according to their nucleus shape from the Hoechst 33342- stained nucleus images, PCA loading plots were generated for three independent rounds of neutrophilic differentiation of 32D cells. PCA effectively resolved overlapping vibrational modes in the Raman spectra into individual PCs that offered biomolecular compositional information. All Raman spectra were normalized to the area under the 1449 cm−1 peak, which corresponded to C–H vibrations from proteins and lipids, so that all variable loadings on the PCA plots were presented in relation to the total cellular (cytoplasmic and membrane) content. In PCA of round one of differentiation, significant sources of spectral variation were observed in PC 1 (30.66% of cumulative variance) and PC 2 (5.09% of cumulative variance) (Figure 4A,B), and most peaks in PC 1 and 2 corresponded to known vibrational modes while some corresponded to unidentified vibrations (Table S1).
Figure 4.
PCA analysis of spectral variations during neutrophilic differentiation. (A,B) PC 1 and PC 2 of PCA of individual 32D cells during the 14- day differentiation identify significant sources of spectral variance over time. (C) PCA demonstrated spectral trends as cells progressed through neutrophilic differentiation states (myeloblast, promyelocytes, metamyelocytes, band cells, neutrophils). (D) Average PC 1 scores correlated with the level of cell maturation. *p < 0.05, **p < 0.01, ***p < 0.001.
Overall, nucleic acid-associated peaks (682, 728, 788, 1096, 1143, 1340, 1377, 1422, 1488, 1514, 1575 cm−1) scored high (positive scores) while lipid-associated peaks (716, 873, 972, 1269, 1301, 1437, 2850 cm−1) scored low (negative scores) as a means to discern 32D cell differentiation (Figure 4A,B). Nucleic acid-related peaks also generally scored higher than protein-associated peaks (645, 858, 937, 1180, 1207, 1285, 1312, 1449, 1608, 1640 cm−1). Specifically, the peak at 788 cm−1 corresponding to the symmetric stretch mode from the DNA/RNA backbone O–P–O scored higher than any other protein peaks (Figure 4A), suggesting that nucleus related biomolecular changes accounted for the largest degree of variance throughout 32D cell differentiation. As such, we subsequently grouped Raman data based on the nuclear shape of the individual 32D cells as identified with the Hoechst 33342 stain. PCA loading plots of four subpopulations (myeloblasts (M), promyelocytes/metamyelocytes (P), band cells (B), neutrophils (N)) during the differentiation process showed an overall decrease in PC1 score, corresponding to decreasing nuclear content and an increasing cytoplasmic content as immature cells differentiated into more mature cells (Figure 4C), and this was consistent with higher ratios of nucleus-to-cytoplasm observed in immature vs maturing/ mature cells (Figure 1D). Although these subpopulations did not cluster tightly on the PC 2 vs PC 1 plot and appeared broadly distributed (Figure 4C), our findings were still in agreement with previous Raman spectroscopy reports that found higher nucleus-associated content in immature myeloid cells.10,45,46 The large distribution also suggests our classification for all 32D cells into four subpopulations based on their nuclear shape alone may not sufficiently resolve all cellular states across the neutrophilic differentiation continuum. However, these findings show that PCA analyses of Raman data provide a rich data set to underlie the quantification of the state of an individual cell within a larger cell culture.
Raman analyses also identified significant shifts in lipid-related peaks associated with 32D cell differentiation. Of the negative-scoring peaks on PC 1, peaks corresponding to choline headgroups (716 cm−1) and general lipid CH2 deformation (1437 cm−1) were the most significant (Figure 4A), suggesting that the ratio of choline-containing lipids to nucleic acids increased during cell maturation. Peak intensities of choline-to-cholesterol (716 cm−1/701 cm−1) and choline-to- phenylalanine (716 cm−1/1003 cm−1) ratios also increased as cells matured (Figure 4A,B, and Figure S2A). As specific granules have been shown to contain higher ratios of phospholipid to cholesterol in their vesicle membrane compared to azurophil or primary granules,47 this may be a general indicator of increasing concentrations of cytoplasmic specific granules as cells progress through granulopoiesis to form segmented neutrophils during the differentiation process.48 These spectral changes were consistent with the biochemical compositional change in total phospholipid to protein content for round 2 of differentiation, as measured by phospholipase D (PLD) and bicinchoninic acid (BCA) assay (Figure S2B). A significant 2.5-fold increase in phospholipid- to-protein content was observed from day 0 to day 14 post-induction, while the peak ratio of choline-to-phenylalanine (716 cm−1/1003 cm−1) increased 1.2-fold for the corresponding round.
Upon induction of neutrophilic differentiation with G-CSF, myeloperoxidase is reported to be abundantly expressed in myeloid cytoplasmic granules, but its transcription decreases to undetectable levels as cells differentiate to mature cells.49–51 Consistent with this observation, several negatively scoring protein peaks (1108, 1128, 1360, 1554–1560, 1590 cm−1) corresponded to previously reported Raman peaks of myeloperoxidase (Figure 4A,B), analyzed in both native form and within the cytoplasm of neutrophilic granulocytes.38,40,52,53
Globally, average PC 1 scores strongly correlated with the degree of 32D cell differentiation (Figure 4D). The most positive scores were observed for immature myeloblasts while the most negative scores were observed for fully segmented neutrophils. This trend remained when subpopulations were grouped based on the day of analysis as opposed to their nucleus shape (Figure S3). Additionally, 32D cells that were sorted based on their Gr-1 expression (Gr-1− vs Gr-1+ cell populations, collected from pre- and post-induction 32D cell populations, respectively) were clearly distinguishable based on PCA of their Raman spectra, regardless of their nucleus shape (Figure S4), suggesting cell classification based on Gr-1 expression may be a more reliable indicator of 32D cell maturation than identification based on their nucleus shape alone.
Consistent Spectral Changes Were Observed in Independent Rounds of 32D Cell Differentiation.
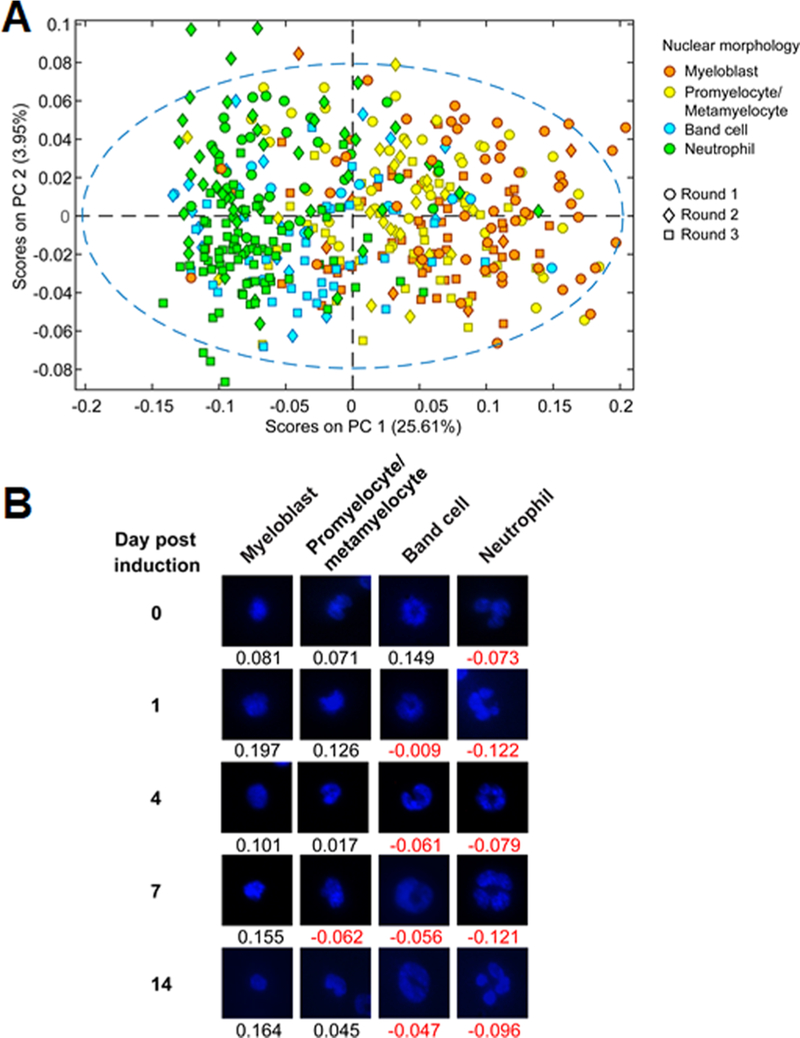
To demonstrate the reproducibility of monitoring 32D cell neutrophilic differentiation via Raman spectroscopy, spectra from three independent trials were analyzed using PCA (Figure 5). Raman spectra of individual cells were organized based on their nuclear shape. PC 1 captured 25.61% of the cumulative variance while PC 2 captured 3.95% of the cumulative variance (Figure 5A). As evident in the PCA plot, PC 1 scores correlated with the differentiation state of 32D cells, and the same spectral trends from individual rounds of differentiation were still observed. In particular, the most significant and relevant sources of spectral variance were not significantly affected by batch-to-batch variation or differences in acquisition conditions, such as fluctuations in laser intensity. Differences in PC 2 scores primarily corresponded to heterogeneity in cell populations and were not deemed relevant. Examples of cells from all three differentiation rounds in various differentiation states, classified according to their nuclear morphology, and their respective PC1 scores are shown in Figure 5B. A demonstrable decrease in PC 1 scores indicated an increased level of cell maturation or the degree of cell differentiation. Despite the significant overlap in PC 1 scores among cells from four different subpopulations, which reflected limitations in cell classification based on their nucleus shape alone, our findings validate the use of Raman spectroscopy combined with multivariate analyses to assign a reproducible, quantitative “differentiation score” to individual 32D hematopoietic progenitor cells undergoing neutrophilic differentiation. In this sense, biomolecular information-based screening of 32D cells via Raman data may allow more accurate segmentation of 32D cell differentiation along a continuum while avoiding the use of external labels required for traditional means of identification (i.e., nucleus staining, Gr-1 antigen staining) that fails to capture the biomolecular complexity observed during differentiation.
Figure 5.
32D cell lineage specification from independent rounds of differentiation. (A) PCA plot of 32D cell spectra combined from three differentiation rounds. (B) Representative cell nuclei images corresponding to the four differentiation states were selected from days 0, 1, 4, 7, and 14 from all three cycles and assigned PC1 scores from the above PCA plot.
Partial Least-Squares Discriminant Analysis (PLS-DA) Accurately Discriminates Neutrophil Differentiation Based on Raman Spectra.
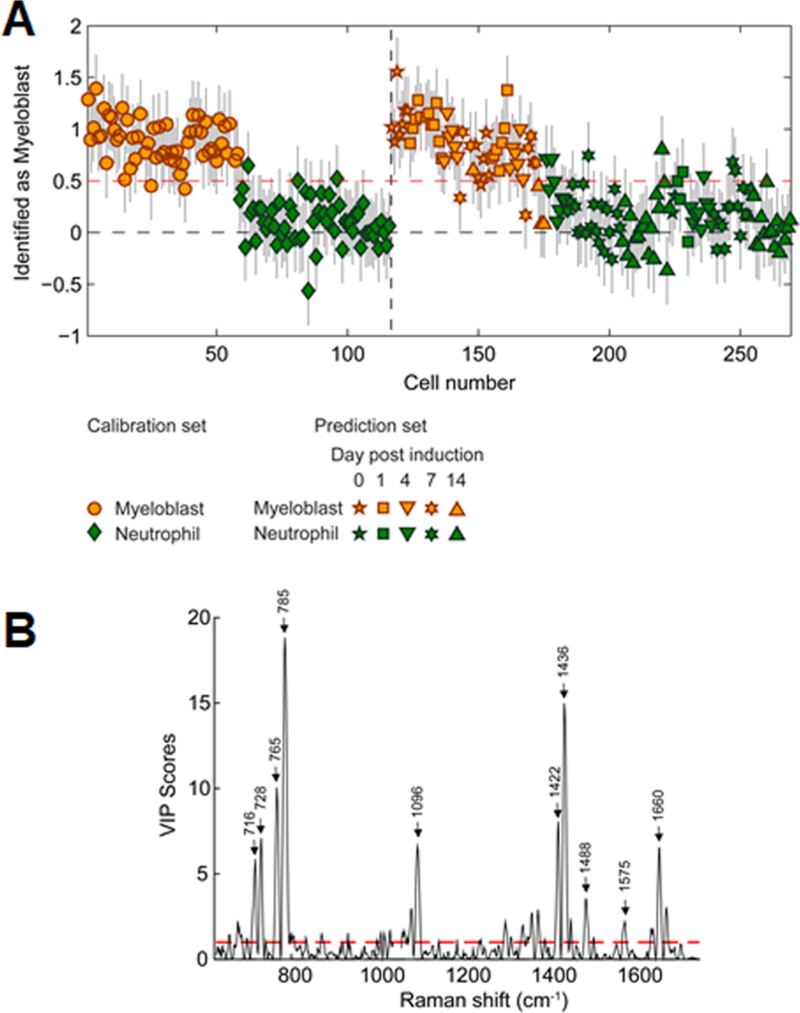
The ability to discriminate myeloid differentiation states solely via Raman spectra was also evaluated using partial least-squares discriminant analysis (PLS-DA). PLS-DA determines the combination of variables that are specific to each class of a sample set.54 We identify Raman peaks that are specific and sensitive to 32D cells classified as myeloblasts or neutrophils during the course of neutrophilic differentiation via parallel measure of nuclear morphology. To define calibration and test sets, 32D cell spectra classified as myeloblasts or neutrophils based on their nuclear morphology from three differentiation rounds were split using a venetian blinds method.55 The calibration set consisted of 58 myeloblast cell spectra and 58 neutrophil cell spectra while the test set consisted of 57 myeloblast cell spectra and 92 neutrophil cell spectra. The peak at 1047 cm−1, originating from the cell acquisition media, was removed from analysis due to its high Q residual score. For our PLS-DA model, two latent variables (LV), which represent linear combinations of variables with the best predictive power,56 were chosen to minimize the cross-validation error. LV 1 captured 19.4% of the variance while LV2 captured 2.54% of the variance, and the resulting PLS-DA model predicted myeloblasts and neutrophils with high sensitivity and specificity with a classification error of 11.3% (Figure 6A; Table S2). Notably, the model accurately identified the differentiation state regardless of the day post-induction. Corresponding variable importance in projection (VIP) plots showed the most significant peaks used to discriminate between immature myeloblasts and neutrophils were primarily composed of nucleic acid Raman peaks, with a relatively small contribution from choline (716 cm−1) and other lipid peaks (Figure 6B). Here, the most informative determinant of differentiation state was the spectral nucleocytoplasmic ratio related to shifts in nuclear morphology with differentiation. Interestingly, five out of the six “misclassified” myeloblasts in the test set were cells from days 7 and 14 post-induction, suggesting the sensitivity of our model was limited more by the single-cell accuracy of the traditional metrics we used to visually classify the 32D cells based on nuclear shape.
Figure 6.
PLS-DA for the discrimination of myeloid cells. A PLS-DA model was generated and tested using cell spectra of myeloblasts and neutrophils, as determined by nuclear morphology, from all three differentiation rounds. (A) A classification threshold was established via a Calibration set (red dashed line). The remaining cells (Prediction set) were classified relative to the classification threshold, with the accuracy established by comparing model prediction (color) to direct nuclear morphology assessment (symbols). Error bars represent the estimation error for each prediction. (B) Corresponding VIP plot showing Raman peaks most significant for discriminating between myeloblasts and neutrophils. Peaks above the red dashed line were estimated to be important in predicting the cell type. Select peaks with the most significant scores are labeled.
When we built a PLS-DA model using Raman spectra from all four subpopulations of differentiation (myeloblasts, promyelocytes/metamyelocytes, band cells, and neutrophils), classification errors ranged 19–44% (Table S2). This relatively high classification errors pointed to the fact that the intermediate differentiation states did not present with distinct Raman spectra that were specific to these states. We suspect Raman spectral scanning and/or mapping over a larger cell area may improve the sensitivity in discriminating intermediate cell types.
Table S2 further summarizes two other PLS-DA models. When we built a PLS-DA model using spectral data from a single round of differentiation (round 2), it showed a higher classification error of 15.3% in discriminating myeloblasts from neutrophils. We infer that, in generating a classification model, the inclusion of spectral data from multiple differentiation rounds can be used to filter out irrelevant spectral variability, thereby increasing model robustness and accuracy. A PLS-DA model calibrated using Raman spectra of 32D cells collected based on their Gr-1 expression (Gr-1− vs Gr-1+ cells flow sorted from days 0 and 14 post-induction, N = 32 each) yielded a classification error of 16.0% in discriminating myeloblasts from neutrophils. For this model, its prediction capability was highly dependent on the preprocessing parameters and the Savitzky-Golay smoothing filter had to be increased from 25 to 31 to minimize the error. The higher classification error in this model suggests that the Gr-1 antigen expression does not correlate well with changes in nuclear morphology. Together, these findings again suggest that changes in nuclear shape or Gr-1 expression level may be too subjective to be used to accurately determine differentiation state at the single-cell level, further supporting the need for new objective classification strategies such as those enabled via Raman spectroscopy.
CONCLUSIONS
We report the successful application of noninvasive Raman spectroscopy to trace neutrophilic differentiation of 32D cells. Raman spectroscopic analysis of individual cells revealed identifiable spectral differences between discrete states during neutrophilic differentiation, as well as population-wide spectral trends correlated with known biomolecular changes during granulopoiesis. Nuclear content decreased over time while contribution from cellular lipids, particularly choline headgroups, increased. Several Raman peaks known to associate with myeloperoxidase were also observed. These findings were consistent with decreasing nucleus-to-cytoplasm ratios quantified from microscopic images of the cells and increasing levels of total phospholipid from biochemical assays (PLD assay). Moreover, a PLS-DA model built from the Raman spectral information was able to predict the degree of neutrophilic differentiation with high specificity and sensitivity, with a classification error of 11.3%. Our findings highlight the utility and reliability of Raman spectroscopy as a robust molecular screening tool for tracing the heterogeneity of stem cell differentiation events in vitro. Raman spectroscopy of HSPC populations may serve as a new bioanalytical tool that can dynamically, noninvasively monitor individual cells in real time, in situ, to provide an alternative to the conventional methods of HSPC analysis.
EXPERIMENTAL PROCEDURES
Cell Culture and Differentiation.
Prior to inducing differentiation, 32D cells (32D Clone 3, murine cell line CRL- 11346; ATCC) were maintained in complete growth culture media according to ATCC’s recommended culture protocol for cell expansion. Complete growth media consisted of RPMI 1640 medium with 2 mM L-glutamine adjusted to contain 1.5 g/L sodium bicarbonate, 4.5 g/L glucose, 10 mM HEPES, and 1.0 mM sodium pyruvate, supplemented with 10% heat-inactivated FBS, 10% mouse interleukin-3 culture supplement (Corning Inc.), and 1% Pen/Strep. To induce differentiation, 32D cells were collected, washed twice with warm PBS, and resuspended in the induction media at 5E5 cells/mL as previously reported.57 Induction media consisted of RPMI 1640 medium with 2 mM L-glutamine adjusted to contain 1.5 g/L sodium bicarbonate, 4.5 g/L glucose, 10 mM HEPES, and 1.0 mM sodium pyruvate, supplemented with 10% heat-inactivated FBS, 0.1% mouse interleukin-3 culture supplement, 1% Pen/Strep, and 25 ng/mL of G-CSF for the first 4 days following induction then consisted of RPMI 1640 medium with 2 mM L-glutamine adjusted to contain 1.5 g/L sodium bicarbonate, 4.5 g/L glucose, 10 mM HEPES, and 1.0 mM sodium pyruvate, supplemented with 10% heat-inactivated FBS, 1% Pen/Strep, and 25 ng/mL of G-CSF for the rest of the differentiation cycle. All cell cultures were maintained in tissue culture Petri dishes until analysis.
Raman Spectroscopic Analysis of Live 32D Cells.
Cells maintained in tissue culture Petri dishes were analyzed with Raman spectroscopy daily. Cells were first seeded on gridmarked glass-coated gold mirrors (Thorlabs) for 2 h, rinsed with PBS, then carefully resuspended in phenol-red free RPMI 1640 supplemented with 10% FBS, 1% Pen/Strep, and 2.5% HEPES buffer for Raman spectral acquisition. Raman spectra were acquired at room temperature using a Horiba LabRAM HR confocal Raman microscope (Horiba Scientific) equipped with a Horiba Synapse back-illuminated, deep-depletion CCD camera. A 785 nm laser (15 mW power at the sample, theoretical spot diameter of 958 nm) was focused on the center of each cell for 40 s through an Olympus 60× water-dipping objective (2 mm working distance). The grating was set to 300 grooves/mm, and the pinhole and slit sizes were set to 500 and 100 μm, respectively.
Multivariate Analysis of Raman Spectra.
Raman cell spectra were preprocessed and analyzed as previously described.26,29 Spectral preprocessing was performed using LabSpec 5 (Horiba Scientific) and the PLS Toolbox (v 8.1, eigenvector Research) run in MATLAB (8.4.0.150421, R2014b, MathWorks Inc.) prior to multivariate analysis. Raman spectra were individually examined for cosmic spikes or inconsistent peaks, which were removed manually. Spectra were manually aligned in Excel to the phenylalanine peak at 1003 cm−1. The spectral range was then reduced to 624–1750 cm−1 and 2850–2987 cm−1 to remove the asymptotic behavior at the outer limits of the spectra that were present after variable alignment, and to remove unnecessary signal from the “cell-silent” region (1750–2850 cm−1). Each cell spectrum was preprocessed by taking the second derivative, followed by Savitzky-Golay smoothing (second order polynomial, 25 points), alignment using zero-order offset alignment (slack = 2) to a randomly assigned cell spectrum, normalization to the area under the CH def. peak (range 1427–1479 cm−1), multiplying the entire spectrum by –1 in order for original peaks to have positive values after differentiation, and mean-centering to the data set.
PCA and PLS-DA were performed on the preprocessed spectra using the PLS Toolbox run in MATLAB.54–56 PCA models were constructed using spectra from individual differentiation rounds, spectra from all three differentiation rounds, and spectra from sorted Gr-1− and Gr-1+ cells. Principal components (PC) were selected such that they constituted >1% of cumulative spectral variance. Several PLS-DA models of varying calibration and validation sets were constructed for comparison of discriminatory performance. The number of latent variables (LV) was selected such that the cross-validation and prediction errors were minimized (either 1 or 2 LVs). All models captured at least 70% of the variance in the model spectra. Incorrectly calibrated samples that exhibited unusual spectral variance, as evidence by Q residual statistics greater than the 95% confidence limit, were removed from the calibration set and omitted from further analysis.
Statistical Analysis.
One-way analysis of variance (ANOVA) with Tukey post-hoc testing was used to determine statistical differences between data groups at a significance level of p < 0.05. All errors are reported as standard error of the mean (SEM) unless otherwise noted.
Supplementary Material
ACKNOWLEDGMENTS
Research reported in this publication was supported by the National Institute of Biomedical Imaging and Bioengineering of the National Institutes of Health under Award Numbers R21 EB018481 and R01 DK099528 (B.A.C.H.). Research reported in this publication was also supported by National Heart, Lung, and Blood Institute of the National Institutes of Health under Award Number R21 HL132642 (M.L.K.). The content is solely the responsibility of the authors and does not necessarily represent the official views of the NIH. The authors wish to acknowledge additional institutional and financial assistance provided by the Dept. of Chemical and Biomolecular Engineering and Carl R. Woese Institute for Genomic Biology at the University of Illinois at Urbana–Champaign (B.A.C.H.).
Footnotes
ASSOCIATED CONTENT
Supporting Information
The Supporting Information is available free of charge on the ACS Publications website at DOI: 10.1021/acs.bioconjchem.8b00459.
Detailed experimental methods; Nucleus staining, cytospin for Wright‘s stain, and flow cytometric analysis of 32D cells during neutrophilic differentiation; cell cycle analysis with flow cytometry; live/dead cell viability assay; protein (BCA) and phospholipid (PLD) quantification assays (PDF)
Notes
The authors declare no competing financial interest.
REFERENCES
- (1).Hines M, Nielsen L, and Cooper-White J (2008) J. Chem. Technol. Biotechnol 83, 421–443. [Google Scholar]
- (2).Morrison SJ, and Scadden DT (2014) Nature 505, 327–334. [DOI] [PMC free article] [PubMed] [Google Scholar]
- (3).Choi J, and Harley B (2016) Current Stem Cell Reports 2, 85. [DOI] [PMC free article] [PubMed] [Google Scholar]
- (4).Choi JS, Mahadik BP, and Harley BAC (2015) Biotechnol. J 10, 1529–1545. [DOI] [PMC free article] [PubMed] [Google Scholar]
- (5).Park D, Sykes DB, and Scadden DT (2012) Front. Biosci., Landmark Ed 17, 30–39. [DOI] [PMC free article] [PubMed] [Google Scholar]
- (6).Choi JS, and Harley BAC (2012) Biomaterials 33, 4460–4468. [DOI] [PubMed] [Google Scholar]
- (7).Choi JS, and Harley BAC (2017) Science Advances 3, e1600455. [DOI] [PMC free article] [PubMed] [Google Scholar]
- (8).Mahadik BP, Wheeler TD, Skertich LJ, Kenis PJ, and Harley BA (2014) Adv. Healthcare Mater 3, 449–458. [DOI] [PubMed] [Google Scholar]
- (9).Mahadik BP, Haba SP, Skertich LJ, and Harley BAC (2015) Biomaterials 67, 297–307. [DOI] [PMC free article] [PubMed] [Google Scholar]
- (10).Mahadik BP, Bharadwaj NAK, Ewoldt RH, and Harley BAC (2017) Biomaterials 125, 54–64. [DOI] [PMC free article] [PubMed] [Google Scholar]
- (11).Lee-Thedieck C, and Spatz JP (2014) Biomater. Sci 2, 1548–1561. [DOI] [PubMed] [Google Scholar]
- (12).Sugimura R (2016) Adv. Drug Delivery Rev 99, 212. [DOI] [PubMed] [Google Scholar]
- (13).Silberstein LE, and Lin CP (2013) Cell Stem Cell 13, 514–516. [DOI] [PMC free article] [PubMed] [Google Scholar]
- (14).Mendelson A, and Frenette PS (2014) Nat. Med 20, 833–846. [DOI] [PMC free article] [PubMed] [Google Scholar]
- (15).Hanoun M, and Frenette PS (2013) Cell Stem Cell 12, 391–392. [DOI] [PMC free article] [PubMed] [Google Scholar]
- (16).Nakamura-Ishizu A, and Suda T (2013) Biochim. Biophys. Acta, Gen. Subj 1830, 2404. [DOI] [PubMed] [Google Scholar]
- (17).Kokkaliaris KD, Loeffler D, and Schroeder T (2012) Curr. Opin. Hematol 19, 243–249. [DOI] [PubMed] [Google Scholar]
- (18).Endele M, Etzrodt M, and Schroeder T (2014) Exp. Cell Res 329, 207–213. [DOI] [PubMed] [Google Scholar]
- (19).Walasek MA, van Os R, and de Haan G (2012) Ann. N. Y. Acad. Sci 1266, 138–150. [DOI] [PubMed] [Google Scholar]
- (20).Peerani R, and Zandstra PW (2010) J. Clin. Invest 120, 60–70. [DOI] [PMC free article] [PubMed] [Google Scholar]
- 21).Joseph C, Quach JM, Walkley CR, Lane SW, Lo Celso C., and Purton LE (2013) Cell Stem Cell 13, 520–533. [DOI] [PubMed] [Google Scholar]
- (22).Copley MR, Beer PA, and Eaves CJ (2012) Cell Stem Cell 10, 690–697. [DOI] [PubMed] [Google Scholar]
- (23).Schroeder T (2010) Cell Stem Cell 6, 203–207. [DOI] [PubMed] [Google Scholar]
- (24).Borregaard N, and Cowland JB (1997) Blood 89, 3503–3521. [PubMed] [Google Scholar]
- (25).Ilin Y, and Kraft ML (2015) Curr. Opin. Biotechnol 31, 108–116. [DOI] [PMC free article] [PubMed] [Google Scholar]
- (26).Frankfurt OS (1980) J. Histochem. Cytochem 28, 663–669. [DOI] [PubMed] [Google Scholar]
- (27).Ember KJI, Hoeve MA, McAughtrie SL, Bergholt MS, Dwyer BJ, Stevens MM, Faulds K, Forbes SJ, and Campbell CJ (2017) npj Regenerative Medicine 2, 12. [DOI] [PMC free article] [PubMed] [Google Scholar]
- (28).Frisz JF, Choi JS, Wilson RL, Harley BAC, and Kraft ML (2012) Anal. Chem 84, 4307–4313. [DOI] [PMC free article] [PubMed] [Google Scholar]
- (29).Ilin Y, Choi JS, Harley BAC, and Kraft ML (2015) Anal. Chem 87, 11317–11324. [DOI] [PMC free article] [PubMed] [Google Scholar]
- (30).Schulze HG, Konorov SO, Caron NJ, Piret JM, Blades MW, and Turner RF (2010) Anal. Chem 82, 5020–5027. [DOI] [PubMed] [Google Scholar]
- (31).Ghita A, Pascut FC, Sottile V, Denning C, and Notingher I (2015) Epj Techniques and Instrumentation 2, 6. [DOI] [PMC free article] [PubMed] [Google Scholar]
- (32).Downes A, Mouras R, Bagnaninchi P, and Elfick A (2011) J. Raman Spectrosc 42, 1864–1870. [DOI] [PMC free article] [PubMed] [Google Scholar]
- (33).Kunstar A, Leferink AM, Okagbare PI, Morris MD, Roessler BJ, Otto C, Karperien M, van Blitterswijk CA, Moroni L, and van Apeldoorn AA (2013) J. R. Soc., Interface 10, 20130464. [DOI] [PMC free article] [PubMed] [Google Scholar]
- (34).Ichimura T, Chiu L.-d., Fujita K, Machiyama H, Yamaguchi T, Watanabe TM, and Fujita H (2016) Sci. Rep 6, 37562. [DOI] [PMC free article] [PubMed] [Google Scholar]
- (35).Chen M, McReynolds N, Campbell EC, Mazilu M, Barbosa J, Dholakia K, and Powis S (2015) PLoS One 10, e0125158. [DOI] [PMC free article] [PubMed] [Google Scholar]
- (36).Chan JW, Taylor DS, Zwerdling T, Lane SM, Ihara K, and Huser T (2006) Biophys. J 90, 648–656. [DOI] [PMC free article] [PubMed] [Google Scholar]
- (37).Managò S, Valente C, Mirabelli P, Circolo D, Basile F, Corda D, and De Luca AC (2016) Sci. Rep 6, 24821. [DOI] [PMC free article] [PubMed] [Google Scholar]
- (38).Nachman R, Hirsch JG, and Baggiolini M (1972) J. Cell Biol 54, 133–140. [DOI] [PMC free article] [PubMed] [Google Scholar]
- (39).Schulze HG, Konorov SO, Caron NJ, Piret JM, Blades MW, and Turner RFB (2010) Anal. Chem 82, 5020–5027. [DOI] [PubMed] [Google Scholar]
- (40).Gupta D, Shah HP, Malu K, Berliner N, Gaines P, and Coligan JE (2014) Current protocols in immunology 104, 22F.5.1. [DOI] [PMC free article] [PubMed] [Google Scholar]
- (41).Vradii D, Zaidi SK, Lian JB, van Wijnen AJ, Stein JL, and Stein GS (2005) Proc. Natl. Acad. Sci. U. S. A 102, 7174–7179. [DOI] [PMC free article] [PubMed] [Google Scholar]
- (42).Bergholt MS, Albro MB, and Stevens MM (2017) Biomaterials 140, 128–137. [DOI] [PMC free article] [PubMed] [Google Scholar]
- (43).Rane SG, Mangan JK, Amanullah A, Wong BC, Vora RK, Liebermann DA, Hoffman B, Graña X, and Reddy EP (2002) Blood 100, 2753. [DOI] [PubMed] [Google Scholar]
- (44).Jolliffe IT, and Cadima J (2016) Philos. Trans. R. Soc., A 374, 20150202. [DOI] [PMC free article] [PubMed] [Google Scholar]
- (45).Brauchle E, Knopf A, Bauer H, Shen N, Linder S, Monaghan MG, Ellwanger K, Layland SL, Brucker SY, Nsair A, and Schenke-Layland K (2016) Stem Cell Rep 6, 188–199. [DOI] [PMC free article] [PubMed] [Google Scholar]
- (46).Smith R, Wright KL, and Ashton L (2016) Analyst 141, 3590–3600. [DOI] [PubMed] [Google Scholar]
- (47).Papazoglou ES, Babu S, Mohapatra S, Hansberry DR, and Patel C (2010) Nano-Micro Lett 2, 74–82. [Google Scholar]
- (48).Borregaard N, Sehested M, Nielsen BS, Sengelov H, and Kjeldsen L (1995) Blood 85, 812. [PubMed] [Google Scholar]
- (49).Puppels GJ, Garritsen HS, Segers-Nolten GM, de Mul FF, and Greve J (1991) Biophys. J 60, 1046–1056. [DOI] [PMC free article] [PubMed] [Google Scholar]
- (50).Goheen SC, Lis LJ, Kucuk O, Westerman MP, and Kauffman JW (1993) J. Raman Spectrosc 24, 275–279. [Google Scholar]
- (51).Strzepa A, Pritchard KA, and Dittel BN (2017) Cell. Immunol 317, 1–8. [DOI] [PMC free article] [PubMed] [Google Scholar]
- (52).Fazio E, Trusso S, Franco D, Nicolo MS, Allegra A, Neri F, Musolino C, and Guglielmino SP (2016) Spectrochim. Acta, Part A 159, 21–29. [DOI] [PubMed] [Google Scholar]
- (53).Vanna R, Ronchi P, Lenferink ATM, Tresoldi C, Morasso C, Mehn D, Bedoni M, Picciolini S, Terstappen LWMM, Ciceri F, Otto C, and Gramatica F (2015) Analyst 140, 1054–1064. [DOI] [PubMed] [Google Scholar]
- (54).Gromski PS, Muhamadali H, Ellis DI, Xu Y, Correa E, Turner ML, and Goodacre R (2015) Anal. Chim. Acta 879, 10–23. [DOI] [PubMed] [Google Scholar]
- (55).Rubingh CM, Bijlsma S, Derks EPPA, Bobeldijk I, Verheij ER, Kochhar S, and Smilde AK (2006) Metabolomics 2, 53–61. [DOI] [PMC free article] [PubMed] [Google Scholar]
- (56).Abdi H (2010) Wiley Interdisciplinary Reviews: Computational Statistics 2, 97–106. [Google Scholar]
- (57).Cialla-May D, Zheng XS, Weber K, and Popp J (2017) Chem. Soc. Rev 46, 3945–3961. [DOI] [PubMed] [Google Scholar]
Associated Data
This section collects any data citations, data availability statements, or supplementary materials included in this article.


