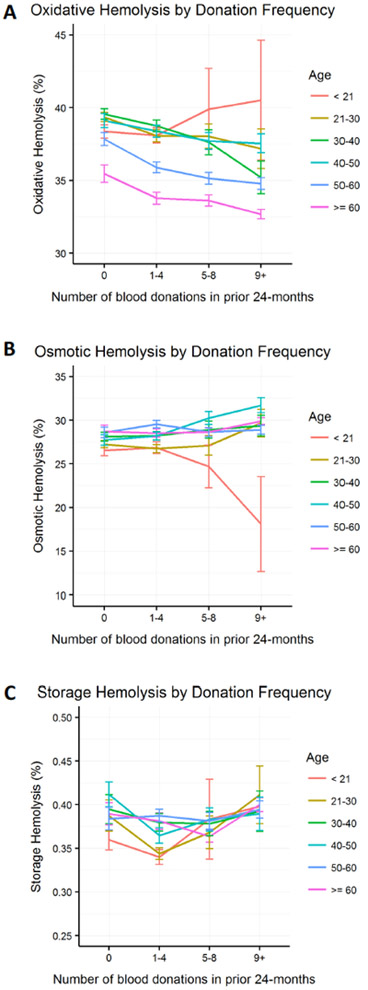
Figure 4: Evaluation of age-specific differences in the rates of stress or storage-induced hemolysis in response to frequent blood donations.
Figure panels represent the amount of A. Percent AAPH-induced oxidative hemolysis (150mmol/L, 1.5h, 37°C) (n=10,476). B. Percent osmotic hemolysis (n=12,799), and C. Percent storage spontaneous hemolysis (n=12,753) at selected age groups (decades) in the 4 categories of donation frequency. Error bars represent standard errors of the mean. A. n=17 and B-C. n=25 young donors (<21 years) at donation categories 5–8 and 9+ combined. Hemolysis measures were normalized for blood center differences in blood component manufacturing procedures.

