Abstract
This study was to assess the impact of different colors of coffee fruit (green, yellow and red) on adipogenesis and/or lipolysis using 3T3-L1 adipocytes. Characterization of chemical constituents in different colors of coffee fruit extracts was determined by ESI-Q-TOF-MS. The cytotoxicity of the extracts in 3T3-L1 preadipocytes were evaluated by MTT assay. Oil-red O staining and amount of glycerol released in 3T3-L1 adipocytes were measured for lipid accumulation and lipolysis activity. All coffee fruit extracts displayed similar chromatographic profiles by chlorogenic acid > caffeoylquinic acid > caffeic acid. Different colors of raw coffee fruit possessed inhibitory adipogenesis activity in 3T3-L1 adipocytes, especially CRD decreased lipid accumulation approximately 47%. Furthermore, all extracts except CYF and their major compounds (malic, quinic, and chlorogenic acid) increased glycerol release. Our data suggest that different colors of coffee fruit extract have possessed anti-adipogenic and lipolytic properties and may contribute to the anti-obesity effects.
Keywords: coffee, chlorogenic acid, adipogenesis, quinic acid, lipolysis
INTRODUCTION
The prevalence of obesity is linked to an increase of chronic diseases such as insulin resistance and cardiovascular disease (CVD) (1). It is well known that obesity occur mainly because of an imbalance between energy intake and utilization, leading to an alteration in body composition, especially in adipocytes (2). Adipose tissue is recognized as an important organ that regulates of energy metabolism and many physiological functions including appetite regulation, immunity, glucose and lipid metabolism, reproduction and body weight homeostasis (3). The excessive of number of adipose tissue and an enlargement in adipocyte size results from increased storage, proliferation and differentiation of triacylglycerol (TAG). Fat accumulation is considered by the balance between synthesis (lipogenesis) and breakdown (lipolysis) of TAG (3). Decreases in adipose tissue mass may possibly induce by promoting lipolysis and inhibiting adipogenesis that reduce obesity. Nowadays, natural products have received more attention to prevent obesity and other chronic diseases. Several plants have been shown to have potential for inhibiting adipogenesis (4, 5) and stimulating lipolysis in adipocytes (6, 7).
Coffee (Coffea arabica L.) is members of Rubiaceae family. Several compounds have been found in coffee fruit including micronutrients (8), chlorogenic, caffeic, and ferulic acid, trigonelline, and caffeine (9, 10). Coffee has been shown to possess antioxidant, antibacterial (10), antifungal (11), and antiradical activities (12). Many studies have demonstrated that coffee can prevent of Type 2 Diabetes Mellitus, improve insulin sensitivity, decreases the risk of parkinson’s disease (8), reduces the risk of cancers, hepatoprotective effect and anti-inflammatory activity (13). Some study suggests that coffee bean is also effective to improve obesity (14, 15). However, only coffee bean was analyzed, and more research of whole coffee fruit is needed. Normally, growing coffee fruit begins green color and gradually to change to yellow and red when they ripen. For all that, antiobesity which underlying the effect of different colors of coffee fruits are still not fully known. In this study, we characterized bioactive compounds and examined the role of different colors of coffee fruits in inhibition of adipogenesis and stimulations of lipolysis in 3T3-L1adipocytes. This study provides scientific evidence to support different colors of coffee fruits as a potential supplement to reduce the risk of obesity and other chronic diseases.
MATERIALS AND METHODS
Chemicals
3-isobutyl-1-methylxanthine (IBMX), dexamethasone (DEX), insulin, oil red O stain, isopropanol, formalin, MTT (3-[4,5-dimethylthiazol-2-yl]-2,3-diphenyl tetrazolium bromide), DMSO, Chlrogenic acid, Caffeic acid (purity ≥ 98.0%), and caffeine were purchased from Sigma-Aldrich, USA.Dulbecco modified Eagle medium (DMEM), calf bovine serum (CBS), and fetal bovine serum (FBS), trypsin/EDTA, and penicillin/streptomycin were purchased from GIBCO (BRL Life Technologies, Grand Island, NY, USA). Adipolysis assay kit was obtained from Merck (Darmstadt, Germany).
Plant extract preparation
Raw coffee fruits (Green, Yellow, and Red) were provided by Chao-Thai-Pukao Factory, Chiang Mai, Thailand. Coffee fruits were divided into two parts. The first part was dried by hot air oven at 50°C, and then blended by using blender machine. Dry coffee fruits were extracted with boiling distilled water (coffee: boiled distilled water; 1:10) for 30 min. The second parts, fresh coffee fruits were blended with distilled water and boiled for 30 min. The filtered solution was lyophilized to obtain dry powders. The powder extract was stored at −20°C until further study. Coffee fruits extract include CGD, CGF, CYD, CYF, CRD, CRF and CRBD. For quantitative analysis of coffee fruit extracts, stock solutions of seven extracts were prepared by dissolving them in the mixture solution of acetonitrile and ultra-pure water (3:7 v/v) at 20 mg/mL with the exception of three samples (CGF, CYF and CRBD) were prepared at 10 mg/mL due to their solubility was limited in this mixture solution. A mixture of the standard compounds (caffeic acid and chlorogenic acid) each at 10 μg/mL was injected into the system.
Instrumentation LC-ESI-Q-TOF-MS conditions
Chromatographic experiments were performed using an Agilent 6540 Q-TOF-MS spectrometer (Agilent Technologies, Singapore) coupled with an Agilent 1260 infinity series HPLC system (Agilent, Waldbonn, Germany). The HPLC system consists of a vacuum degasser, an autosampler, a binary pump, and a temperature controlled column compartment. The instrument was also coupled to an electrospray ionization (ESI) source and proprietary Agilent dual nebulizer. The samples were analyzed by LC-ESI-Q-TOF-MS according to previously described method with some modifications (10). Briefly, the injection volume was 5 μL for samples and standards. In the HPLC analysis, a mobile phase of 0.1% formic acid in water (v/v) (A) and 0.1% formic acid in acetonitrile (v/v) (B), was employed in the linear gradient mode with 10–90% B for 30 min. The separation was performed with phenomenex Luna C-18 (2), 150 mm × 4.6 mm internal diameter, 5 μm particle size column (Phenomenex Inc., Torrance, CA, USA) at a flow rate of 0.5 mL/min and the column temperature was set to 35ºC. The operating MS detection were worked in negative-mode and parameters were as follows: drying gas (N2) flow rate, 10.0 L/min; drying gas temperature, 350ºC; nebulizer pressure, 30 psig; capillary voltage, 3500 V; skimmer, 65 V; octapole RF, 750; and fragmentor voltage, 100 V. LC-MS accurate mass spectra were recorded across the range 100–1200 m/z with 4 spectra/sec. Peak identification was performed by comparison of the retention time, mass spectra, and fragmentation patterns with standard compounds, published data and library search (MassHunter Metlin metabolite PCD/PCDL, Agilent Technologies). Contents of marker compounds were calculated based on peak area and were determined in triplicate experiments.
3T3-L1 pre-adipocytes cells culture and differentiation
Mouse embryo 3T3-L1 cell line was obtained from the American Type Culture Collection (ATCC, CL-173). 3T3-L1 pre-adipocytes were grown in high glucose-containing Dulbecco’s Medium (DMEM), supplemented with 10% heat-inactivated (56°C, 30 min) bovine calf serum (CFS). Cells were maintained at 37°C in a humidified 5% CO2 atmosphere throughout the experiments. For subculture, the medium was removed, and cells were detached with 0.25% trypsin in a Ca2+-, Mg2+-free phosphate-buffered saline (PBS) containing 0.2 g/L EDTA.
For differentiation of 3T3-L1 preadipocytes to mature adipocytes, 3T3-L1 pre-adipocytes were induced with differentiation media (DMEM with high glucose content that supplemented with 10% fetal bovine serum (complete media), 1 μM dexamethasone (DEX), 0.5 mM IBMX, and 10 μg/mL insulin (day 0 to day 1). Beginning day 2, the medium was replenished with maturation media (complete media and 10 μg/mL insulin) and maintained at 37°C in a humidified 5% CO2 atmosphere. This medium was changed every 2 days until day 10. At this time, the cells exhibited characteristic of mature adipocytes.
Cell Viability Assay
Cell viability was measured using MTT (3-[4,5-dimethylthiazol-2-yl]-2,3-diphenyl tetrazolium bromide) assay. 3T3-L1 preadipocyte cells were plated in 96-well plates at a density of 20,000 cells/well for 24 h. Cells were fasting with serum-free medium overnight and then exposed to the coffee fruits extracts (200,400, 800, and 1000 μg/mL) for 24 h. Two hours before the end of the treatment, MTT reagent (0.5 mg/mL, 10 μl) was added to each well and incubated until completed treatment. The colored crystal of produced formazan was dissolved in 200 μL of 100% isopropanol and was read by absorbance at 595 nm using a microplate reader. The percent viability was calculated as the ratio of absorbance of treated group divided by the absorbance of control group, and then multiplied by 100.
Lipid accumulation by oil red O staining
To examine the effect of coffee fruit extracts and their active compounds on lipid accumulation, 3T3-L1 cells were treated with various concentrations of coffee fruits extracts (200,400, 800, and 1000 μg/mL) in differentiation media or maturation media starting at day 0 until the end of the experiment days (day 10). Cells were washed twice with ice-cold PBS and fixed with 10% (v/v) formalin for 1 h. Cells were then rinsed with 60 % isopropanol and stained with Oil red O working solution for 10 min. The staining of lipid droplets in adipocytes was rinsed three times with PBS and then was observed under an inverted microscope. Stained oil droplets were extracted with 100% isopropanol and absorbance was measured at 510 nm using a microplate reader.
Measurement of lipolysis by glycerol assay
Lipolytic activity of coffee fruit extracts and their active compounds was performed by measuring their ability to release glycerol from mature adipocytes. Briefly, adipocytes cells were fasting with glucose-and serum-free medium overnight. Cells were washed twice with PBS and further incubated with various concentrations of coffee fruits extract (200, 400, and 800 μg/mL) or isoproterenol (10 μM) (lipolysis inducer) in Hang’s buffer for 4 h. Medium was collected for measuring the glycerol release by colorimetric assay (adipolysis assay kit) using absorbance at 570 nm.
Statistical analysis
All data were represented as mean ± standard error of the mean (SEM) of at least three separate experiments. The statistical analysis was analyzed by Kruskal-Wallis test or analysis of variance (ANOVA) followed by Bonferroni multiple comparison tests. P values less than 0.05 were considered to be statistically significant.
RESULTS AND DISCUSSIONS
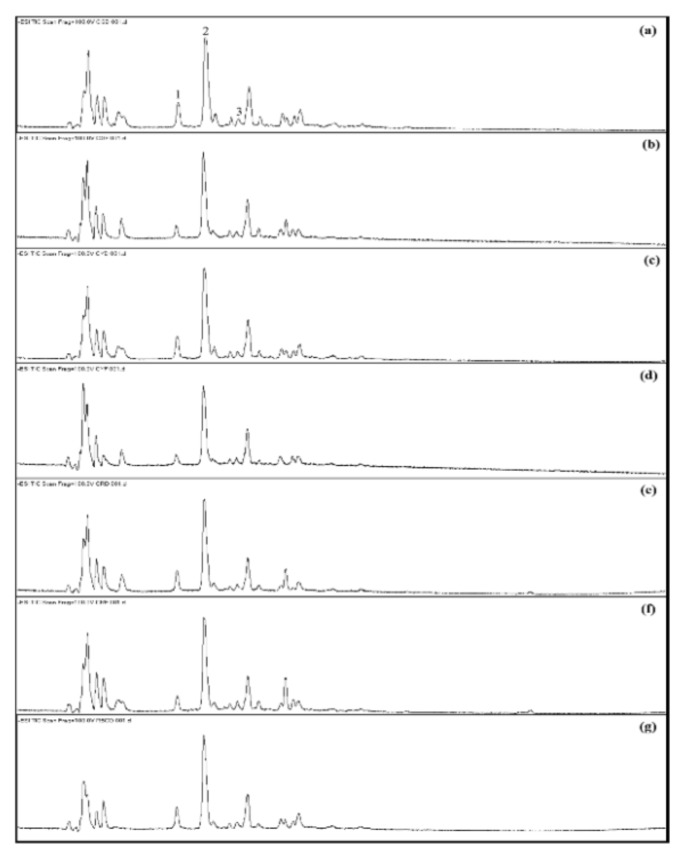
The separation of chemical constituents of seven coffee fruit extracts (coffee green dry (CGD), coffee green fresh (CGF), coffee yellow dry (CYD), coffee yellow fresh (CYF), coffee red dry (CRD), coffee red fresh (CRF), and coffee red bean dry (CRBD)) were achieved using reverse phase C-18 column with gradient acetonitrile under acidic condition as mobile phase. The total ion chromatograms (TIC) of tested samples were obtained with the negative ionization mode (Figure 1).
Figure 1.
Total ion current (TIC) chromatograms of coffee fruit extracts (a) CGD, (b) CGF, (c) CYD, (d) CYF, (e) CRD, (f) CRF, (g) CRBD.Monitored in negative ionization-mode. The peak numbers and compounds identification were summarized in Table I.
The results demonstrated that all extracts displayed similar chromatographic profiles. In this study, three active compounds (caffeic acid, chlorogenic acid and caffeoylquinic acid) were mainly focused. The retention time values (tR) and m/z, [M-H]− obtained with individual compounds are summarized in Table I.
Table I.
Retention time and molecular ion mass (m/z) of three marker compounds obtained from LC-ESI-QTOF-MS.
| Peak no. | retention time (tR, min) | m/z, [M-H]− | compounds |
|---|---|---|---|
| 1 | 7.44 | 353.0737 | caffeoylquinic acid |
| 2 | 8.75 | 353.0737 | chlorogenic acid |
| 3 | 10.39 | 179.0239 | caffeic acid |
Peak 1 and 2 showed the same molecular ion [M-H]− at m/z 353.0373. With the aid of available commercials standard, it was possible to identify Peak 2 as chlorogenic acid while the other compound, peak 1, was identified as an isomer, caffeoylquinic acid by comparing the fragmentation pattern with spectrometric characteristics previously reported in literatures (10, 16). For Peak 3, this compound conclusively identified by comparing retention time and mass spectra with that of commercial standards. It showed molecular ion [M-H]− at m/z 179.0239 and identified as caffeic acid. Contents of three marker compounds in seven extracts were calculated based on their peak area and are shown in Table II.
Table II.
Contents of marker compounds in different coffee fruit extract. The experiments were done in triplicate and the data are express as mean ± SEM
| Samples | Content of marker compound (mg/100 mg of extract, %w/w) | |||
|---|---|---|---|---|
|
| ||||
| caffeoylquinic acida | chlorogenic acid | caffeic acid | total | |
| CGD | 0.433±0.055** | 0.955±0.036 | 0.026±0.001+++ | 1.414±0.090 |
| CGF | 0.169±0.038 | 1.036±0.181 | 0.008±0.002 | 1.212±0.210 |
| CYD | 0.313±0.022 | 0.633±0.023 | 0.026±0.003+++ | 0.971±0.047 |
| CYF | 0.252±0.054 | 1.093±0.049*** | 0.011±0.002 | 1.355±0.012 |
| CRD | 0.339±0.072 | 0.721±0.137 | 0.021±0.003 | 1.081±0.207 |
| CRF | 0.204±0.017 | 0.697±0.106 | 0.008±0.001 | 0.909±0.114 |
| CRBD | 0.558±0.050 | 1.256±0.027 | 0.025±0.003 | 1.839±0.074* |
Remark:
equivalent to mg of chlorogenic acid,
p <0.05 vs. the other extract in total marker compound contents,
p<0.05 vs. the same color in caffeoylquinic acid,
p<0.05 vs. the same color in chlorogenic acid,
p<0.05 vs. the same color in caffeic acid.
Determination of caffeoylquinic acid content was calculated by equivalent to mg of chlorogenic acid. All results were expressed as mg of interested compound/100 g extract (%w/w). Among all tested extracts, the coffee red bean dry (CRBD) significantly showed the highest content of total marker compounds (1.839±0.129 mg/100 g of extract). Moreover, the total content in CYF also showed significantly different from that of CYD. However, the content of total marker compounds of each group of coffee fruit extracts (fresh or dry extracts) showed no significant difference among groups. A similar variation profile could also be observed in all coffee fruit extracts, the content of chlorogenic acid > caffeoylquinic acid > caffeic acid, respectively. Interestingly, caffeoylquinic acid content in CGD was significantly higher than CGF, while CYF found chlorogenic acid more than CYD. Additionally, CGD and CYD displayed caffeic acid greater than that CGF and CYF, respectively. Our result revealed that CRBD extract contains the highest content of total marker compounds. The variation in the content of constituents might lead to the variation of therapeutic effects.
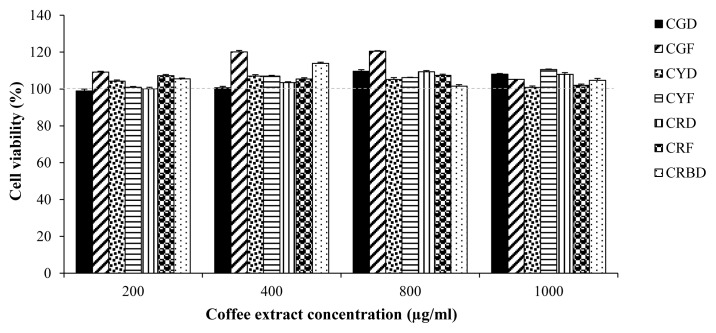
To determine the suitable concentration of coffee fruit extracts (CGD, CGF, CYD, CYF, CRD, CRF, and CRBD) on 3T3-L1 preadipocyte cells, cell viability was studied using MTT method. Treating with 200,400, 800, and 1000 μg/mL of extracts for 24 h had no effect on cell viability (Figure 2).
Figure 2.
Cytotoxic effects of coffee fruit extracts on 3T3-L1 cells. Cell viability was measured by MTT assays. 3T3-L1 cells were treated with different concentrations (200,400, 800, and 1000 μg/mL) of coffee fruit extracts for 24 h. Data are expressed as Mean±SEM, (N=3).
Based on these results, further investigations were carried out at a concentration ranges. In this study, we investigated the antiobesity effect by regulated adipogenesis and lipolysis of many colors of coffee fruit extracts in 3T3-L1 adipocytes. Excessive energy not only leads to obesity but also increases the number and size of adipocytes that triacylglycerols (TAG) accumulation. Fat accumulation is regulated by the balance between lipogenesis and lipolysis of TAG (3). Lipogenesis is a process that occurs preferentially in adipose tissue, stores excess energy as TAG (3, 17). Lipolysis is the catabolic process that occurs in adipose tissue, leading to the breakdown of TAG into free fatty acids and glycerol (18). Up to date, there are few data on adipogenesis and lipolysis of raw coffee fruit.
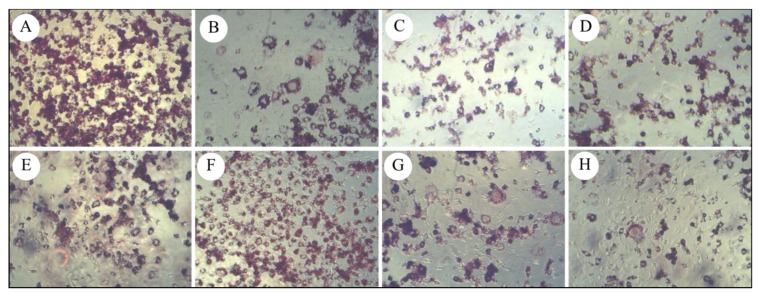
To examine the anti-adipogenic effects of coffee fruit extracts, lipid accumulation in adipocytes was examined quantitatively and qualitatively with Oil Red O staining. 3T3-L1 cells were treated with various concentrations of the extracts (200,400, 800, and 1000 μg/mL) during the process of differentiation (Day 0 – Day 1) to maturation (Day 2 – Day 10) for 10 days. Based on microscopic observation, the Oil-red O staining revealed a reduction in the number of lipid droplets in the presence of all coffee fruit extracts (CGD, CGF, CYD, CYF, CRD, CRF, and CRBD) at 800 μg/mL as shown in Figure 3.
Figure 3.
Coffee fruit extracts on lipid accumulation in adipocytes cells. Cells were treated with or without coffee fruit extracts (800 μg/mL); (A) Control, (B) CGD, (C) CGF, (D) CYD, (E) CYF, (F) CRD, (G) CRF, (H) CRBD. Cells were stained with Oil Red O and observed under the microscope (10X).
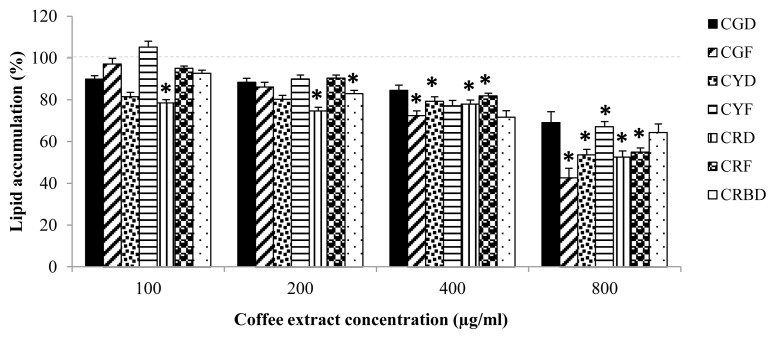
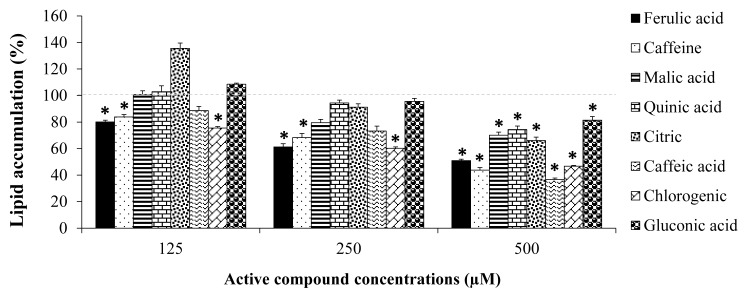
The presence of CRD extracts significantly decreased the lipid droplet content approximately 47% (Figure 4). 3T3-L1 cells treated with CGF, CYD, and CRF at 400 μg/mL and 800 μg/mL significantly reduced lipid accumulation compared to untreated cells. Significant reduction in lipid accumulation was observed in cells treated with 200 μg/mL of CRBD (Figure 4). Moreover, their active compounds showed inhibitory effect on lipid accumulation of 3T3-L1 cells by approximately 63% inhibition as shown in Figure 5.
Figure 4.
Lipid accumulation in 3T3-L1 cells treated with various coffee fruit extracts concentrations (100, 200, 400, and 800 μg/mL) for ten days. The results represent as Mean±SEM, (N=4). * indicates significant differences at p < 0.05
Figure 5.
Lipid accumulation in 3T3-L1 cells treated with active compounds (125, 250, and 500 μM) for ten days. The results represent as Mean±SEM, (N=3). * indicates significant differences at p < 0.05.
The present study demonstrated that the different colors of raw coffee fruit possessed inhibitory adipogenesis activity in 3T3-L1 cells. Maki et al. reported that coffee has effectively prevented HFD-induced obesity (15). They showed that roasted coffee intake was significantly decreased in body weight, glucose, free fatty acid, total cholesterol, and insulin levels in the blood. They also found that coffee extract reduced the accumulation of adipose tissue (epididymal fat, retroperitoneum fat, and mesenteric fat) in mice and inhibited adipogenesis in 3T3-L1 preadipocytes (15). Aoyagi et al. supported that coffee reduced lipids accumulation during adipocytic differentiation of 3T3-L1 cells by suppressing, the peroxisome proliferator-activated receptor γ (PPARγ), the expression of a transcription factor controlling the differentiation of adipocytes and some differentiation marker genes (adiponectin (aP2), CCAAT-enhancer-binding protein α (C/EBPα), glucose transporter 4 (GLUT4), and lipoprotein lipase (LPL) during adipocyte differentiation (19). It have been reported that raw green coffee beans extract decreased perirenal and epididymal white adipose tissue weights, and triglyceride level low in serum and liver in rat (20). Previous studies evidence that coffee contains several compounds including several micronutrients (8), chlorogenic, caffeic, and ferulic acid, trigonelline, and caffeine (9, 10). Raw green coffee beans are rich in caffeine, chlorogenic acid, quinic acid, caffeic acid, and p-coumaric acid, while roasting raw coffee beans reduces the caffeine and chlorogenic acid contents (20, 21). Our results are in agreement with those of other authors who showed that their active compounds of coffee suppress of lipid accumulation. It have been reported that caffeine did not effect on the differentiation of 3T3-L1 pre-adipocytes to mature adipocytes, but it suppressed the accumulation of lipid during mature adipocytes (22). Chlorogenic acid, gallic acid, o-coumaric acid and m-coumaric acid were suggested to have antiobesity effects by decreasing preadipocyte proliferation and causing cell cycle arrest in the G1 phase (23). Alam et al. provided evidence that hydroxycinnamic acid derivatives (cinnamic acid, p-coumaric acid, ferulic acid, caffeic acid, chlorgenic acid, rosemarinic acid) prevent adipocyte differentiation and decrease lipid profile in animal models (24). Caffeic acid and chlorogenic acid decreased body weight, visceral fat mass and plasma leptin and insulin levels and also inhibited fatty acid synthase, 3-hydroxy-3-methylglutaryl CoA reductase and acyl-CoA:cholesterol acyltransferase activities in liver in high-fat diet induced obese mice (25). Liao et al. suggested that caffeic acid demonstrated a potential as an anti-obesity agent by suppression of body weight, visceral fat mass, lipogenic enzymes and hepatic lipid accumulation (26). O-coumaric acid inhibited intracellular triglyceride, glycerol-3-phosphate dehydrogenase (GPDH) activity in 3T3-L1 adipocytes (27). O-coumaric acid was suggested to have anti-adipogenesis mediated through the down-regulated expression of adipogenic transcription factors (PPARγ and C/EBPR) and adipocyte-specific proteins (leptin), and then the up-regulated expression of adiponectin (27). O-coumaric acid also decreased body weight, liver organ, and adipose tissue weights of peritoneal and epididymal fat pads in high fat diet rats (28). Therefore, it is possible that anti-adipogenic activity may be effects of these active compounds in extracts.
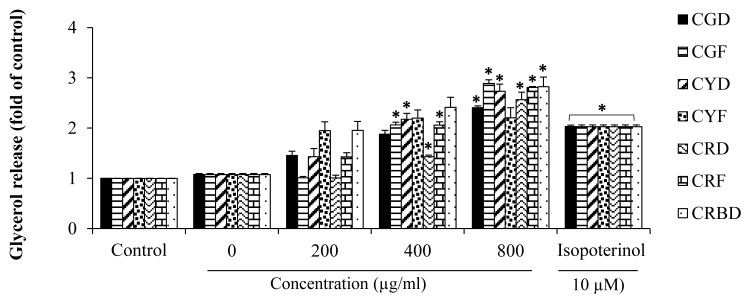
To explore whether these colors of coffee extract also influence on lipolysis effects, glycerol release in culture medium were measured. Normally, the releasing of glycerol from cells into culture was used as a marker of adipocyte lipolysis. Isoproterenol, a β-adrenergic agonist and a lipolysis stimulating agent, was used as a positive control. 3T3-L1 cells were treated with various coffee fruit extracts concentrations (200, 400, and 800 μg/mL) for 4h. The content of free glycerol release in cell culture medium in the 3T3-L1 adipocytes was determined. Our results demonstrated that all coffee fruit extract except CYF increased glycerol release when compared with that the untreated cells as shown in Figure 6.
Figure 6.
Stimulatory effect of various coffee fruit extracts on glycerol release in 3T3-L1 adipocytes. The values were calculated as fold of control of free glycerol content of the differentiated control cells (untreated). Cells were treated with extracts concentrations (200, 400, and 800 μg/mL) for 4 h. Each value is expressed as Mean ± SEM, (N=3). P < 0.05 considered as statistically significant difference.
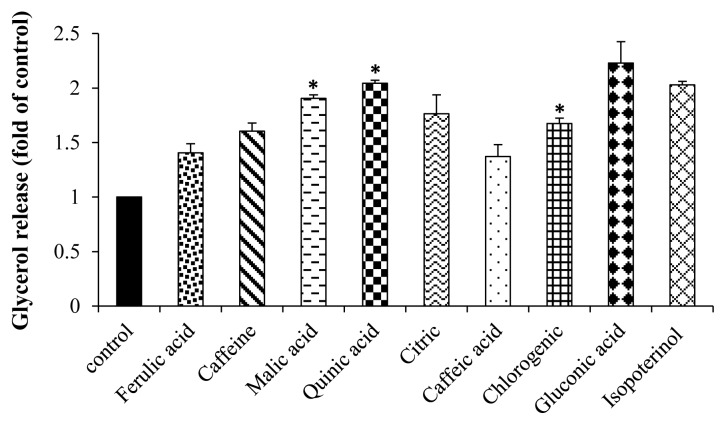
Furthermore, their active compounds (200 μM) on glycerol release were also determined. We found that malic, quinic, chlorogenic acid were significantly increased glycerol release when compared with control as shown in Figure 7. It can be suggested that the decreased glycerol release treated with coffee fruit extract may be the effects of their active compounds, especially malic, quinic, chlorogenic acid.
Figure 7.
Stimulatory effect of active compounds on glycerol release in 3T3-L1 adipocytes. The values were calculated as fold of control of free glycerol content of the differentiated control cells (untreated). Cells were treated with active compounds (200 μM) for 4 h. Each value is expressed as Mean±SEM, (N=3). *indicates significant differences compared to control group at p < 0.05.
Our study provides the first evidence that each color of coffee fruits extracts stimulated different liberation of glycerols in 3T3-L1 adipocytes. Thus, these colors of coffee fruits extracts have lipolytic properties and could be a potential candidate in stimulation of lipolysis in adipose tissue. In addition, we found that their major compounds (malic, quinic, and chlorogenic acid) increased glycerol release. It can be suggesting that a mechanism of these active compounds may contribute to lipolytic activity of these different colors of coffee extract as well. Sung et al. have shown that caffeine 0.05% intake for ten weeks reduced weights of liver, epididymal and retroperitoneal adipose tissues, kidney, testis, and spleen in obese mice (29). Caffeine has been reported to enhance noradrenaline-induced lipolysis in fat cells (30). Caffeine (1.0 mg/mL) and chlorogenic acid (0.1 and 1.0 mg/mL) have a lipolytic activity by releasing of free fatty acids from human adipocytes (31).
CONCLUSIONS
In conclusion, our data reveal that coffee fruits suppressed the accumulation of droplets and promoted production of lipolysis. We suggest that each coffee fruits color may have future application in antiobesity and may decrease the risk of other chronic diseases. However, research on mechanisms of molecular pathways underlying the antiadipogenic and lipolytic properties and antiobesity effects in vivo need to be further explored.
ACKNOWLEDGEMENTS
This work was supported by the University of Phayao, Phayao, Thailand under grant [RD60076]; National Research Council of Thailand (NRCT); and a talent mobility program 2016, office of the higher education commission, and national science technology and innovation policy office, Thailand.
Footnotes
DECLARATION OF INTEREST
The authors report no conflicts of interest. The authors alone are responsible for the content and writing of this article.
REFERENCES
- 1.Jocken JW, Goossens GH, Blaak EE. Targeting adipose tissue lipid metabolism to improve glucose metabolism in cardiometabolic disease. European Medical Journal Diabetes. 2014;2:73–82. [Google Scholar]
- 2.Hall KD, Heymsfield SB, Kemnitz JW, Klein S, Schoeller DA, Speakman JR. Energy balance and its components: implications for body weight regulation. The American Journal of Clinical Nutrition. 2012;95(4):989–94. doi: 10.3945/ajcn.112.036350. [DOI] [PMC free article] [PubMed] [Google Scholar]
- 3.Coelho M, Oliveira T, Fernandes R. Biochemistry of adipose tissue: an endocrine organ. Archives of Medical Science. 2013;9(2):191–200. doi: 10.5114/aoms.2013.33181. [DOI] [PMC free article] [PubMed] [Google Scholar]
- 4.Liou CJ, Lai XY, Chen YL, Wang CL, Wei CH, Huang WC. Ginkgolide C suppresses adipogenesis in 3T3-L1 adipocytes via the AMPK signaling pathway. Evidence-Based Complementary and Alternative Medicine. 2015 doi: 10.1155/2015/298635. [DOI] [PMC free article] [PubMed] [Google Scholar]
- 5.Roh C, Jung U. Screening of crude plant extracts with anti-obesity activity. International Journal of Molecular Sciences. 2012;13(2):1710–9. doi: 10.3390/ijms13021710. [DOI] [PMC free article] [PubMed] [Google Scholar]
- 6.Pheiffer C, Dudhia Z, Louw J, Muller C, Joubert E. Cyclopia maculata (honeybush tea) stimulates lipolysis in 3T3-L1 adipocytes. Phytomedicine. 2013;20(13):1168–71. doi: 10.1016/j.phymed.2013.06.016. [DOI] [PubMed] [Google Scholar]
- 7.Hsu HK, Yang YC, Hwang JH, Hong SJ. Effects of Toona sinensis leaf extract on lipolysis in differentiated 3T3-L1 adipocytes. The Kaohsiung Journal of Medical Sciences. 2003;19(8):385–9. doi: 10.1016/S1607-551X(09)70481-4. [DOI] [PubMed] [Google Scholar]
- 8.Higdon JV, Frei B. Coffee and health: a review of recent human research. Critical reviews in Food Science and Nutrition. 2006;46(2):101–23. doi: 10.1080/10408390500400009. [DOI] [PubMed] [Google Scholar]
- 9.Farah A, Donangelo CM. Phenolic compounds in coffee. Brazilian Journal of Plant Physiology. 2006;18(1):23–36. [Google Scholar]
- 10.Duangjai A, Suphrom N, Wungrath J, Ontawong A, Nuengchamnong N, Yosboonruang A. Comparison of antioxidant, antimicrobial activities and chemical profiles of three coffee (Coffea arabica L.) pulp aqueous extracts. Integrative Medicine Research. 2016;5(4):324–31. doi: 10.1016/j.imr.2016.09.001. [DOI] [PMC free article] [PubMed] [Google Scholar]
- 11.Sousa C, Gabriel C, Cerqueira F, Manso M, Vinha A. Coffee industrial waste as a natural source of bioactive compounds with antibacterial and antifungal activities. Formatex. 2015:131–36. [Google Scholar]
- 12.Yashin A, Yashin Y, Wang JY, Nemzer B. Antioxidant and antiradical activity of coffee. Antioxidants. 2013;2(4):230–45. doi: 10.3390/antiox2040230. [DOI] [PMC free article] [PubMed] [Google Scholar]
- 13.Patay ÉB, Bencsik T, Papp N. Phytochemical overview and medicinal importance of Coffea species from the past until now. Asian Pacific Journal of Tropical Medicine. 2016;9(12):1127–35. doi: 10.1016/j.apjtm.2016.11.008. [DOI] [PubMed] [Google Scholar]
- 14.Choi BK, Park SB, Lee DR, Lee HJ, Jin YY, Yang SH, et al. Green coffee bean extract improves obesity by decreasing body fat in high-fat diet-induced obese mice. Asian Pacific Journal of Tropical Medicine. 2016;9(7):635–43. doi: 10.1016/j.apjtm.2016.05.017. [DOI] [PubMed] [Google Scholar]
- 15.Maki C, Funakoshi-Tago M, Aoyagi R, Ueda F, Kimura M, Kobata K, et al. Coffee extract inhibits adipogenesis in 3T3-L1 preadipocyes by interrupting insulin signaling through the downregulation of IRS1. PloS one. 2017;12(3):e0173264. doi: 10.1371/journal.pone.0173264. [DOI] [PMC free article] [PubMed] [Google Scholar]
- 16.Bravo L, Goya L, Lecumberri E. LC/MS characterization of phenolic constituents of mate (Ilex paraguariensis, St. Hil.) and its antioxidant activity compared to commonly consumed beverages. Food Research International. 2007;40(3):393–405. [Google Scholar]
- 17.Saponaro C, Gaggini M, Carli F, Gastaldelli A. The subtle balance between lipolysis and lipogenesis: a critical point in metabolic homeostasis. Nutrients. 2015;7(11):9453–74. doi: 10.3390/nu7115475. [DOI] [PMC free article] [PubMed] [Google Scholar]
- 18.Frühbeck G, Méndez-Giménez L, Fernández-Formoso JA, Fernández S, Rodríguez A. Regulation of adipocyte lipolysis. Nutrition Research Reviews. 2014;27(1):63–93. doi: 10.1017/S095442241400002X. [DOI] [PubMed] [Google Scholar]
- 19.Aoyagi R, Funakoshi-Tago M, Fujiwara Y, Tamura H. Coffee inhibits adipocyte differentiation via inactivation of PPARγ. Biological and Pharmaceutical Bulletin. 2014;37(11):1820–5. doi: 10.1248/bpb.b14-00378. [DOI] [PubMed] [Google Scholar]
- 20.Tanaka K, Nishizono S, Tamaru S, Kondo M, Shimoda H, Tanaka J, et al. Anti-obesity and hypotriglyceridemic properties of coffee bean extract in SD rats. Food Science and Technology Research. 2009;15(2):147–52. [Google Scholar]
- 21.del Castillo MD, Ames JM, Gordon MH. Effect of roasting on the antioxidant activity of coffee brews. Journal of Agricultural and Food Chemistry. 2002;50(13):3698–703. doi: 10.1021/jf011702q. [DOI] [PubMed] [Google Scholar]
- 22.Nakabayashi H, Hashimoto T, Ashida H, Nishiumi S, Kanazawa K. Inhibitory effects of caffeine and its metabolites on intracellular lipid accumulation in murine 3T3-L1 adipocytes. Biofactors. 2008;34(4):293–302. doi: 10.3233/BIO-2009-1083. [DOI] [PubMed] [Google Scholar]
- 23.Hsu CL, Huang SL, Yen GC. Inhibitory effect of phenolic acids on the proliferation of 3T3-L1 preadipocytes in relation to their antioxidant activity. Journal of Agricultural and Food Chemistry. 2006;54(12):4191–7. doi: 10.1021/jf0609882. [DOI] [PubMed] [Google Scholar]
- 24.Alam MA, Subhan N, Hossain H, Hossain M, Reza HM, Rahman MM, et al. Hydroxycinnamic acid derivatives: a potential class of natural compounds for the management of lipid metabolism and obesity. Nutrition & Metabolism. 2016;13(1):27. doi: 10.1186/s12986-016-0080-3. [DOI] [PMC free article] [PubMed] [Google Scholar]
- 25.Cho AS, Jeon SM, Kim MJ, Yeo J, Seo KI, Choi MS, et al. Chlorogenic acid exhibits anti-obesity property and improves lipid metabolism in high-fat diet-induced-obese mice. Food and Chemical Toxicology. 2010;48(3):937–43. doi: 10.1016/j.fct.2010.01.003. [DOI] [PubMed] [Google Scholar]
- 26.Liao CC, Ou TT, Wu CH, Wang CJ. Prevention of diet-induced hyperlipidemia and obesity by caffeic acid in C57BL/6 mice through regulation of hepatic lipogenesis gene expression. Journal of Agricultural and Food Chemistry. 2013;61(46):11082–8. doi: 10.1021/jf4026647. [DOI] [PubMed] [Google Scholar]
- 27.Hsu CL, Yen GC. Effects of flavonoids and phenolic acids on the inhibition of adipogenesis in 3T3-L1 adipocytes. Journal of Agricultural and Food Chemistry. 2007;55(21):8404–10. doi: 10.1021/jf071695r. [DOI] [PubMed] [Google Scholar]
- 28.Hsu CL, Wu CH, Huang SL, Yen GC. Phenolic compounds rutin and o-coumaric acid ameliorate obesity induced by high-fat diet in rats. Journal of Agricultural and Food Chemistry. 2009;57(2):425–31. doi: 10.1021/jf802715t. [DOI] [PubMed] [Google Scholar]
- 29.Sung JH, Chon JW, Lee M, Park JK, Woo JT, Park YK. The anti-obesity effect of Lethariella cladonioides in 3T3-L1 cells and obese mice. Nutrition Research and Practice. 2011;5(6):503–10. doi: 10.4162/nrp.2011.5.6.503. [DOI] [PMC free article] [PubMed] [Google Scholar]
- 30.Han L, Takaku T, Li J, Kimura Y, Okuda H. Anti-obesity action of oolong tea. International Journal of Obesity & Related Metabolic Disorders. 1999;23(1) doi: 10.1038/sj.ijo.0800766. [DOI] [PubMed] [Google Scholar]
- 31.Flanagan J, Bily A, Rolland Y, Roller M. Lipolytic activity of Svetol®, a decaffeinated green coffee bean extract. Phytotherapy Research. 2014;28(6):946–8. doi: 10.1002/ptr.5085. [DOI] [PubMed] [Google Scholar]


