

Abstract
How animals visually perceive the environment is key to understanding important ecological behaviors, such as predation, foraging, and mating. This study focuses on the visual system properties and visual perception of color in the largemouth bass Micropterus salmoides. This study (1) documents the number and spectral sensitivity of photoreceptors, (2) uses these parameters to model visual perception, and (3) tests the model of color perception using a behavioral assay. Bass possess single cone cells maximally sensitive at 535 nm, twin cone cells maximally sensitive at 614 nm, and rod cells maximally sensitive at 528 nm. A simple model of visual perception predicted that bass should not be able to discern between chartreuse yellow and white nor between green and blue. In contrast, bass should be able to discern red from all achromatic (i.e., gray scale) stimuli. These predictions were partially upheld in behavioral trials. In behavioral trials, bass were first trained to recognize a target color to receive a food reward, and then tested on their ability to differentiate between their target color and a color similar in brightness. Bass trained to red and green could easily discern their training color from all other colors for target colors that were similar in brightness (white and black, respectively). This study shows that bass possess dichromatic vision and do use chromatic (i.e., color) cues in making visual-based decisions.
Keywords: bass, cones, photoreceptors, rods, vision
Many behaviors rely on visual cues, including predation, mating, and foraging (Loew and Lythgoe 1978; Endler 1992; Kemp et al. 2015; Rosenthal 2017). Thus, understanding visual capabilities is essential for understanding visual-based behavior. However, the difficulty is that animal taxa often vary in the visual system properties underlying visual perception. The way one animal perceives a scene is different than another species, and this is particularly so for fish. Even among relatively shallow, diurnal species, fish vary in the number of photoreceptors that they use ranging from as few as 2 to as many as 5 or more (Partridge and Cummings 1999; Fuller et al. 2003; Land and Nilsson 2012; Cronin et al. 2014). These photoreceptors vary in the wavelengths of light to which they are most sensitive with some species being sensitive well into the UV range and others lacking sensitivity in the UV and violet range (Losey et al. 1999). In addition, the spectral sensitivity of the photopigment found in the cones can also be altered by changes in chromophore usage. Photopigment (which absorbs light) is created by combining an opsin protein with a chromophore derived from a vitamin A molecule (either retinal: A1 or 3-dehydroretinal: A2). Shifting from A1 to A2 increases the wavelengths to which the photopigment is maximally sensitive (Bridges 1972; Munz and McFarland 1973; Loew and Dartnall 1976). Fish also vary in the arrangements of photoreceptors within their retinas (Ali and Anctil 1976). In sum, fish vision is highly variable.
Variation in the perception of visual cues is also complicated by the fact lighting environments vary dramatically in aquatic habitats. Lighting environments can vary due to the effects of water depth, algae, turbidity, dissolved organic matter, and time of day (Lythgoe 1968; Sondergaard and Thomas 2004; Johnsen and Mobley 2012; Cronin et al. 2014). This alters (1) the visual backgrounds against which objects are viewed, (2) the irradiance spectrum that illuminates objects and determines the inherent radiance reflected from an object, and (3) the transmission of the reflected radiance between an object and the viewer (Endler 1990). Hence, variation in visual system properties and variation in lighting environments make it difficult to predict how different fish species perceive visual cues in their habitats.
Visual detection models have been developed to estimate visual perception in non-human animals (reviewed in: Kelber and Osorio 2010). Specifically, visual detection models can provide species’-specific predictions about the ability to detect and discriminate between different colors in different lighting environments. Predicting visual perception in non-human animals requires—at minimum—knowledge of the number and spectral sensitivities of the various photoreceptor classes, the lighting environment, and the reflectance spectra of objects in a visual scene. The model predictions can then be tested by directly measuring the visual abilities of other species using behavioral assays. Animals are first trained to perform a particular task related to a color (e.g., pick a colored lever and strike a colored pipette). Subsequent tests are then used to determine the conditions under which animals can and cannot do the task (Vorobyev and Osorio 1998; Gerber et al. 2004; Hori et al. 2006; Champ et al. 2016). These types of behavioral assays are informative because they allow researchers to ask questions such as the following: What are the visual capabilities of an organism? Does the ability to discern among visual stimuli match predictions from mathematical models of visual detection? Does the organism truly use color (i.e., chromatic signals due to differential stimulation of cones)? In other words, can an animal discern a visual stimulus, such as red, from an alternate achromatic (i.e., gray scale) stimulus with identical brightness?
In this study, we modeled and behaviorally tested color vision in Micropterus salmoides (largemouth bass), an ecologically and economically important fish species. Micropterus salmoides is a visually oriented top predator in many freshwater systems and is one of the top sport fishes in the United States. (Schramm et al. 1991; Chen et al. 2003; Cooke and Philipp 2009). Despite their importance, little is known about the visual abilities of largemouth bass. Previous studies suggested that M. salmoides has dichromatic vision with cone cells and that its color vision is highly sensitive to red (Kawamura and Kishimoto 2002). These studies were based on electroretinogram readings, but did not directly measure the spectral sensitivity of the actual photoreceptors and did not verify these with behavioral assessment. Numerous studies have also examined the influences of coloration and water quality on bass prey/lure selection (Carter et al. 2010; Huenemann et al. 2012; Moraga et al. 2015; Shoup and Lane 2015). Such studies provide valuable insights on preference, but are more limited in their ability to predict bass visual capabilities.
Defining a baseline for color detection in largemouth bass is essential due to the variability of light habitat these fish occupy. Aquatic ecosystems are highly variable based on time of day, depth, and shade (Johnsen and Mobley 2012). Concurrently, bass are found in varying levels of water clarity (McMahan and Holanov 1995; Huenemann et al. 2012). Bass from these varying habitat types may subsequently vary in their visual sensitivities; however, this remains untested prior to this study.
Notably, early study of bass vision was conducted by Brown (1937). Brown (1937) trained bass to approach pipettes painted with particular colors (red, yellow, green, white, black, gray, etc.) using a food reward when bass approached target colors and mild electric shocks when bass approached the non-target colors. He then determined whether the bass could correctly discern between different colors. He found that bass could readily discern both red and green from all other colors, but often had problems discerning yellow from white and blue from black colors. This study lacked modern statistics/replication and was unable to use spectrophotometers to parameterize visual models with measures of reflectance and light environment. Regardless, Brown (1937) clearly indicated that bass can be trained to visual stimuli and that such assays can inform on bass visual capabilities.
This study had 2 goals. The first was to characterize the bass visual system and determine whether it differed among populations/subspecies. Specifically, we sought to (1) characterize the number of photoreceptors in the bass visual system and their spectral sensitivities and (2) determine whether the photoreceptor sensitivities varied between 2 subspecies of bass: Micropterus salmoides salmoides (from IL) and Micropterus salmoides floridanus (from FL). To do this, we collected bass from Florida and Illinois and performed microspectrophotometry (MSP) where we measured the spectral sensitivities of cones and rods for many individuals from each collection site. The second goal was to determine which colors bass could discriminate and whether this matched the predictions from a simple model that was parameterized using our estimates of bass photoreceptor spectral sensitivities. Visual detection models provide predictions of opponency and brightness for the bass visual system. We used our model to identify target colors that look different to humans, but should appear similar to bass. We also used our model to identify colors that have similar values for opponency, but differ in brightness, to test whether bass use opponency as a visual cue. To test these predictions, we trained bass in the lab to approach and strike a specific target color and then asked whether they could discern their target color from other colors. We describe these studies below.
Materials and Methods
Microspectrophotometry
We obtained adult bass from 2 populations, one from Florida and the other from Illinois. Bass from the Florida population (n = 4) belonged to the subspecies M. s. floridanus and were collected by seine net from the Everglades at 26-Mile Bend, Broward County, FL, in March 2013. Bass from the Illinois population (n = 5) belonged to the subspecies M. s. salmoides and were collected by electroshock from Lake Shelbyville, Moultrie County, IL, in June 2013. The fishes were housed in stock tanks in a temperature-controlled greenhouse with natural light and natural light: dark cycles at the University of Illinois. They were fed daily ad libitum with live feeder fish and bass pellets.
For MSP, the fish were dark adapted for 24 h, euthanized in 1% buffered tricaine methanesulfonate (MS-222) solution, and decapitated. The sexes are not dimorphic in coloration. We did not dissect the fish to determine whether the individuals were male or female. The heads were packed in ice and immediately transported to Cornell University, Ithaca, NY, in July 2013. All MSP procedures were carried out under infrared light and follow methods previously detailed in Provencio et al. (1992), Loew (1994), and Loew et al. (2002). Briefly, enucleated eyes were hemisected and pieces of retina were immersed in a simple Sorensen’s phosphate buffer (pH 7.2) with 6% sucrose added. The retinas were carefully teased from the retinal pigment epithelium and macerated using razor blade fragments and tungsten needles. A drop of the dispersed retina was sandwiched between 2 cover slips and transferred to the stage of the microspectrophotometer. Absorbance was recorded from the outer segments of single photoreceptor cells in 1 nm intervals from 350 to 750 nm.
Template fitting was used to determine λmax (the wavelength at maximum absorbance for a template-derived visual pigment best fitting the experimental data). Whether the absorbance curves best fit an A1 or an A2 template was determined via an Excel program created by Juliet Parry, which solved for the value of λmax that minimizes deviations from visual pigment templates described by Govardovskii et al. (2000). The normalized absorbance values of each photoreceptor cell was fitted to both A1 and A2 templates, and the template (A1 or A2) with the least deviation from expected values (as measured by χ2) was taken as the best fit for the given cell (example cells with fitted templates are shown in Results - Microspectrophotometry). Analyses of variance (ANOVA) were used to compare λmax values for each photoreceptor cell type between the Florida and Illinois bass, with individuals nested within populations. All statistical tests were conducted in R version 3.0.3.
Visual modeling
Our goal here was to test a simple model of bass visual discrimination. To do this, we created a model that allowed us to predict which colors should appear similar to bass. We use the term “colors” loosely here to refer to different visual stimuli. We then trained bass to approach particular colors by feeding them through colored pipettes to ask whether bass could correctly identify the color to which they had been trained versus an alternate color. Our model predicted that some colors that humans can easily distinguish should look similar to bass. We specifically chose target colors that bass should easily be able to discern and target colors that our model predicted should look similar to bass.
Husbandry
One hundred juvenile largemouth bass were obtained from a local hatchery and kept in a naturally lit greenhouse, maintained at 19 °C, located at the Natural Resource Studies Annex—University of Illinois—in September 2015. Hence, the bass were exposed to natural sunlight and experienced natural light: dark ratios. Bass were separated into 12, 568-L cattle tanks, and fed cichlid pellet food daily. Each tank was fastened with a UV-sterilizer and 4 sponge filters mediated by air pumps to ensure clear and healthy water. Two tanks were randomly selected to receive each training color treatment. The fish grew rapidly between September and November and were approximately 15 cm (6 inches) when we began training. By the end of our assays, the bass were subadults and ranged from 20 to 30 cm (8–12 inches) in standard length.
We note that the bass used in the MSP analysis were adults whereas the bass used in the behavioral assays were juveniles maturing into subadults. We assume that the findings for the MSP study are applicable for the behavioral assay study. However, we note that sunfish in the genus Lepomis is thought to possess UV photoreceptors as juveniles but lack UV photoreceptors as adults (Dearry and Barlow 1987; Hawryshyn et al. 1988; Losey et al. 1999; Leech and Johnsen 2006). The hypothesis is that these fish use UV vision to view zooplankton such as Daphnia during the juvenile stage but then lose this sensitivity as they switch to other foods. The age at which this happens in Lepomis is unknown. Whether such a scenario occurs in Micropterus, which is a close relative of Lepomis, is unknown. The visual systems of adult Lepomis are similar to that of Micropterus. Given the good match between our model predictions and the behavioral assays (particularly for yellow vs. white), we assume that the bass used in the behavioral assays had the visual system of adults.
Modeling color perception
A model of color perception was created that predicted the opponency and relative brightness of different target colors using the bass photoreceptor class sensitivities that were previously measured (see “Results” section). The model required estimates of the spectral sensitivity of the viewer (, the side-welling irradiance , and the reflectance of the object . Side-welling irradiance was measured with an Ocean Optics S2000 spectrophotometer with a UV-vis 400 micron diameter fiber patch cord and a terminal cosine corrector. The spectrophotometer was calibrated using an Ocean Optics calibrated DT-3000 light source the same day as which measurements were taken. Spectrophotometer was calibrated for the UV and short-wavelength range using the deuterium lamp, and then again for the middle to longer wavelengths using the tungsten lamp. The 2 calibration curves were subsequently combined. Measurements of were taken in the stock tanks with clear water at 3:00 PM in Fall 2015 when the bass were being trained. The reflectance of numerous colored targets (swatches of acrylic paint) was measured with a spectrophotometer connected to a reflectance probe (R200-7 probe, Ocean Optics Inc.) and a pulsed xenon lap (PX-200 Ocean Optics). Target reflectance was measured from 350 to 700 nm. A Labsphere® diffuse white spectral standard was used to calibrate the spectrophotometer. Some of the measurements had greater than 100% reflectance because they were brighter than our standard (see Figure 1). For reflectance, the measurements and calibrations were done with the reflectance probe held at a 45° angle to the object. For both the irradiance and reflectance measurements, the spectrophotometer was connected to a laptop and run using SpectraSuite Software (Ocean Optics).
Figure 1.
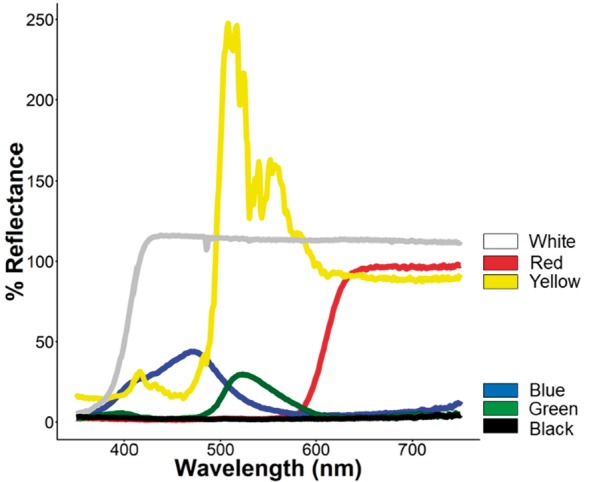
Reflectance spectra of colored cards used for training and behavioral assays.
For measures of relative brightness, we assumed that the red cones were responsible for brightness (see Results - Microspectrophotometry). Previous studies by Neumeyer et al. (1991) have shown that goldfish rely on red photoreceptors for brightness perception under conditions of high illumination, but rely on multiple photoreceptors for brightness perception under low illumination. In the results, we present the model predictions for the red cones. In the Supplementary Materials, we present the model predictions for a similar analysis assuming that both cone cell types contribute to brightness perception (see Cummings (2004) for a similar approach). The model predictions are qualitatively similar.
Both opponency and relative brightness required estimates photon-catch of the photoreceptors. Photon-catch is also affected by many properties of the eye (e.g., diameter of the pupil), but these parameters affect both the numerator and denominator for calculations of both relative brightness and opponency. Hence, they cancelled out of the equations. The photon-catch (P) for a given photoreceptor class (i) and given visual target (t) was calculated as follows:
| (1) |
where is the diffuse spectral sensitivity of receptor i; is wavelength; is side-welling irradiance; and is the reflectance of the target. Integration was over the visible light spectrum ranging from 350 to 700 nm.
For a given visual target (t), relative brightness was calculated as the sum of the photon-catch of the red photoreceptor divided by the brightness that would be created by a gray standard that reflects 25% of light from the white standard (B25) (see Baldwin and Johnsen (2012) for similar calculations). Hence, elative brightness (B) was calculated as the following:
| (2) |
Opponency was calculated as the difference in photon-catch between the 2 photoreceptor types relative to relative brightness for a given visual stimulus (R) as the following:
| (3) |
Opponency values ranged from negative to positive. Negative opponency indicates stimulation of mostly the green photoreceptor, and positive opponency indicates stimulation of mostly the red photoreceptor. Conversely, zero opponency occurs when there is equal stimulation of both photoreceptor types. Therefore, these target colors lack a chromatic signal and should be “colorless” to the viewer.
Selecting color targets
To test our model of bass vision, we chose target colors that fit 1 of 3 criteria: (1) high negative opponency (i.e., high stimulation of the green photoreceptor and low stimulation of the red photoreceptor), (2) low opponency (i.e., stimulated both photoreceptors equally), and (3) high positive opponency (i.e., high simulation of the red photoreceptor and low stimulation of the green photoreceptor). We also chose a “white” and a “black” target as previous work by Brown (1937) and our model (see Results) indicated that these bass may have difficulty distinguishing some colors from white and black. Ultimately, 6 training targets were identified, namely, green, chartreuse yellow, red, blue, white, and black (Figure 1). Our model predicted that chartreuse yellow would be difficult to discern from white and that blue and green might be difficult to discern from one another and from black. The model also indicated that red has particularly high opponency and should easily be discerned from any achromatic cues. The reflectance of the chartreuse yellow stimulus was greater than 100% because it reflected more light than the diffuse standard we used for our calibrations. This happened due to the fluorescent properties of chartreuse yellow, where UV photons are absorbed and then emitted at a longer wavelength (Johnsen and Mobley 2012; Mitchem and Fuller, unpublished data). However, our white training target also had a reflectance slightly greater than 100%. Regardless, our model indicated that these 2 visual stimuli should appear similar to the bass (Figure 2).
Figure 2.
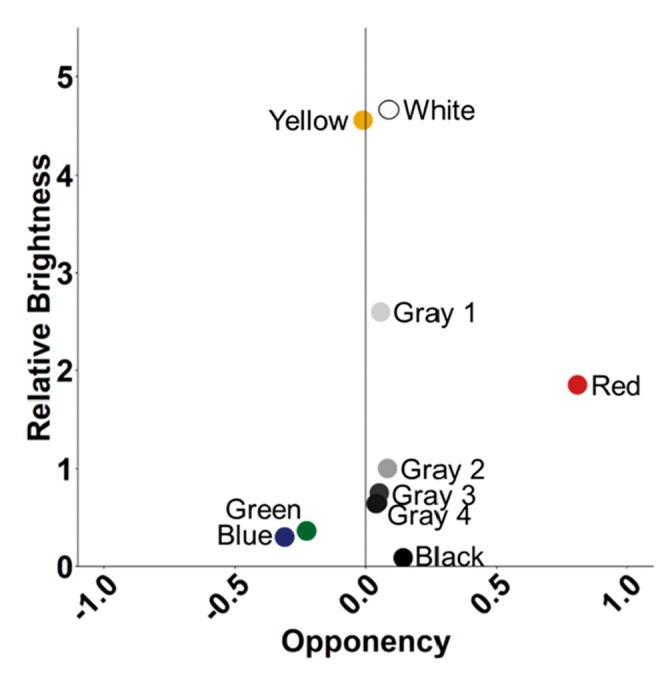
Opponency compared with relative brightness in M. salmoides visual detection model for training colors (chartreuse yellow, white, red, blue, green, and black) and achromatic stimuli used in assay 3 (white, gray 1, gray 2, gray 3, gray 4, gray 5, and black). If bass use only achromatic cues, then bass should be unable to distinguish red from gray 1 or gray 2, blue and green from gray 4/black, and yellow from white, as these stimuli have similar brightness.
We created color cards by applying acrylic paint to 10 cm × 10 cm stock paper, which were then laminated. We measured the reflectance of each card after lamination to ensure that reflectance spectra were still within the same range of previously measured colored swatches. We attached colored cards to large pipettes, which could be filled with pellet food to dispense for bass. Pipettes and colored cards were then fastened with adhesive Velcro.
Training to a single target
First, bass were trained to strike a single colored, target pipette. Here, the bass could presumably smell the food. Two stock tanks containing 6–7 bass were randomly selected to receive each training color treatment (6 training targets × 2 stock tanks = 12 stock tanks total). Preliminary training began by placing the training stimulus pipette in the tank and dispensing the food pellets. After 1 week of association, bass were required to approach strike at the training pipette to receive food. All bass in the tank were required to strike at the target before food was dispensed; however, food was always dispensed ∼30 s after the first bass struck at ensure learning. If no bass struck at the training pipette after 1 min, food was simply dispensed. Bass were trained once a day for 69 days (November 11, 2015–February 13, 2016). The collective action of the bass in each tank towards the training pipette (no approach, approach within 1 body length, or strike) was recorded each day. A tank was considered trained when all the bass in a tank were observed striking at the training stimulus for 7 consecutive days. Bass were continually fed using this method in the period prior to the next training procedure.
Training to discern among target colors
Bass were trained to discern their training target from all other targets presented simultaneously. For example, bass trained to approach red had to discern red from blue, black, green, white, and chartreuse yellow. Bass were trained in their stock tanks. To accomplish this task, an array of all 6 training colors was created by attaching all stimuli pipettes to a 90 × 30 cm foam board. The foam board floated on top of the water in each tank. This allowed bass to have full visibility of the color stimuli in the water with minimal interference from the researcher. The arrangement of training colors on the foam board was rearranged every day. Training involved placing the array of stimuli in 1 tank, then dispensing food from the pipette with the specific target color. Initially, food was simply dispensed from the pipette to acclimate bass to the training conditions.
Experiment #1: discerning training targets from alternates in the presence of a chemical cue
After 2 weeks, the bass were required to strike their designated training stimulus to receive the food reward. The number of approaches within 1 body length and strikes to pipettes was recorded for each pipette. We visually observed only the first behavior of each individual bass. Bass were highly responsive to the introduced targets at this point in the training process, so this process only lasted ∼30 s per tank. We calculated the sum of approaches and strikes at each training color on each day. We then calculated the proportion of approaches/strikes at each color for each day. For these trials, bass likely had access to chemical cues as the target pipette contained the pellet food. Tanks were considered trained when all bass struck at the pipette tip for 3 consecutive days. Training continued for a total of 70 days (April 6, 2016–June 9, 2016).
Experiment #2: discern the training target from alternate targets in the absence of a chemical cue
The goal here was to determine whether the bass could discern their training target from the alternate targets in the absence of chemical cues. To do this, the pipettes with their color cards were placed in the stock tanks, and the number of approaches and strikes to each pipette was recorded. Bass were remained highly responsive to the introduced stimuli despite the lack of chemical cues, so the trials for each tank only lasted ∼30 s. Again, we calculated the sum of approaches and strikes at each training color on each day. We then calculated the proportion of approaches/strikes at each color for each day. The bass were tested on 4 consecutive days. These trials tested the ability of bass to identify their training target from the alternate target color in the absence of chemical cues from food. This assay was conducted across 4 days between May 30, 2016 and June 7, 2017.
We note that in both Experiments #1 and #2, group dynamics appeared to be important in these assays: 1 or 2 bold fish appeared to do the choosing. These leader fishes struck the pipettes and then the other fish appeared to follow them. These competitive dynamics were helpful in the initial training because the fishes were motivated to reach the food source first. However, whether all of the bass were trained to prefer a color is unclear. An alternative is that most bass were trained to follow a couple of leader fish who were genuinely trained to prefer a particular color. Regardless of which scenario occurred, the statistical inferences from the experiments are valid because the analyses were performed at the level of tank means. Hence, we were either analyzing the behavior of all the color-trained bass or the behavior of the color-trained leaders and subsequent followers.
Experiment #3: discerning color cues from achromatic stimuli
We next sought to determine whether trained bass could discern their training target from a range of achromatic cues. The hypothesis that bass use chromatic cues means that they compare the visual inputs from the 2 cone classes. If bass fail to use chromatic cues, then they should be incapable of distinguishing their target color from an achromatic cue with a similar brightness value. Only bass trained to red and green were tested in these trials as they were the only groups that could successfully identify their training target from the alternate targets in the absence of chemical cues (see Results - Visual modeling). If bass do not use chromatic cues, then bass trained to red (or green) should be unable to distinguish red (or green) from the achromatic cue equal in brightness. The achromatic cues are described in the following 2 paragraphs.
Bass were randomly selected from each tank, and individually relocated to a 1325-L, 183 cm diameter, round tank for trials. Four bass from each tank were randomly selected for each trial. Meaning, 8 bass from each training color (2 tanks per color, 4 bass from each tank) went through the trials. Two testing tanks were set up at the greenhouse at the Natural Resource Studies Annex—University of Illinois—under identical conditions to the training tanks. Bass were given 1 day to acclimate to their testing environment before beginning trials. Bass were not fed on the day of acclimation.
An array of test stimuli was created by attaching 8 pipettes to a 183 × 30 cm foam board. Test stimuli included 7 achromatic shades varying in brightness and the training color. Within the array of achromatic shades, gray 1 and gray 2 were similar in brightness to red. Gray 5 and black were similar in brightness to green. Hence, if bass could not distinguish chromatic cues, red would be mistaken for gray 2 and green would be mistaken for gray 5 or black (Figure 2). The arrangement of all 8 test stimuli was randomized for each trial. Before trials began, the bass were isolated to 1 side of the tank using a sheet of transparent plexiglass. A GoPro Hero+ was then placed inside the tank facing the array of stimuli to record the bass behaviors. Next, the array of test stimuli was placed on top of the water on the opposite side of the tank. Bass were then given 2 min to visualize the stimuli, then the plexiglass was removed, and the bass were given 2 min to approach and strike at the stimuli. Bass were tested on their ability to identify their training stimulus against the 7 achromatic, test stimuli. Response to a stimulus was defined as the number of seconds remaining within 1 body length of a stimulus. GoPro Hero+ footage was reviewed twice to obtain an accurate measurement of stimuli identification.
Statistical analysis of bass behavior
We used ANOVA to determine whether bass differed in how long it took to learn their training target color among a field of the other target colors with the presence of olfactory cues. The number of days taken to be considered trained was the dependent variable and the training target (i.e., our treatments) was the fixed, categorical independent variable. To determine whether bass trained to approach different colors differed in their likelihood of approaching/striking the different colors, we performed ANOVA on the tank means on the proportion of approaches/strikes at each color as a function of training color. For each tank, we calculated the average proportion of bass that approached/struck at each color (i.e., white, black, blue, green, chartreuse yellow, and red) across the days when bass were trained. This created a data set with 12 observations (2 replicate tanks per training color). We compared means among different treatments using Tukey’s post hoc tests. The analysis was repeated for the assays where visual discrimination was tested in the absence of chemical cues.
Finally, we used pairwise t-tests to determine whether bass that had been trained to a specific target color could correctly identify their color in the absence of olfactory cues in a new testing environment (target color presented with alternative achromatic stimuli). Here, the data for the red-trained and green-trained bass were analyzed independently. For each set of trained bass, pairwise t-tests compared the proportion of time spent near training targets to each gray-scale target. Any trial where bass did not approach test stimuli were considered insufficient and removed from statistical analysis. Statistical analysis was conducted on 39 behavioral observations recorded during testing trials. A total of 9 behavioral observations were not included in statistical analysis because of insufficient data.
Statistical tests are considered significant at P < 0.05. P-values between 0.10 and 0.05 are considered as marginal trends. All data have been deposited in Dryad (number to be entered on acceptance).
Results
Microspectrophotometry
Absorbance was measured from 246 photoreceptor cells in 9 fish (4 Florida bass and 5 Illinois bass), representing 41 rod cells, 76 single cone cells, and 129 twin cone cells. Template fitting for photoreceptors was generally better with an A1 template than an A2 template (rods: 29 A1, 12 A2; single cones: 57 A1, 19A2; twin cones: 111 A1, 18 A2). However, the difference in λmax as a function of using an A1 versus an A2 template was marginal (λmax absolute difference ± SE: rods 3.0 ± 0.3 nm; single cones 2.3 ± 0.1 nm; red cones 1.5 ± 0.1 nm). From here on, values of λmax are reported using the best-fit template for each photoreceptor cell.
Table 1 shows the average λmax values for each individual for the rods, green cones, and red cones. Rods were maximally sensitive at 527.9 ± 1.00 nm, single cones contained a medium-wavelength sensitive (MWS) photopigment with λmax at 535.0 ± 0.6 nm, and twin cones contained a long-wavelength sensitive (LWS) photopigment with λmax at 614.5 ± 0.5 nm. There was no evidence for short-wavelength sensitive (SWS) cone cells. Thus, the visual system of largemouth bass is dichromatic with green-sensitive single cones and red-sensitive twin cones (Figure 3). The Florida and Illinois populations did not differ in λmax for any of the 3 photoreceptor types (Table 1, P > 0.17 in all tests).
Table 1.
Individual λmax for rods, single cones, and twin cones
| Rods |
Single cones—MWS photopigment |
Twin cones—LWS photopigment |
||||||||
|---|---|---|---|---|---|---|---|---|---|---|
| pop | ind | Mean λmax | SE | N | Mean λmax | SE | N | Mean λmax | SE | N |
| FL | 1 | 532.5 | 1.69 | 5 | 528.5 | 2.53 | 4 | NA | NA | 0 |
| FL | 2 | 532.2 | 2.66 | 4 | 532.7 | 4.33 | 3 | 613.8 | 2.13 | 10 |
| FL | 3 | 528.2 | NA | 1 | 535.9 | 1.85 | 5 | 614.4 | 2.18 | 13 |
| FL | 4 | 521.0 | 2.71 | 6 | 530.2 | NA | 1 | 614.2 | 1.13 | 3 |
| IL | 5 | 521.7 | 2.01 | 7 | 534.2 | 1.12 | 18 | 613.4 | 0.65 | 22 |
| IL | 6 | 530.9 | 1.69 | 8 | 535.1 | 1.60 | 9 | 616.0 | 0.75 | 31 |
| IL | 7 | 531.3 | 0.46 | 8 | 538.2 | 0.61 | 19 | 615.9 | 0.73 | 28 |
| IL | 8 | 525.5 | 3.63 | 2 | 534.4 | 1.48 | 16 | 612.1 | 1.33 | 21 |
| IL | 9 | NA | NA | 0 | 528.7 | NA | 1 | 612.8 | NA | 1 |
| ANOVA | F1,6 = 2.31, P = 0.179 | F1,7 = 2.1, P = 0.187 | F1,6 =0.0, P = 0.868 | |||||||
Notes: Sample sizes (N) and standard errors (SE) are listed for each photoreceptor cell type for each individual. “pop” refers to population. “ind” refers to individual. F-tests for population differences are listed.
Figure 3.

Examples of fitted relative absorbance curves for (A) a rod, (B) a green single cone, and (C) a red twin cone. The specific rod shown and red twin cone cells were measured in Illinois bass. The specific green single cone shown was measured in Florida bass.
Visual modeling
The bass were easily trainable. In the preliminary training to a single training pipette, training colors did not differ in their learning time (F5,6 = 1.16, P = 0.43). On average, bass required 47 ± 3.2 days to become trained. The model of visual perception predicted that bass should easily be able to discern red, green, and chartreuse yellow from one another. However, the model indicated that blue and green may be similar to one another and to black and that chartreuse yellow may appear similar to white (Figure 2). These predictions were largely upheld in the bass behavioral trials.
Experiment #1: discerning training targets from alternates in the presence of a chemical cue
We tested the ability of bass to choose their training target pipette over alternative targets. With chemical cues present, bass correctly identified their training pipette resulting in significant differences in the proportion of approaches/attacks at each color as a function of training (Figure 4—Experiment 1, proportion red—F5,6 = 353; proportion green—F5,6 = 463.8; proportion blue—F5,6 = 27.9; proportion yellow—F5,6 = 384.5, proportion black—F5,6 = 415; proportion white—F5,6 = 42.8; all F-values are significant at P < 0.0005; see Supplementary Figure 2 for an alternative display of the data). Bass trained to approach red did a particularly good job at identifying their training pipettes (81.5% of approaches/strikes by bass trained to approach red). Likewise, bass trained to other colors rarely approached or struck the red pipettes. Similar results were found for green where bass trained to approach green correctly identified their target pipette (72.8%) and fish trained to other colors rarely approached or struck at green.
Figure 4.
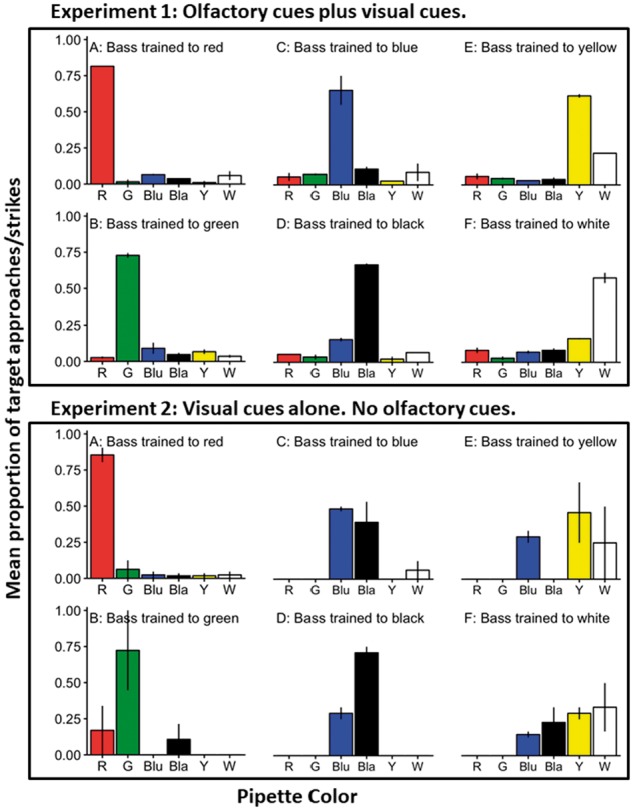
The average proportion of approaches/strikes at each color as a function of training color (A–F). Means ± SE are shown. n = 2 for each bar. A–F indicate training color. Experiment 1—The data show the results of trials where olfactory cues were present. Experiment 2—The data show the results of trials when olfactory cues were absent. The x-axis indicates the pipette color.
Bass trained to approach blue, black, yellow, and white also correctly identified their training pipettes when chemical cues were present, but noticeable mistakes were made (Figure 4). Bass trained to approach blue approached and struck at the blue pipette (65%) most often. However, they also approached and struck at the black pipette (10.8%), and they did this more often than bass trained to approach red (P = 0.0413) and yellow (P = 0.0416), and tended to do this more often than bass trained to approach green (P = 0.0793). Likewise, bass that were trained to approach black correctly identified the black pipette (66.4%), but they also approached/struck at blue at an appreciable rate (10.6%).
A similar pattern emerged with chartreuse yellow and white. Bass trained to approach chartreuse yellow correctly identified the chartreuse yellow pipette (61.2%), but they also approached/struck at the white pipette (21.8%), and they did this more often than bass trained to green (P = 0.0456), and tended to approach/strike at the white pipette more often than bass trained to red (P = 0.0787) or black (P = 0.097) (Figure 4). Finally, bass trained to approach white were more likely to approach/strike at white than other colors (57.4%), but they also approached and struck at chartreuse yellow (16.3%), and they did this more often than bass trained to approach black (P = 0.00128), blue (P = 0.00147), green, (P = 0.00969), or red (P < 0.001) (Figure 4). The data presented here are on the proportions but similar patterns emerge with the mean number of bass within a tank that approached/struck each target (Supplementary Table 1).
Experiment #2: discern the training target from alternate targets in the absence of a chemical cue
The critical question was whether they could discern among target colors in the absence of the chemical cues. Even when chemical cues were absent, bass correctly identified their training target resulting in significant differences in the proportion of approaches/attacks at each color as a function of training, with the exception of bass trained to white (Figure 4—Experiment 2, proportion red—F5,6 = 22.35, P = 0.00082; proportion green—F5,6 = 6.32, P = 0.022; proportion blue—F5,6 = 43.15, P = 0.00013; proportion yellow—F5,6 = 5.21, P = 0.034; proportion black—F5,6 = 9.91, P = 0.0073; proportion white—F5,6 = 1.309, P = 0.37; see Supplementary Figure 2 for an alternative display of the data). Again, bass trained to red readily identified their target color (85.4%), and bass trained to other colors rarely approached/struck at red (P < 0.005 in all post hoc tests). Bass trained to green also identified their target color well (72.3%), and bass trained to other colors rarely approached/struck at green (P < 0.05 in all post hoc tests).
Bass trained to blue, black, yellow, and white performed less well. Bass trained to blue approached/struck at blue pipettes more than the others (48.3%) and they approached/struck at blue pipettes at high rates than bass trained to other colors (P < 0.02 in all post hoc tests). However, they also approached/struck at the black pipette at a high rate (39.2%). Bass trained to black correctly identified the black pipettes at a high rate (70.8%), but they also approached/struck at the blue pipette (29.2%). Bass trained to black approached/struck the black pipette at a higher rate than bass trained to red (P = 0.0098), green (P = 0.019), or yellow (P = 0.0085) pipettes and tended to strike at them at higher rates than bass trained to white pipettes (P = 0.052). However, there was no statistically significant difference in the rates of approaches/strikes at black between bass trained to black and bass trained to blue (P = 0.23).
Bass trained to chartreuse yellow approached/struck at the chartreuse yellow pipette at an appreciable rate (45.8%), but they also approached/struck at the white (25%) and blue (29.2%). Bass trained to chartreuse yellow tended to approach/strike at the chartreuse yellow pipette at a greater rate than bass trained to red (P = 0.077), green (P = 0.066), blue (P = 0.066), or black (P = 0.066). There were no significant differences in the rates of approaches/strikes at yellow pipettes between bass trained to yellow and bass trained to white (P = 0.75). Likewise, bass trained to white approached/struck at the white pipette (33.3%), but they also struck at yellow (29.2%), black (22.9%), and blue (14.5%). There were no statistically significant (or trending) differences between the proportions of approaches/strikes at white among the bass trained to different colors. The data presented here are on the proportions but similar patterns emerge with the mean number of bass within a tank that approached/struck each target (Supplementary Table 2).
Experiment #3: discerning color cues from achromatic stimuli
We next asked whether bass use chromatic cues to select trained targets. The critical test here is whether bass trained to red and green could identify their target among a series of achromatic alternates. In these trials, bass were less likely to perform strikes, and bass were generally less likely to approach the pipettes. Despite this, bass trained to red and green were able to accurately select their training target among alternative gray targets (Figure 5). An analysis of the time spent associated with each target indicated that bass trained to red more often selected their training target compared with all gray targets except gray 1 (all targets except gray 1: pairwise t-tests P < 0.0065, gray 1: P = 0.11). Similarly, bass trained to green spent more time near their training target compared with all gray targets (P < 0.05) with the exception gray 2 and black (gray 2: P = 0.074, black: P = 0.070) where the differences were marginal. Interestingly, unlike our prediction, bass did not select grays that were similar in brightness to their training colors during gray trails. Instead, bass trained to red and green selected targets that were brighter than their target color (gray 1 and gray 2).
Figure 5.
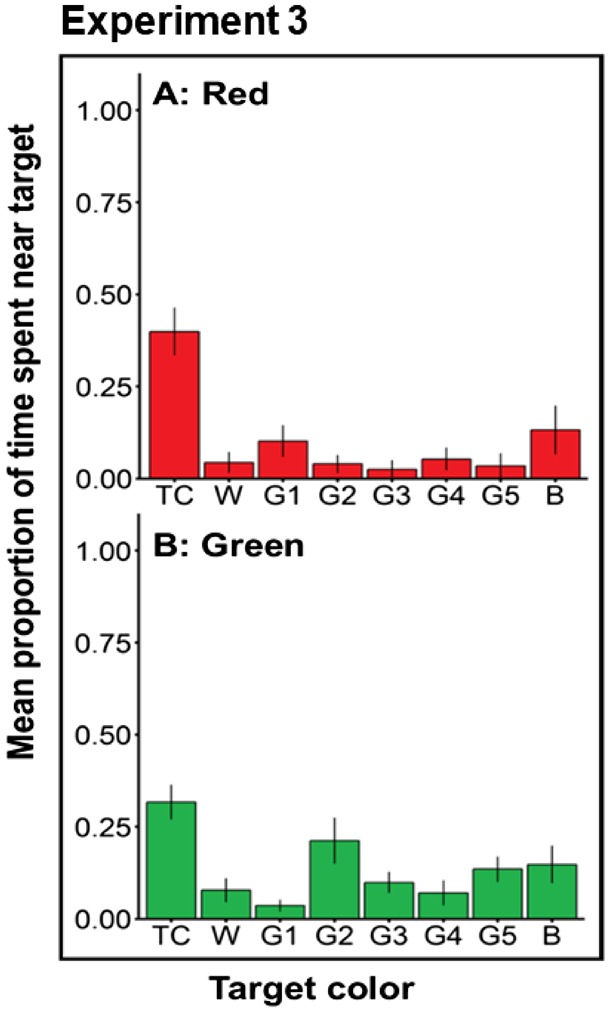
Experiment 3—Proportion of time spent near simultaneously presented stimuli during test trials (mean ± SE). Bar represents target colors presented to bass where TC = training color, W = white, G1–G5 = gray targets, and B = black. Each grid represents bass trained to A = red and B = green.
Discussion
Largemouth bass possess dichromatic color vision, with green sensitive single cones and red sensitive twin cones. This finding agrees with Kawamura and Kishimoto’s (2002) prediction for a red-sensitive eye in largemouth bass. Kawamura and Kishimoto suggested that the largemouth bass eye provides better color analysis at long wavelengths over shorter wavelengths.
There was little evidence to suggest substantial phenotypic variation in visual sensitivity between the Florida and Illinois populations. Other fish species have been shown to harbor phenotypic variation among populations (Boughman 2002; Fuller et al. 2003, 2004; Carleton et al. 2005; Fuller and Noa 2010), but the mechanisms underlying this variation varies among systems. Shifts in λmax, A1 versus A2 retinal templates, relative cone/opsin expression, and lens transmission can contribute to phenotypic variation in visual sensitivity. Our study found little evidence that the λmax of the different photoreceptor classes or the degree of A1 versus A2 template use differed between the 2 populations. The fact that we fit both A1 and A2 templates to different photorecptors within the same individual most likely reflects noise in the data and not within population (or even within individual) variation in chromophore usage. These results imply that a single model of bass vision can be used for multiple populations.
Our visual detection model of bass vision indicated that dichromatic bass vision limits the perception of yellow coloration. In particular, chartreuse yellow should appear similar to white. This happens because chartreuse yellow equally stimulates both the green and red cone cells at similar frequencies. Hence, there is no opponency resulting from chartreuse yellow. Our behavioral assays supported this hypothesis. In trials with olfactory cues, bass trained to chartreuse yellow and white could correctly identify their target colors. Yet even here, they often made mistakes and frequently chose the other. This pattern was amplified when bass were tested in the absence of olfactory cues. Here, the bass were incapable of distinguishing white from chartreuse yellow and vice versa. Similar results were found by Brown (1937) who used light electric shocks to train bass. Taken together, these results provide strong support for the idea that chartreuse yellow appears similar to white in the bass visual system.
Our visual detection model also predicted that blue, green, and black would appear similar to the bass. These results partially supported this prediction. Bass trained to blue frequently struck at black, and bass trained to black frequently struck at blue. In trials with olfactory cues, bass trained to black also selected blue at an appreciable rate and vice versa for bass trained to blue. In the absence of olfactory cues, bass were incapable of distinguishing between black and blue colors. Again, Brown (1937) found a similar pattern where blue and black were indistinguishable to bass. Brown (1937) also found that bass could discern green from black and grays, but that they had difficulty discerning green and blue, which is in keeping with our visual model. The results of the behavioral assays taken with the results of Brown (1937) indicate that this pattern is robust.
Our model of bass vision may need to include other aspects of visual morphology to account for the discrepancy in blue perception between model predictions and behavioral results. The behavioral assays and visual detection model indicate that there is a genuine chromatic stimulus for green that bass can detect. The larger question is why this does not occur for blue. The model indicates that blue should create a similar chromatic stimulus that differs from black, but the behavioral assays do not support this. One possibility is that there are filtering properties of the bass eye that we did not consider in our model (Thorpe et al. 1993; Aksnes and Utne 1997; Kawamura and Kishimoto 2002). Work in other centrarchids (Lepomis cyanellus and Lepomis gibbossus) indicates the presences of pigments in the lens that filter light lower than 400 nm (Thorpe et al. 1993). Whether such filtering pigments are present in the bass lens and cornea is currently unknown.
In the bass system, chromatic cues, and particularly red, are easier to identify. Bass trained to red and green had high rates of approaches/strikes at their respective targets, and bass trained to other targets rarely mistakenly approached/struck at red or green. Bass trained to red and green were also able to identify their targets among a panel of achromatic cues. These results indicate that bass can more readily associate meaning to chromatic cues of high opponency. However, bass had difficulty associating meaning to achromatic cues (white, black, and for the bass system, yellow). These results are in keeping with a long literature in the field of visual psychology showing that chromatic cues are easier to learn for many species (Kelber et al. 2003; Hori et al. 2006; Roth et al. 2007).
Red coloration has long been thought to be particularly attractive to largemouth bass (Howick and Obrien 1983; Kawamura and Kishimoto 2002; Ciccotto and Mendelson 2016). Red was particularly easy to identify (for bass trained to red) and avoid (for bass trained to other colors). A study by Ciccotto and Mendelson (2016) found that largemouth bass had a strong preference for red coloration over blue or black. These were presumably “innate” preferences whereas the behaviors shown here were learned. Whether or not innately preferred colors have high opponency and are also easily learned is unknown.
Most large, predatory fish are dichromatic, meaning they rely on only 2 photoreceptor classes to perceive color (Loew and Lythgoe 1978; Cronin et al. 2014). Lythgoe (1968) proposed that underwater predators perceive optimally with an offset, dichromatic system, where 1 photoreceptor optimally perceives the background illumination spectrum, and 1 photoreceptor contrasts the background spectrum. An offset dichromatic system creates high contrast between background lighting and prey illuminated by overhead sun (Loew and Lythgoe 1978). In aquatic environments, long wavelengths (orange–red spectrum) are reflected in background lighting, whereas short wavelength (blue–green spectrum) contrasts that background (Lythgoe 1968; Johnsen and Mobley 2012). These aquatic spectral properties generally align with the M. salmoides visual system.
Similar visual system properties have been found in other centrarchids (Dearry and Barlow 1987; Hawryshyn et al. 1988). Dearry and Barlow (1987) previously characterized the photoreceptor sensitivities of the green sunfish L. cyanellus. They found that the green sunfish retina contained rods with λmax at 525 nm, single cones with λmax at 535 nm, and twin cones with λmax at 621 nm. These photoreceptor sensitivities are a close match to the largemouth bass sensitivities, with both the rods and single cones being almost identical (largemouth bass rod: 527.94 nm; single cone: 534.98 nm). Green sunfish twin cones were slightly red-shifted compared with largemouth bass (green sunfish twin cone: 621 nm; largemouth bass twin cone: 614.48). In addition, Dearry and Barlow also did not find evidence for blue or UV sensitive cones in adult fish. Darters also have a similar dichromatic visual system with rods maximally sensitive from 529 to 525 nm, single cones maximally sensitive from 508 to 531 nm, and twin cones maximally sensitive from 602 to 608 nm (Gumm et al. 2012; Zhou et al. 2015). Further studies are needed to determine whether all centrarchids possess a similar suite of photoreceptor cells.
In conclusion, this study showed that bass possess dichromatic vision with red and green cells in addition to a rod cell. A simple visual model of this visual system indicated that there are colors such as chartreuse yellow that bass should perceive as being similar to white. Our behavioral assays provided good support for the model prediction that chartreuse yellow is indistinguishable from white. The behavioral assays also indicated that blue is indistinguishable from black. Bass could readily identify red and green and could distinguish these colors from achromatic alternatives. Bass from Illinois and Florida populations possess similar photoreceptor sensitivities despite differences in environmental light composition. Whether bass from these light environments have innately different learning abilities or preferences for colors in currently unknown. Our findings have implications for the recreational fishing industry and for natural systems where bass are often a top predator.
Supplementary Material
Acknowledgments
We would like to thank Joel Borowics, Sean Bruyere, Shun Kobayashi, and Drew Costenbader for assistance in animal husbandry and data collection. Dr Alison Bell, Dr John Epifanio, Michelle St. John, and Rachel Moran provided comments that greatly improved this manuscript.
Funding
This project was funded by the Animal Behavior Society Student Research Grant and Illinois Natural History Survey via the R. Weldon Larimore/Jordan Creek Endowment Fund.
References
- Aksnes D, Utne ACW, 1997. A revised model of visual range in fish. Sarsia 82:37–41. [Google Scholar]
- Ali MA, Anctil M, 1976. Retinas of Fishes: An Atlas. Berlin: Springer-Verlag. [Google Scholar]
- Baldwin J, Johsnen S, 2012. The male blue crab, Callinectes sapidus, uses both chromatic and achromatic cues during mate choice. J Exp Biol 215:1184–1191. [DOI] [PubMed] [Google Scholar]
- Boughman JW, 2002. How sensory drive can promote speciation. Trends Ecol Evol 17:571–577. [Google Scholar]
- Bridges CDB, 1972. Photochemistry of Vision. New York: Springer-Verlag. [Google Scholar]
- Brown FA., Jr., 1937. Responses of the large-mouth black bass to colors. Illinois Nat Hist Surv Bull 21:33–55. [Google Scholar]
- Carleton KL, Parry JWL, Bowmaker JK, Hunt DM, Seehausen O, 2005. Colour vision and speciation in Lake Victoria cichlids of the genus Pundamilia. Mol Ecol 14:4341–4353. [DOI] [PubMed] [Google Scholar]
- Carter MW, Shoup DE, Dettmers JM, Wahl DH, 2010. Effects of turbidity and cover on prey selectivity of adult smallmouth bass. Trans Am Fish Soc 139:353–361. [Google Scholar]
- Champ CM, Vorobyev M, Marshall NJ, 2016. Colour thresholds in a coral reef fish. R Soc Open Sci 3:160399.. [DOI] [PMC free article] [PubMed] [Google Scholar]
- Chen RJ, Hunt KM, Ditton RB, 2003. Estimating the economic impacts of a trophy largemouth bass fishery: issues and applications. North Am J Fish Manag 23:835–844. [Google Scholar]
- Ciccotto PJ, Mendelson TC, 2016. The ecological drivers of nuptial color evolution in darters (Percidae: etheostomatinae). Evolution 70:745–756. [DOI] [PubMed] [Google Scholar]
- Cooke SJ, Philipp DP, 2009. Centrarchid Fishes: Diversity, Biology and Conservation. 1st edn West Sussex: Wiley-Blackwell. [Google Scholar]
- Cronin TW, Johnsen S, Marshall NJ, Warrant EJ, 2014. Visual Ecology. Woodstock, Oxfordshire: Princeton University Press. [Google Scholar]
- Cummings ME, 2004. Modelling divergence in luminance and chromatic detection performance across measured divergence in surfperch (Embiotocidae) habitats. Vision Res 44:1127–1145. [DOI] [PubMed] [Google Scholar]
- Dearry A, Barlow RB, 1987. Circadian rhythms in the green sunfish retina. J Gen Physiol 89:745–770. [DOI] [PMC free article] [PubMed] [Google Scholar]
- Endler JA, 1990. On the measurement and classification of colour in studies of animal colour patterns. Biol J Linnean Soc 41:315–352. [Google Scholar]
- Endler JA, 1992. Signals, signal conditions, and the direction of evolution. Am Nat 139:S125–S153. [Google Scholar]
- Fuller RC, Carleton KL, Fadool JM, Spady TC, Travis J, 2004. Population variation in opsin expression in the bluefin killifish Lucania goodei: a real-time PCR study. J Comp Physiol A Neuroethol Sensory, Neural, Behav Physiol 190:147–154. [DOI] [PubMed] [Google Scholar]
- Fuller RC, Fleishman LJ, Leal M, Travis J, Loew E, 2003. Intraspecific variation in retinal cone distribution in the bluefin killifish Lucania goodei. J Comp Physiol A Neuroethol Sensory, Neural, Behav Physiol 189:609–616. [DOI] [PubMed] [Google Scholar]
- Fuller RC, Noa LA, 2010. Female mating preferences, lighting environment, and a test of the sensory bias hypothesis in the bluefin killifish. Anim Behav 80:23–35. [Google Scholar]
- Gerber B, Scherer S, Neuser K, Mechels B, Hendels E. et al. , 2004. Visual learning in individually assayed Drosophila larvae. J Exp Biol 207:179–188. [DOI] [PubMed] [Google Scholar]
- Govardovskii VI, Fyhrquist N, Reuter T, Kuzmin DG, Donner K. 2000. In search of the visual pigment template. Visual Neurosci 17:509–528. [DOI] [PubMed] [Google Scholar]
- Gumm JM, Loew ER, Mendelson TC, 2012. Differences in spectral sensitivity within and among species of darters (genus Etheostoma). Vision Res 55:19–23. [DOI] [PubMed] [Google Scholar]
- Hawryshyn CW, Arnold MG, McFarland WN, Loew ER, 1988. Aspects of color vision in bluegill sunfish (Lepomis macrochirus): ecological and evolutionary relevance. J Comp Physiol A 164:107–116. [Google Scholar]
- Hori S, Takeuchi H, Arikawa K, Kinoshita M, Ichikawa N. et al. , 2006. Associative visual learning, color discrimination, and chromatic adaptation in the harnessed honeybee Apis mellifera L. J Comp Physiol A Neuroethol Sensory, Neural, Behav Physiol 192:691–700., [DOI] [PubMed] [Google Scholar]
- Howick GL, Obrien WJ, 1983. Piscivorous feeding behavior of largemouth bass: an experimental analysis. Trans Am Fish Soc 112:508–516. [Google Scholar]
- Huenemann TW, Dibble ED, Fleming JP, 2012. Influence of turbidity on the foraging of largemouth bass. Trans Am Fish Soc 141:107–111. [Google Scholar]
- Johnsen S, Mobley C, 2012. The optics of life: a biologist’s guide to light in nature. Am J Phys 80:937. [Google Scholar]
- Kawamura G, Kishimoto T, 2002. Color vision, accommodation and visual acuity in the largemouth bass. Fish Sci 68:1041–1046. [Google Scholar]
- Kelber A, Osorio D, 2010. From spectral information to animal colour vision: experiments and concepts. Proc Biol Sci 277:1617–1625. [DOI] [PMC free article] [PubMed] [Google Scholar]
- Kelber A, Vorobyev M, Osorio D. 2003. Animal colour vision--behavioural tests and physiological concepts. Biol Rev Camb Philos Soc 78:81–118. [DOI] [PubMed] [Google Scholar]
- Kemp DJ, Herberstein ME, Fleishman LJ, Endler JA, Bennett ATD. et al. , 2015. An integrative framework for the appraisal of coloration in nature. Am Nat 185:705–724. [DOI] [PubMed] [Google Scholar]
- Land MF, Nilsson DE, 2012. Animal Eyes. Oxford: Oxford University Press. [Google Scholar]
- Leech DM, Johnsen S, 2006. Ultraviolet vision and foraging in juvenile bluegill Lepomis macrochirus. Can J Fish Aquat Sci 63:2183–2190. [Google Scholar]
- Loew ER, 1994. A third, ultraviolet-sensitive, visual pigment in the Tokay gecko Gekko gekko. Vision Res 34:1427–1431. [DOI] [PubMed] [Google Scholar]
- Loew ER, Dartnall HJA, 1976. Vitamin A1/A2-based visual pigment mixtures in cones of the rudd. Vision Res 16:891–896. [DOI] [PubMed] [Google Scholar]
- Loew ER, Lythgoe JN, 1978. The ecology of cone pigments in teleost fishes. Vision Res 18:715–722. [DOI] [PubMed] [Google Scholar]
- Loew ER, McFarland WN, Margulies D, 2002. Developmental changes in the visual pigments of the yellowfin tuna Thunnus Albacares. Mar Freshw Behav Physiol 35:235–246. [Google Scholar]
- Losey GS, Cronin TW, Goldsmith TH, Hyde D, Marshall NJ. et al. , 1999. The UV visual world of fishes: a review. J Fish Biol 54:921–943. [Google Scholar]
- Lythgoe JN, 1968. Visual pigments and visual range underwater. Vision Res 8:997–1012. [DOI] [PubMed] [Google Scholar]
- McMahan TE, Holanov SH, 1995. Foraging success of largemouth bass at different light intensities: implications for time and depth of feeding J Fish Biol 46:759–766. [Google Scholar]
- Moraga AD, Wilson ADM, Cooke SJ, 2015. Does lure colour influence catch per unit effort, fish capture size and hooking injury in angled largemouth bass? Fish Res 172:1–6. [Google Scholar]
- Munz FW, McFarland WN, 1973. The significance of spectral position in the rhodopsins of tropical marine fishes. Vision Res 13:1829–1874. [DOI] [PubMed] [Google Scholar]
- Neumeyer C, Wietsma JJ, Spekreijse H, 1991. Separate processing of color and brightness in goldfish. Vision Res 31:537–549. [DOI] [PubMed] [Google Scholar]
- Partridge JC, Cummings ME, 1999. Adaptations of visual pigments to the aquatic environment In: Archer SN, Djamgoz MBA, Loew ER, Vallerga S, editors. Adaptive Mechanisms in the Ecology of Vision. Dordrecht: Kluwer, 251–283. [Google Scholar]
- Provencio I, Loew ER, Foster RG, 1992. Vitamin A2-based visual pigments in fully terrestrial vertebrates. Vision Res 32:2201–2208. [DOI] [PubMed] [Google Scholar]
- Roth LSV, Balkenius A, Kelber A, 2007. Colour perception in a dichromat. J Exp Biol 210:2795–2800. [DOI] [PubMed] [Google Scholar]
- Rosenthal GG, 2017. Mate Choice: The Evolution of Sexual Decision Making from Microbes to Humans. Princeton (NJ: ): Princeton University Press. [Google Scholar]
- Schramm HL, Armstrong ML, Funicelli NA, Green DM, Lee DP. et al. , 1991. The status of competitive sport fishing in North America. Fisheries 16:4–12. [Google Scholar]
- Shoup DE, Lane WD, 2015. Effects of turbidity on prey selection and foraging return of adult largemouth bass in reservoirs. North Am J Fish Manag 35:913–924. [Google Scholar]
- Sondergaard M, Thomas D, 2004. Dissolved Organic Matter (DOM) in Aquatic Ecosystems: A Study of European Catchments and Coastal Waters. A publication by the EU project DOMAINE (EVK3-CT-2000-00034). [Google Scholar]
- Thorpe A, Douglas RH, Truscott RJW, 1993. Spectral transmission and short-wave absorbing pigments in the fish lens-I. Phylogenetic distribution and identity. Vision Res 33:289–300. [DOI] [PubMed] [Google Scholar]
- Vorobyev M, Osorio D, 1998. Receptor noise as a determinant of colour thresholds. Proc Biol Sci 265:351–258. [DOI] [PMC free article] [PubMed] [Google Scholar]
- Zhou MC, Loew ER, Fuller RC, 2015. Sexually asymmetric colour-based species discrimination in orangethroat darters. Animal Behav 106:171–179. [Google Scholar]
Associated Data
This section collects any data citations, data availability statements, or supplementary materials included in this article.