Abstract
Rhythmic oscillation in neurons can be characterized by various attributes, such as the oscillation period and duty cycle. The values of these features depend on the amplitudes of the participating ionic currents, which can be characterized by their maximum conductance values. Recent experimental and theoretical work has shown that the values of these attributes can be maintained constant for different combinations of two or more ionic currents of varying conductances, defining what is known as level sets in conductance space. In two-dimensional conductance spaces, a level set is a curve, often a line, along which a particular oscillation attribute value is conserved. In this work, we use modeling, dynamical systems tools (phase-space analysis), and numerical simulations to investigate the possible dynamic mechanisms responsible for the generation of period and duty-cycle levels sets in simplified (linearized and FitzHugh-Nagumo) and conductance-based (Morris-Lecar) models of neuronal oscillations. A simplistic hypothesis would be that the tonic balance between ionic currents with the same or opposite effective signs is sufficient to create level sets. According to this hypothesis, the dynamics of each ionic current during a given cycle are well captured by some constant quantity (e.g., maximal conductances), and the phase-plane diagrams are identical or are almost identical (e.g., cubic-like nullclines with the same maxima and minima) for different combinations of these maximal conductances. In contrast, we show that these mechanisms are dynamic and involve the complex interaction between the nonlinear voltage dependencies and the effective time scales at which the ionic current's dynamical variables operate.
Keywords: oscillators, phase plane, speed graph, central pattern generator, level sets
NEW & NOTEWORTHY
Variability is a hallmark of neuronal activity. However, neurons of the same type have been shown to exhibit constant values of their oscillatory attributes (e.g., frequency, duty cycle), despite having different levels of the parameters (e.g., maximal conductances) defining their intrinsic ionic currents, thus generating the so-called level sets in parameter space. Here, we examine theoretically the biophysical and dynamic mechanisms that generate these level sets for a set of key, biophysically plausible models.
a number of experimental studies have shown that ionic currents or their maximal conductances are, on the one hand, extremely variable (Etheredge et al. 2007; Goldman et al. 2001; Golowasch 2014; Khorkova and Golowasch 2007; Leao et al. 2012; Liss et al. 2001; O'Leary et al. 2013; Olypher and Calabrese 2007; Ransdell et al. 2012; Schulz et al. 2006, 2007; Swensen and Bean 2005; Temporal et al. 2012; Unal et al. 2012) and on the other, not independent from one another. This reveals itself as correlated pairs (or n-tuples) of conductances in populations of identified neurons (Khorkova and Golowasch 2007; MacLean et al. 2005; McAnelly and Zakon 2000; O'Leary et al. 2014; Olypher and Calabrese 2007; Schulz et al. 2007; Wu and Fettiplace 1996; Zhao and Golowasch 2012). Recent computational studies have shown that the subsets of ionic currents that display these correlations can compensate for each other in maintaining specific attributes (e.g., frequency, duty cycle) constant or at least bounded (Burdakov 2005; Hudson and Prinz 2010; Lamb and Calabrese 2013; O'Leary et al. 2013; Olypher and Prinz 2010; Zhang and Golowasch 2011). Surprisingly, some currents do not intuitively appear to be natural antagonists, given their distinct voltage dependencies and kinetic properties. For example, the inactivating, transient potassium current and the noninactivating, slow hyperpolarization-activated current (Ih) have been shown to be functional antagonists in lobster stomatogastric ganglion neurons: they control the delay to firing in oscillatory neurons in a complementary manner (Burdakov 2005; MacLean et al. 2005). However, little about these two ionic currents suggests a priori such a role, given that their kinetics and voltage dependencies are completely different. Many other ionic current subsets have been shown to play similar complementary roles (Burdakov 2005; Hudson and Prinz 2010; Lamb and Calabrese 2013; Olypher and Prinz 2010), but the biophysical mechanisms underlying how they accomplish this are not known (Hudson and Prinz 2010; Nusser 2009). The understanding of these mechanisms may offer insight into how neuronal activity is maintained within functional boundaries and how these balances may be lost during disease or injury and conversely, how they may be restored once lost. Here, we examine standard models of neuronal activity, such as the FitzHugh-Nagumo (FHN) and Morris-Lecar (ML) models, in a novel way to show how combinations of different conductance levels can generate such a balance.
It has been shown that some redundancy exists in the parameter sets that give rise to certain attributes of activity (Olypher and Calabrese 2007; Olypher and Prinz 2010). In general, the existence of this type of redundancy is to be expected when an excess in the number of different parameters exists whose combinations lead to identical solutions. For instance, by moving the capacitance (C) to the right-hand side of the current balance equation in the two-dimensional (2D) version of the ML model (see Eq. 5 in methods) (Rinzel and Ermentrout 1998), one obtains a set of effective parameters given by the quotients GL/C, GCa/C, GK/C, and Iapp/C. Thus different combinations of these biophysical parameters that satisfy these quotients remain unchanged and give rise to identical solutions. Here, motivated by the results by Olypher and Calabrese (2007) on the existence of level sets, we go further, and instead of exploring the trivial relationships that result from applying this procedure, we examine the relationships that emerge in systems with a minimal number of parameters, where different combinations of them lead to nonidentical solutions but with the same values for at least one attribute of activity (e.g., period or duty-cycle level sets). These combinations of parameters generate attribute level sets in the considered parameter space. Minimization of the number of effective parameters in a dynamic model, as in the example above, is typically obtained by the so-called nondimensionalization process (Lin and Segel 1988), which includes the rescaling of time and some of the dynamic variables (e.g., voltage). The parameters in which we are interested (time or duty cycle) are those that are sufficient to determine the system's behavior without rescaling variables, since to be able to compare parameter sets with the same period or duty cycle, time is required, or to compare parameter sets with the same amplitude, the actual voltage is required, and therefore, they should not be rescaled. Consequently, as a rule, the minimum number of parameters needed for this study is larger than the minimal number of dimensionless parameters obtained by a nondimensionalization process.
In this study, we use the term “compensation” to mean the balance that two different ionic currents provide to generate equal values of a given activity attribute (i.e., to stay on the same level set). We use the term “dynamic” to express the fact that the conductance compensation that gives rise to the attribute level sets involves a change in the effective time scales of the system during the ongoing oscillations. This is in contrast to the more frequently used meaning of the term compensation: the ontogenic course of changes that are necessary after a perturbation to one current to restore an activity feature to its original state (Grashow et al. 2010; O'Leary et al. 2014; Turrigiano et al. 1994).
Since the existence of attribute level sets is an inherent property of dynamic systems (Doloc-Mihu and Calabrese 2014; Goldman et al. 2001; Hudson and Prinz 2010; Lamb and Calabrese 2013; Olypher and Calabrese 2007), it is natural to expect the underlying mechanisms to be captured by the properties of phase-space diagrams, one of the core tools used in dynamical systems analysis, of which we make heavy use.
Phase-space diagrams help to reveal the dynamics of a system at a glance by looking at some of its constituents, such as nullclines and trajectories. The nullclines are curves along which one of the variables has zero speed (e.g., Fig. 1B2). Trajectories are curves that join points in the phase space (or states) that the system traverses as time progresses, starting at a specified initial condition, according to the properties of the underlying vector field, which determine the rules that govern the dynamics.
Fig. 1.
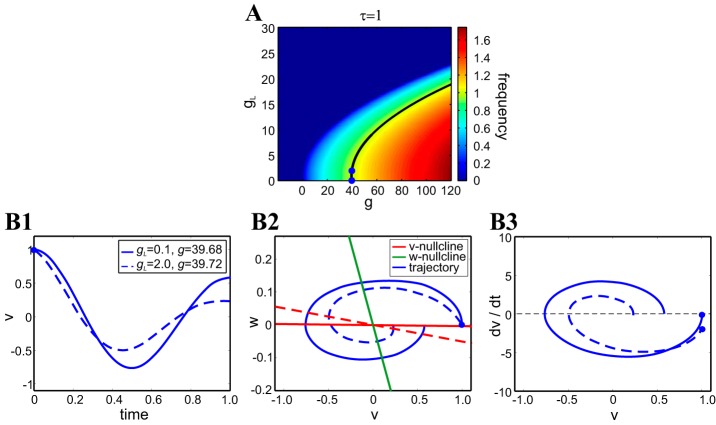
Coregulation in the 2-dimensional linear model for representative parameter values. A: frequency level sets on the gL–g parameter space for τ = 1, C = 1. Note that for C = 1, gL = γL, and g = γ. The black curve is the frequency level set corresponding to Ω = 1. Frequency values are coded as shown in the colored vertical bar. B: oscillatory solutions for 2 representative values of gL and g (blue dots on the black curve in A). The points were chosen to be very close to ensure a clear example, since at higher values of g and gL, the amplitude attenuates extremely rapidly, and oscillations are harder to distinguish. B1: superimposed voltage traces for the duration of 1 period. B2: superimposed phase planes. Solid and dashed curves for all colors correspond to the parameter values indicated in the B1 boxed key. B3: superimposed v-speed graphs. The decay times are Λ = −0.55 (gL = 0.1) and Λ = 1.5 (gL = 2). The blue dots indicate the initial point on the curves in B1–B3.
The intersection of all nullclines defines the equilibrium (fixed) points of the system. They, together with the nullclines, organize the dynamics of the state variables. For example, if the system has only one stable fixed point, then all trajectories move in its direction and eventually converge to it. If, instead, the system has no stable fixed points, then it may have a stable limit cycle (periodic solution) toward which trajectories converge, thus describing oscillatory solutions. Unlike fixed points, limit cycles are not immediately apparent from the shape and location of the nullclines, but they can be inferred, given enough knowledge about the system. The FHN and ML systems that we study here are two such systems and are often used as simplified versions of neuron-like systems.
Persistent intrinsic oscillations in individual neurons emerge as the result of the interaction among the participating currents (ionic, passive, and capacitive). However, there are common dynamic mechanisms with qualitatively similar underlying phase-space diagrams that underlie the generation of oscillatory activity regardless of the identities and biophysical details of these currents. Therefore, our results will have implications that go beyond the specific examples and parameter sets that we consider in this paper. For example, oscillations require the interaction between positive- and negative-feedback processes with different time constants: the positive (fast) feedback causes an increase or a decrease in voltage, whereas the slower (delayed) negative-feedback effect opposes such voltage changes. These mechanisms are captured by the geometric and dynamic structure of the phase space, such as similar types of nullcline nonlinearities and differences in time scales (Ermentrout and Terman 2010; Izhikevich 2006).
In this paper, we will examine the hypothesis that level sets originate from the interaction of different effective time scales, resulting from different combinations of maximal conductances. We use the term effective time scales, defined as the time scales at which a system actually operates and are influenced, but not determined, by the time constants of the model. They emerge as the consequence of the dynamics of the model, partly due to the presence of nonlinearities in the voltage dependencies, and they may change orders of magnitude as the system evolves. How these effective time scales are generated and how they operate to maintain the same attribute value for different parameter values of a system are not well understood and are the main goals of this paper. More specifically, we investigate the mechanisms that give rise to period and duty-cycle level sets for different combinations of parameter values, particularly the maximum conductances of the ionic currents, from both biophysical and dynamic perspectives in models exhibiting intrinsic oscillations. Because of the various discrepancies in the time constants associated with the generation of oscillatory activity, the compensation mechanisms responsible for maintaining the constancy of a given attribute are expected to be dynamic, involving different changes in the time course of the voltage during the oscillation period, as opposed to generating identical voltage traces for different combinations of parameter values. In other words, we show that although level sets are shown to depend on two fixed quantities (i.e., the maximum conductances of the ionic currents involved), they are not simply the result of an arithmetic addition of the currents but that their intrinsic dynamic (on a cycle-by-cycle basis) is of crucial importance.
METHODS
Models
Linear models.
We will use the linearized conductance-based model used in Richardson et al. (2003) and Rotstein and Nadim (2014)
| (1)) |
| (2)) |
where v represents voltage (in millivolts); w represents a gating variable (millivolts); gL and g are the maximum conductances (in millisiemens/square centimeter); C is the membrane capacitance (in microfarads/square centimeter), here set to C = 1; t is time (in milliseconds); and τ is the time constant of the gating variable w (in milliseconds). In all models used here, voltage, time, time constants, capacitance, and maximum conductances have the same units, with the exception of the gating variables that are dimensionless in the subsequent models.
Nullclines are obtained by solving w as a function of v after setting dv/dt = 0 in Eq. 1 (v-nullcline is ), and dw/dt = 0 in Eq. 2 (w-nullcline is w = v).
The FHN model.
We will use the following FHN model (Fitzhugh 1960; Nagumo et al. 1962)
| (3)) |
| (4)) |
As in the linear case, the variables v and w describe the voltage and gating variable of the system, respectively. The parameters h, a, α, λ, and ε are constants, all positive with the exception of λ, which can be any real number. The parameters a and h control the shape of the v-nullcline. For all positive values of a and h, the local minimum of the v-nullcline occurs at (0, 0). The maximum of the v-nullcline occurs at 2/3 a h−1, 4/27 a3h−2, which is equal to (1, 1) for the canonical parameter values h = 2 and a = 3. The parameters α and λ control the slope of the w-nullcline and its displacement with respect to the v-nullcline, respectively. The parameter ε represents the time-scale separation between the variables v and w, with largest separation given by ε << 1. We use ε = 0.01, which is a typical value used to characterize neuronal activity with this model (Clay and Shrier 1999; Deng et al. 2010; Rotstein et al. 2012) and determines that the recovery variable w behaves distinctly more slowly than the voltage v. We caution that the notation we use here is slightly different from the original notation (Fitzhugh 1960; Nagumo et al. 1962). Oscillations in the FHN model are generated through a Hopf bifurcation for values of λ above the critical value [see Rotstein et al. (2012)]. The Hopf bifurcation is subcritical, provided α < 2a2/(3h). The Hopf bifurcation for the parameter values we are using is supercritical.
The ML model.
Here, we use two variants of the ML model. The current balance equation for the 2D version (Rinzel and Ermentrout 1998) of the ML model (Morris and Lecar 1981) is given by
| (5)) |
where v is the membrane potential, t is time, C is the membrane capacitance, Iapp is the applied bias (DC) current (microamperes/square centimeter), IL = GL (v − EL) is the leak current, ICa = GCa m∞(v) (v − ECa) is a Ca2+ current with a fast-activation variable m = m∞ (v) slaved to voltage, and IK = GK w (v − EK) is a noninactivating K+ current with activation-gating variable w. The parameters GL, GCa, and GK are the maximal conductances (millisiemens/square centimeter), and the parameters EL, ECa, and EK are the reversal potentials of these currents (all in millivolts). The gating variable w obeys the following differential equation
| (6)) |
where w∞(v) and τw(v) are the voltage-dependent activation and time constants, respectively. ϕ determines the rate of change of variable w relative to the voltage and is typically small—here, 0.01. The functions m∞(v), w∞(v), and τw(v) are given by
| (7)) |
| (8)) |
| (9)) |
We have analyzed two parameter regimes of this model, which give rise to the two qualitatively different excitability types (so-called I and II) and differ in the dynamic mechanisms that govern the transition from rest to periodic spiking as Iapp increases (Ermentrout and Terman 2010; Izhikevich 2006) and other dynamic properties, such as the shape of the phase-response curves. Type I neurons involve a saddle node in an invariant circle (SNIC) bifurcation and admit very small spiking frequencies (infinitesimally small frequencies in model neurons). Type II neurons involve a (subcritical) Hopf bifurcation, and excitability occurs through a jump in frequency from zero to a finite spiking frequency. In addition, type II neurons exhibit bistability between rest and spiking for a range of values of Iapp, which is absent in type I neurons. These two different bifurcation mechanisms are accompanied by differences in the relative, effective time scales near the lower knee of the v-nullcline (see and compare Figs. 6B and A3A2) and are therefore expected to have qualitatively different effects on the generation of level sets and the underlying mechanism that gives rise to them. However, we did not observe substantial, qualitatively different behaviors between the two regimes and thus present some of the results for the ML-SNIC model (see appendices b and c), while focusing on our characterization of the ML-Hopf model. For both model types, we use the following parameter values (Ermentrout and Terman 2010): C = 20 (in microfarads/square centimeter), EL = −60, ECa = 120, EK = −84, GL = 2, V1 = −1.2, V2 = 18 (millivolts). For type I neurons (ML-SNIC model), we will use Iapp = 80 μA/cm2, V3 = V5 = 12 mV, and V4 = V6 = 17.4 mV. For type II neurons (ML-Hopf model), we will use Iapp = 80 μA/cm2, V3 = V5 = 2 mV, and V4 = V6 = 30 mV. The default values of GCa and GK are the following: GCa = 4 mS/cm2 (ML-SNIC), GCa = 4.4 mS/cm2 (ML-Hopf), GK = 6 mS/cm2 (both models).
Fig. 6.
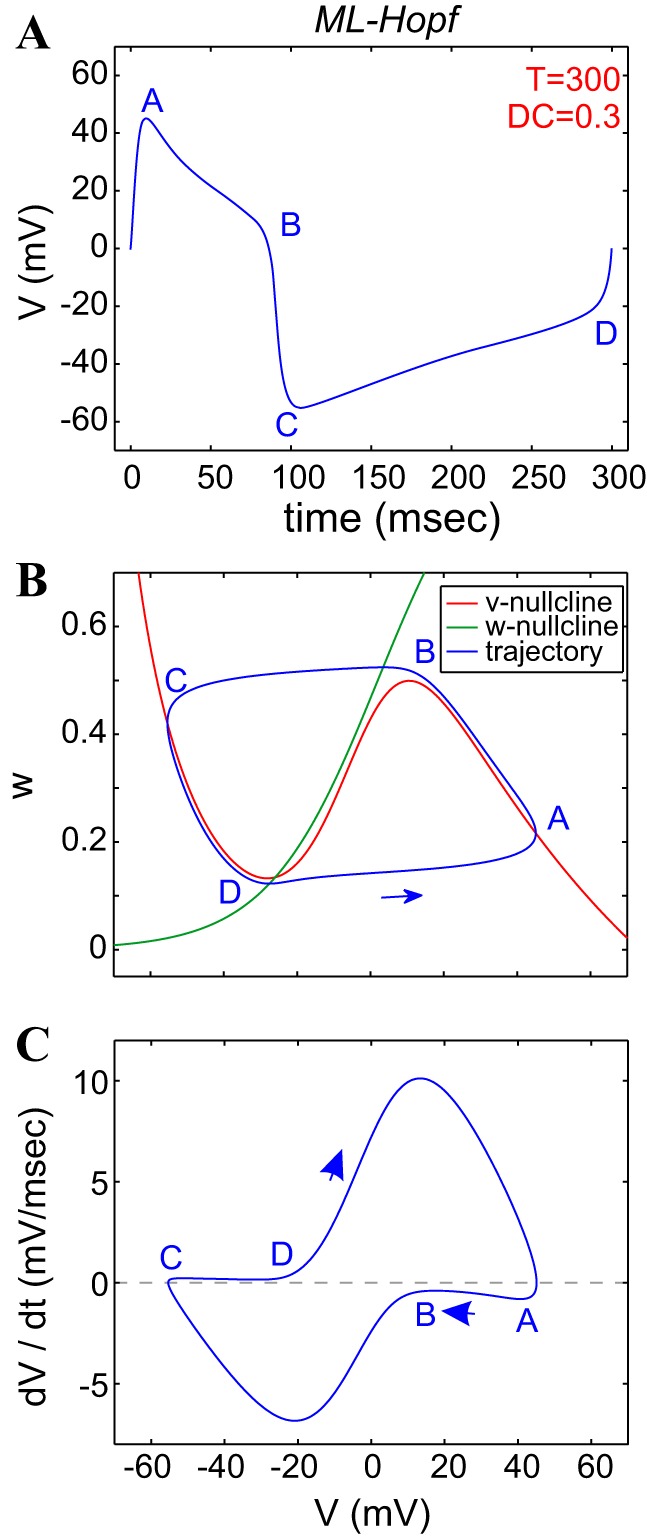
The dynamics of the Morris-Lecar (ML)-Hopf model. The parameters of the ML-Hopf model are the following: GCa = 4, GK = 6, and Iapp = 79.8. The value of Iapp was tuned so that T = 300 ms. A: voltage trace (time course) during 1 oscillation period. B: phase plane. C: v-speed diagram; ϕ = 0.01. GCa and GK are in millisiemens/square centimeter and Iapp in microamperes/square centimeter.
Heat Graphs, Admissible Regions, and Attribute Level Sets
Models that are able to exhibit intrinsic oscillations do so for a restricted set of parameters, which we refer to as the admissible parameter set. These parameter sets generate admissible regions in the corresponding parameter space. Figures 1A and 2 show examples of these admissible regions for the linear model described by Eqs. 1 and 2 and the FHN model described by Eqs. 3 and 4, respectively. In Fig. 1, oscillations are damped, whereas in Fig. 2, oscillations are persistent.
Fig. 2.
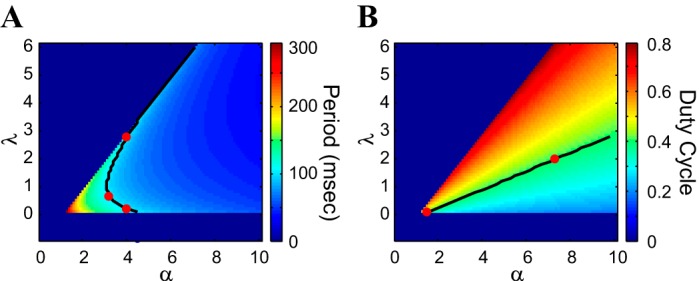
Period and duty-cycle level sets for the FHN model in the λ–α parameter space. A: period; B: duty cycle. The colored bars code for the values of the corresponding attribute. The red dots refer to point in these maps that are further examined and described (see Level sets in the λ–α parameter space: compensation mechanisms and Fig. 3). We used the canonical parameter values for the v-nullcline (h = 2 and a = 3). Black curves: period level set for T = 100 (A); duty-cycle level set for DC = 0.4 (B); ε = 0.01.
Attribute level sets correspond to the curves joining points with the same attribute value (see Fig. 1A, for example). Clearly, the admissible regions are independent of the attribute considered here, since we are focusing on attributes of oscillatory activity. In this paper, we investigate the mechanisms of generation of level sets for two attributes: period (or frequency) and duty cycle. Since we are not interested in the actual attribute value but on its level sets, we use either period or frequency heat graphs to visualize the regions of equal attribute value. When frequency heat graphs are used (e.g., Fig. 1A), the zero value is used to indicate the absence of oscillations (i.e., zero frequency).
Dynamical Systems Tools: Phase-Plane and v-Speed Diagrams
We use a combination of numerical simulations and dynamical systems tools to provide a geometric/dynamic explanation of the mechanism underlying the generation of level sets in oscillatory systems. Phase-plane analysis is a useful geometric tool for building a qualitative understanding of the evolution of a dynamical system (Strogatz 1994) in terms of the properties of the underlying vector field. Under the appropriate circumstances, the properties of the limit-cycle trajectories corresponding to oscillatory systems are captured by the system's nullclines and the time-scale separation between the participating variables. However, trajectories in the phase plane are parametrized by time, and thus they contain no information about the speed of the participating variables, particularly v. This information can be revealed by using so-called v-speed diagrams (speed graphs) consisting of curves of dv/dt vs. v (e.g., Fig. 1B3). These graphs reflect the effective time scales at which the system evolves in different phases of the oscillations or portions of the limit cycle.
It is important to note that these effective time scales are not necessarily given by a specific model parameter but are the result of a dynamic effect and may vary along the limit cycle. For instance, for small-enough values of ε (Eq. 4), such as the ones we use here, there is a time-scale separation between v and w in the FHN model (Eqs. 3 and 4). In the absence of any other consideration, very small values of ε determine that w evolves much slower than v, thus generating almost horizontal trajectories between low and high voltages in the phase plane (e.g., Fig. 3A2, points B–C), characteristic of most neuronal systems. However, when the trajectories are very close to the v-nullcline, both dv/dt and dw/dt are small and often have the same order of magnitude. This gives rise to the slow dynamics in the portions of the limit cycle where the trajectory moves along the left and right branches of the cubic v-nullcline. This cannot be predicted by simply looking at the model parameters. Furthermore, close proximity of the fixed point to the lower knee of the v-nullcline creates slow dynamics of the voltage trajectory around the values of v in the vicinity of this lower knee (e.g., Fig. 3A3, point B) compared with other portions of the limit-cycle trajectory, including the vicinity of the upper knee (see Fig. 3A3, point D).
Fig. 3.
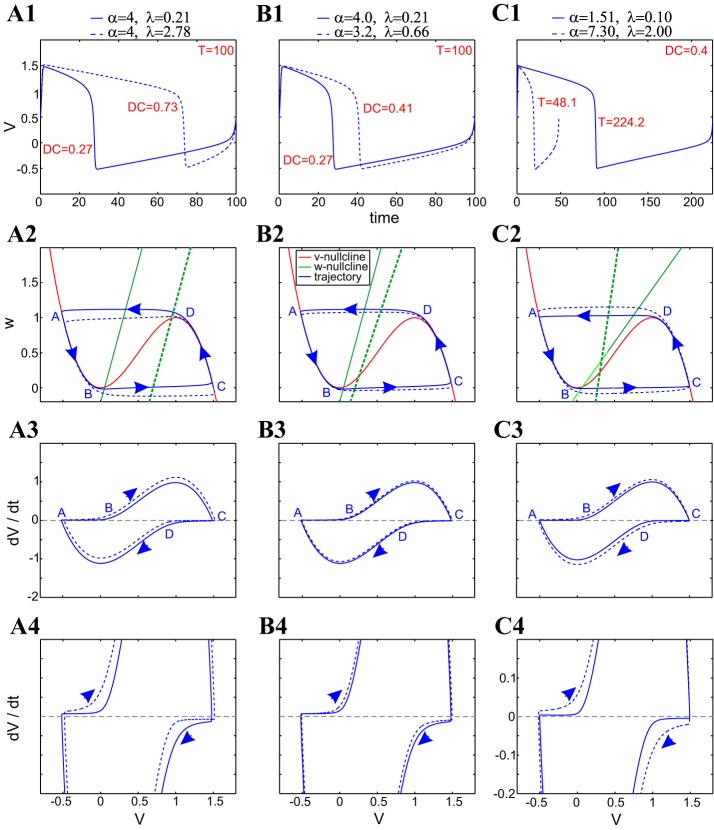
Compensation mechanisms for period and duty-cycle level sets in α–λ parameter space for the FHN model. A1, B1, C1: superimposed voltage traces. A2, B2, C2: superimposed phase planes. A3 and A4, B3 and B4, C3 and C4: superimposed v-speed graphs. T = 100 level sets with the same value of α (A1–A4); T = 100 level sets with different values of α (B1–B4); DC = 0.4 level sets (C1–C4). For all conditions, h = 2, a = 3, and ε = 0.01.
Changes in the biophysical parameter values that cause changes in the properties of the resulting oscillations are reflected in changes in the structure of the phase space and the speed diagrams. If balanced combinations of biophysical parameters with respect to a given attribute yield identical solutions, then the corresponding phase-space and speed diagrams are identical. If not, as is the case considered in this paper, then these diagrams are helpful in identifying and understanding the compensatory mechanisms that lead to the generation of level sets.
Numerical Simulations
Simulations were performed using the modified Euler method (Burden and Faires 1980) (a Runge-Kutta method of order 2), coded in MATLAB (MathWorks, Natick, MA).
RESULTS
2D Linear Systems
2D Linear systems generate much simpler dynamics than the FHN or conductance-based models, such as the ML model. In particular, they do not generate persistent—but damped—oscillations. Nevertheless, here, we show how linear models provide valuable insights into the geometric and dynamic ideas underlying the compensation mechanisms that give rise to attribute level sets and the admissible regions in parameter space. These models also have the advantage of being analytically solvable.
Damped oscillations: linear attributes.
Stable oscillations in 2D linear systems are damped (except for a very restricted set of parameter values). They are characterized by two attributes: the oscillation frequency (Ω) and the oscillation amplitude decay time (Λ), corresponding to the real and imaginary parts of the eigenvalues, respectively. For the linearized, conductance-based model (Eqs. 1 and 2)
| (10)) |
where, γL = gL/C and γ = g/C.
The Ω and Λ level sets for the attributes Ω and Λ are given by
| (11)) |
for fixed values Ω̂ and Λ̂, respectively. The Ω level sets are surfaces in γ − (γL − τ) parameter space, whereas the Λ level sets are curves in γL − τ parameter space. Clearly, if we fix the value of τ, then the Ω level sets are curves in γ − γL parameter space (Fig. 1A), and no Λ level sets exist.
In what follows, we will consider only the Ω level set, and without loss of generality, we will fix C = 1. Solutions corresponding to the same Ω level set in g − gL parameter space are different, since the larger gL, the larger Λ in absolute value, and therefore, oscillations decay faster.
The shape of the admissible sets.
Changes in τ introduce changes in the time-scale separation among the participating variables, since τ only regulates the rate of change of w and not v. τ also modifies the properties of the admissible region in g − gL parameter space (Fig. 1A) by changing its range (shrinking or expanding it) but otherwise, does not introduce qualitative changes to the admissible sets (not shown). The shrinkage of the admissible region can be understood by looking at the effect of τ on the radicand in Eq. 11. The larger τ is, the smaller the range of values of gL and g, for which this radicand is positive.
Linear compensatory mechanisms.
Figure 1B illustrates the compensation mechanisms that help in maintaining a constant oscillation frequency for two nonidentical solutions corresponding to different values of gL and g (see Fig. 1A) on the level set for Ω = 1 (also see Fig. 1A). For the parameter values in Fig. 1B, the two solutions have the same initial conditions (see phase-plane diagrams in Fig. 1, B1–B3), but the phase-plane diagrams are different (marked by two different v-nullclines), as well as the orbits that these solutions generate in the phase-plane diagrams. The speed trajectories are also different (Fig. 1B3).
For the oscillation frequency to be maintained, a compensation of the relative speed of the two damped oscillators must occur, and it must occur as follows: the oscillation for gL = 2 initially decreases faster than for gL = 0.1 (Fig. 1, B1 and B3). As time progresses, there is an inversion in the relative speeds of both trajectories (see speed graphs in Fig. 1B3). No other qualitative changes in the relative speeds of the trajectories are observed for the remainder of the period. With the expected additional complexity, compensatory mechanisms of this type are expected in the FHN and ML models, as discussed below.
The FHN Model
In this section, we investigate the compensation mechanisms responsible for the generation of period and duty-cycle level sets for the FHN model (Eqs. 3 and 4), a model often used as a caricature for neuronal dynamics, since it exhibits the stereotypical behavior and dynamical systems structure of neuronal models (Ermentrout and Terman 2010; Fitzhugh 1960; Nagumo et al. 1962). Although the FHN model lacks any biophysical description of the neuronal dynamics, it is an ideal system in which to begin to investigate the role of the geometric and dynamic properties of the phase plane in the compensation mechanisms of a generation of levels sets.
Four out of the five parameters in the FHN model (Eqs. 3 and 4) affect the geometric properties of the phase plane and consequently, the model's behavior. Changes in λ and α modify the shape of the w-nullcline and thus capture the effects of changes in the relative positions of the v- and w-nullclines (e.g., Fig. 3, A2, B2, and C2). Changes in a and h capture the effects of changes in the shape of the v-nullcline (e.g., Fig. 3A2). To restrict the complexity of the analysis, here, we focus on the level sets generated in the λ–α and a–h parameter spaces only. In appendix a, we characterize the effects of changes in values of parameters λ and α (see Effects of Changes in λ and α) and parameters a and h (see Effects of Changes in a and h) individually on the dynamic properties of the FHN model, to which we refer readers who are interested in how the general dynamical properties of this model relate to the issue of the constancy of activity features.
Figure 2 shows heat graphs for the period (Fig. 2A) and duty cycle (Fig. 2B) in the λ–α parameter space for the canonical v-nullcline (h = 2 and a = 3), and ε = 0.01. The period level sets are nonlinear: whereas period is a monotonically decreasing function of α (horizontal direction), increasing values of λ lead first to a decrease and then to an increase in period. The duty-cycle level sets, on the other hand, are quasilinear, with duty cycle as a decreasing function of α and an increasing function of λ.
Level sets in the λ–α parameter space: compensation mechanisms.
Figure 3 shows superimposed traces, phase planes, and speed diagrams for representative combinations of values of α and λ on the same period (T = 100; Fig. 3, A and B) and duty-cycle (DC = 0.4; Fig. 3C) level sets shown in Fig. 2. Since the period level sets are nonmonotonic, we examine parameter sets on the same and different branches of the parabolic-like level set in Fig. 2A. Specifically, traces in Fig. 3, A and B, correspond to points on the T = 100 level set in Fig. 2A, with the same and with different values of α, respectively.
Period level sets are generated by compensation mechanisms in the relative speeds of the trajectories in vicinities of the two stable branches (points A–B and C–D) of the v-nullcline (Fig. 3A) that result in complementary duty cycles. The solid limit-cycle trajectory is slower than the dashed limit-cycle trajectory along the left branch and thus has a longer hyperpolarized state, but faster along the right branch (Fig. 3, A3 and A4), and thus has a shorter depolarized state. As λ increases, the fixed point moves toward the right with an increase in duty cycle, whereas period is conserved. A smaller, rightward movement of the fixed point can produce a reduction in period, together with an increase in duty cycle, but this can be compensated for by a simultaneous reduction in the slope of the w-nullcline, thus increasing the duty cycle enough to maintain the period constant (Fig. 3B).
Duty-cycle level sets are generated by a different type of mechanism than period level sets (Fig. 3C). An increase in the value of λ (with a fixed point below the center of the middle branch) causes an increase in the duty cycle. To balance this change in the duty cycle, the change in α must cause the limit-cycle trajectory to spend more time moving along the left branch of the v-nullcline compared with the right branch. This is achieved by increasing the slope of the w-nullcline (increasing α) so that its distance from the upper knee of the v-nullcline increases, and the distance from the lower knee of the v-nullcline decreases.
There are two main dynamic differences between period and duty-cycle level sets. First, whereas for the period level sets, the limit cycles are displaced in the phase plane, for the duty-cycle level sets, limit-cycle trajectories appear to be “contained” within the next-larger one. Second, whereas for period level sets, the relative v-speeds of the limit-cycle trajectories are different on different portions of the limit cycle (left and right branches and up and down), for the duty-cycle level sets, the limit-cycle trajectory changes evenly along all portions of the v-axis.
Level sets in the a–h parameter space: structure.
Figure 4 shows the heat graphs for the period and duty cycle in the a–h parameter space for α = 4 and λ = 0.1. Both the period (Fig. 4A) and duty-cycle level sets (Fig. 4B) are nonlinear, but the nonlinearities are not very pronounced. These level sets are increasing functions of both a and h (except for some restricted range of parameter values not shown). The amplitude level sets show more variation with changes in a and h than with changes in λ and α. Geometrically, the parameters a and h affect the shape of the v-nullcline (see appendix a, Effects of changes in a and h, for a detailed description of the effects of a and h on the dynamical properties of the model).
Fig. 4.
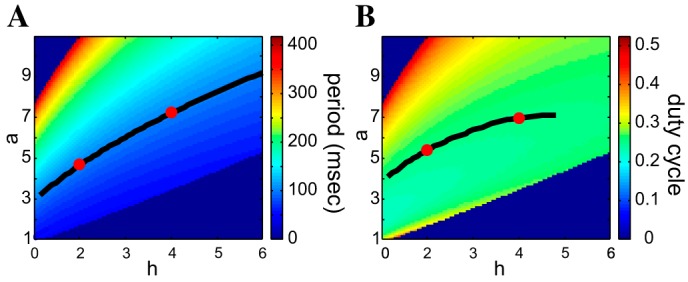
Period and duty-cycle level sets for the FHN model in the a–h parameter space. A: period; B: duty cycle. The colored bar codes for the values of the corresponding attribute; α = 4, λ = 0.1. Black curves: period level set for T = 100 (A); duty-cycle level set for DC = 0.25 (B); ε = 0.01.
Level sets in the a–h parameter space: compensation mechanisms.
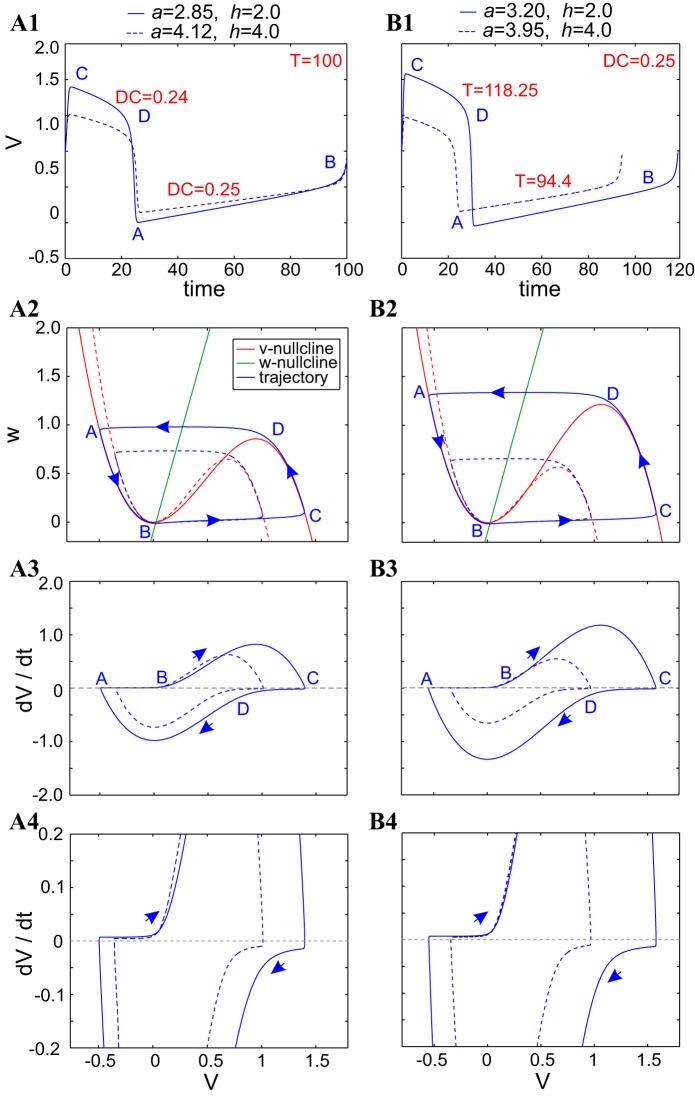
From the above discussion and the results in Fig. 4A, it follows that the compensation mechanisms that give rise to the period level sets involve changes in a and h in the same direction, thus giving rise to the level sets with a positive slope in Fig. 4A. However, as before, since these changes affect the effective time scales, in addition to the shape of the v-nullcline, the generation of level sets involves dynamic compensation mechanisms analogous to, but different from, those described before for the α and λ parameters. These mechanism are illustrated in Fig. 5 for the period (Fig. 5A) and duty-cycle (Fig. 5B) level sets, respectively. In Fig. 5A2, the dashed v-nullcline is “shallower” than the solid one. The larger distance that the solid limit-cycle trajectory has to traverse along the left and right branches is compensated for, by a higher speed along most of the limit cycle (see Fig. 5, A1, A3, and A4). This mechanism is different from the one discussed for the level sets in the α–λ parameter space, in that the relative speeds between the two limit-cycle trajectories are maintained along most of the limit cycle, in particular, along the slow manifolds (branches). The only portion of the limit cycle where the dashed trajectory is faster than the solid trajectory is during the rising phase (Fig. 5, A3/A4 and B3/B4).
Fig. 5.
Compensation mechanisms for period and duty-cycle level sets in a–h parameter space of the FHN model. A1 and B1: superimposed voltage traces. A2 and B2: superimposed phase planes. A3 and A4 and B3 and B4: superimposed v-speed graphs. All solid and dashed curves correspond to the parameter values indicated in the key (top). For all conditions, α = 4, λ = 0.1, and ε = 0.01.
The mechanism leading to the duty-cycle level sets (Fig. 5B) is qualitatively similar to the one described above for period level sets but involves smaller changes in a so that the increase in period is tuned to maintain the relation between the time spent by the trajectory along the active and silent phases. An interesting implication of this is that, as observed before, the trajectories and speed graphs along a duty-cycle level set tend to be contained within the next-largest one, as opposed to the trajectories and speed graphs along a period level set, which tend to cross each other along one or more branches.
ML Model
To obtain a better understanding of the compensation mechanisms leading to period and duty-cycle level sets in a more realistic neuron, we examined the mechanisms in the ML model (Eqs. 5–9). We focused on level sets, resulting from balanced changes in the maximal conductances, GCa and GK. Changes in these parameters affect the shape of the cubic-like v-nullcline and consequently, the effective time scales of the system, but not the shape of the w-nullcline.
As discussed in The ML model of methods, we considered two parameter regimes that are representative of the two different excitability mechanisms. We refer to them as ML-Hopf (type II) and ML-SNIC (type I) models. However, we discovered that whereas there are mechanistic differences between the effects of the two regimes, the underlying principles are qualitatively similar. Therefore, we have included the analysis of the dependence of activity and dynamical properties on the ML-Hopf model's parameters in appendix b and a complete description of the properties and compensation mechanisms that give rise to activity-feature level sets of the ML-SNIC model in appendix c. Figure 6 illustrates the voltage trace, phase-plane diagram, and speed graph for the ML-Hopf model, with Iapp tuned for the period to be 300 ms. For the ML-Hopf model (Fig. 6B), the w-nullcline intersects the v-nullcline in a vicinity of the lower knee, which is characteristic of type II excitability (Rinzel and Ermentrout 1998).
Period and duty-cycle level sets for the ML-Hopf model.
Figure 7 shows the period (Fig. 7A) and duty-cycle (Fig. 7B) heat graphs for the ML-Hopf model. The curves representing the period level set for T = 320 ms are shown in Fig. 7A, and the curve representing the duty-cycle level set for DC = 0.4 is shown in Fig. 7B (the period level set is also shown for comparison). The period level set has two branches, each one a monotonic function of both GCa and GK. As either GCa or GK increases (for fixed values of the other), the period first decreases and then increases.
Fig. 7.
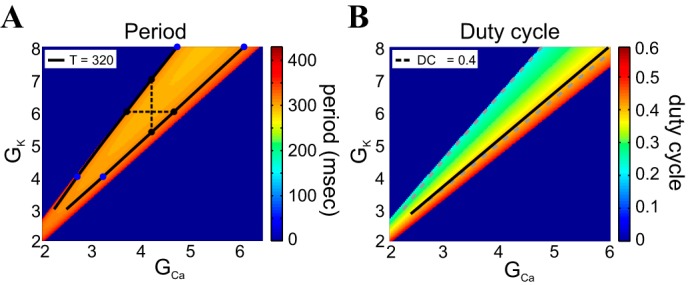
Period and duty-cycle level sets in the GCa–GK parameter space for the ML-Hopf model. A: period heat graphs; B: duty-cycle heat graphs. The colored bars code for the values of the corresponding attribute. The 2 solid black lines indicate the period level set for T = 320 ms (A). The single, solid black line indicates the duty-cycle level set for DC = 0.4; the dashed gray lines in the duty-cycle heat graph correspond to the position of the period level set and are shown here on the same parameter space for the sake of easy comparison between the 2 (B). The graphs were generated with parameter values: Iapp = 79.8 μA/cm2 and ϕ = 0.01. The black and blue dots in A indicate values used for analysis in subsequent figures, and the black, dashed lines connect points of equal conductance values (vertical for GCa; horizontal for GK) for visual reference. GCa and GK are in millisiemens/square centimeter.
Consequently, period level sets consist of two separate curves that join at their lower-left extremes (here truncated). In the heat graphs, we show only the relevant, quasilinear portions of the level sets. In contrast to period level sets, the duty-cycle level sets are monotonic. For fixed values of GK, as GCa increases, DC increases. For fixed values of GCa, as GK increases, DC decreases. Note that at least one branch of the period level-set curves (e.g., Fig. 7, A and B) and at least one duty-cycle level-set curve (e.g., Fig. 7B) are almost parallel, indicating that in some parameter regimes, both period and duty-cycle level sets are simultaneously maintained for this system.
Compensation mechanisms for the ML-Hopf model.
appendix b describes results that address the question of how changes in either GCa or GK affect period and duty cycle, and we refer the reader to that appendix. One important observation that comes out of that analysis is that increases in GCa and GK have opposite effects on the changes in the v-nullclines and the speed of the limit-cycle trajectories on both branches of the v-nullcline. This provides a partial qualitative explanation of the existence of period and duty-cycle level sets in the GCa–GK parameter space and the monotonicity properties (positive slope) of the period and duty-cycle level sets in Fig. 7: both conductances need to increase to maintain these features constant, since they have opposing effects. However, the following important questions remain open: 1) Are the v-nullclines corresponding to points on the same level set superimposed, i.e., are the phase-plane diagrams identical, or are there additional mechanistic components in operation to generate these level sets? 2) If so, are the mechanisms leading to the existence of level sets the same for changes in both GCa and GK? 3) Are the mechanisms leading to the existence of period and duty-cycle level sets qualitatively the same? 4) Are the mechanisms leading to the existence of level sets for points having the same value of either maximal conductance the same as for points having different values for both conductances? 5) If so, what are the mechanistic differences between points in the GCa–GK parameter space on the same line and across lines? Next, we address these questions.
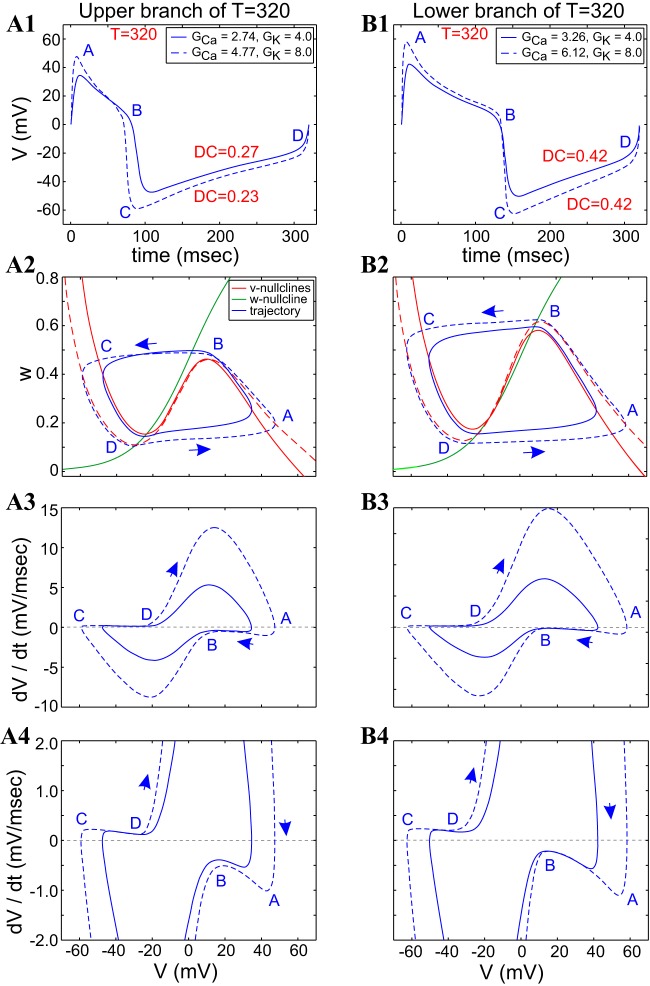
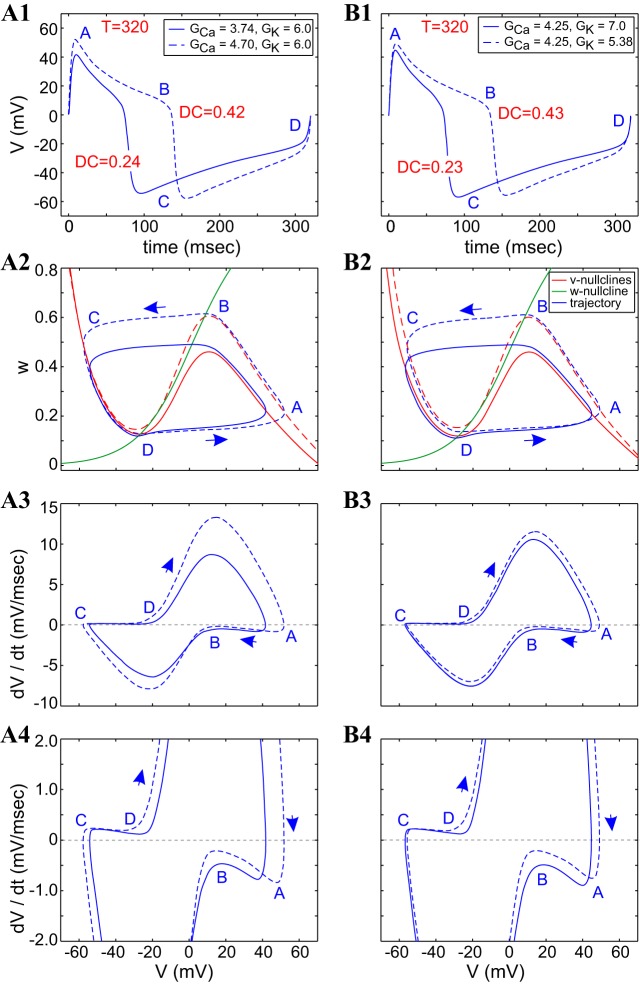
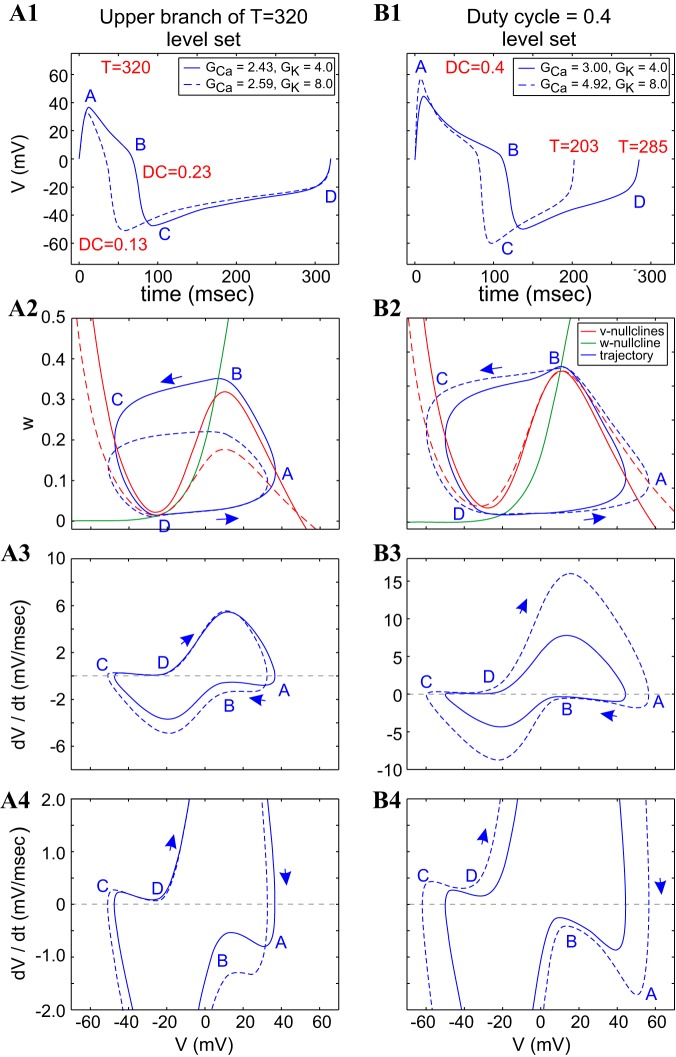
Figures 8 and 9 show the superimposed voltage traces, phase-plane diagrams, and v-speed diagrams for pairs of points in the GCa–GK parameter space on the same period level set (T = 320 ms) shown in Fig. 7 (see Fig. 7A). In Fig. 8, the two blue points on the top period level-set branch of Fig. 7A are shown in Fig. 8, A1–A4, and the two blue dots on the bottom period level-set branch of Fig. 7A are shown in Fig. 8, B1–B4. The compensation mechanisms leading to the generation of level sets with different values of both GCa and GK derive from the mechanisms explained (see Fig. A3; appendix b). The increasing values of GCa raise the v-nullcline, whereas the increasing values of GK shift it down, but they do so asymmetrically between the top and bottom portions of the limit cycles (Fig. 8A2): the amplitude minimum of the dashed limit cycle is well below that of the solid trace, whereas the amplitude maximum of the dashed limit cycle is close, but not parallel, to that of the solid trace. This results in trajectories that cross each other twice along their upper portions.
Fig. 8.
ML-Hopf model: compensatory dynamics along a period level set involves different combinations of GCa and GK values. The left and right columns correspond to the 2 extreme blue dots on the top (A) and bottom (B) branches of the period level set (solid black curves) in Fig. 7A. A1 and B1: superimposed voltage traces. A2 and B2: superimposed phase-plane diagrams. A3 and A4 and B3 and B4: superimposed v-speed graphs. Solid and dashed curves correspond to the parameter values indicated in the boxed keys in A1 and B1. Iapp = 80 μA/cm2; ϕ = 0.01. Note: the examples shown in B correspond to points along the lower branch of the period level set, which is close and almost parallel to the duty-cycle level set (shown in Fig. 7B). GCa and GK are in millisiemens/squared centimeter.
Fig. 9.
ML-Hopf model: oscillatory dynamics along period level set with the same value of either GK or GCa. A1–A4 and B1–B4 correspond to the cases marked with black dots on the period level set curves in Fig. 7A and joined by a dashed horizontal (A) and dashed vertical (B) lines, respectively. A1 and B1: superimposed voltage traces. A2 and B2: superimposed phase-plane diagrams. A3 and A4 and B3 and B4: superimposed v-speed graphs. Parameter values are the following: Iapp = 80 μA/cm2, ϕ = 0.01. GCa and GK are in millisiemens/square centimeter.
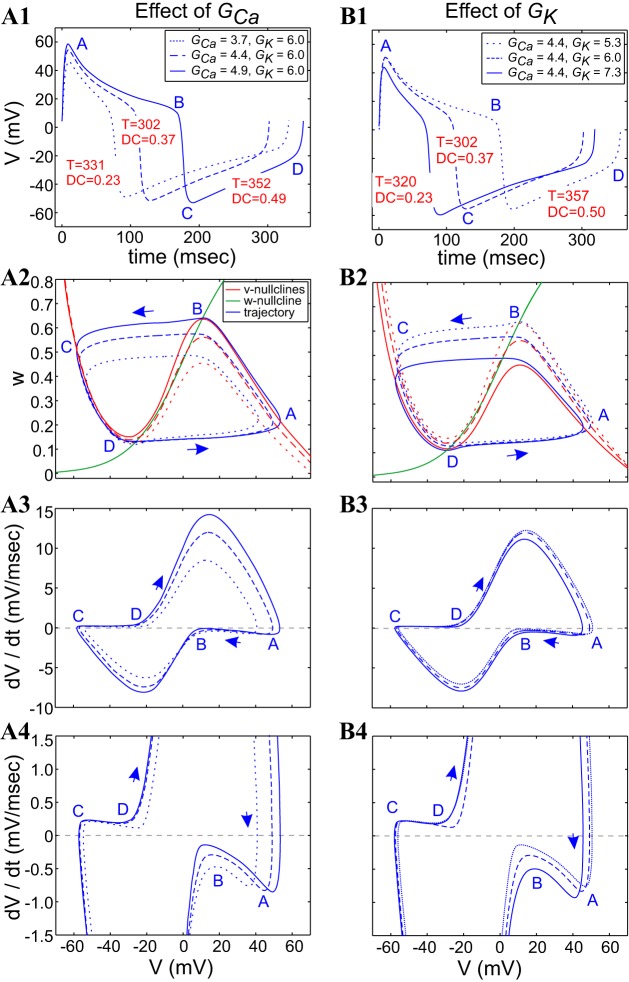
Fig. A3.
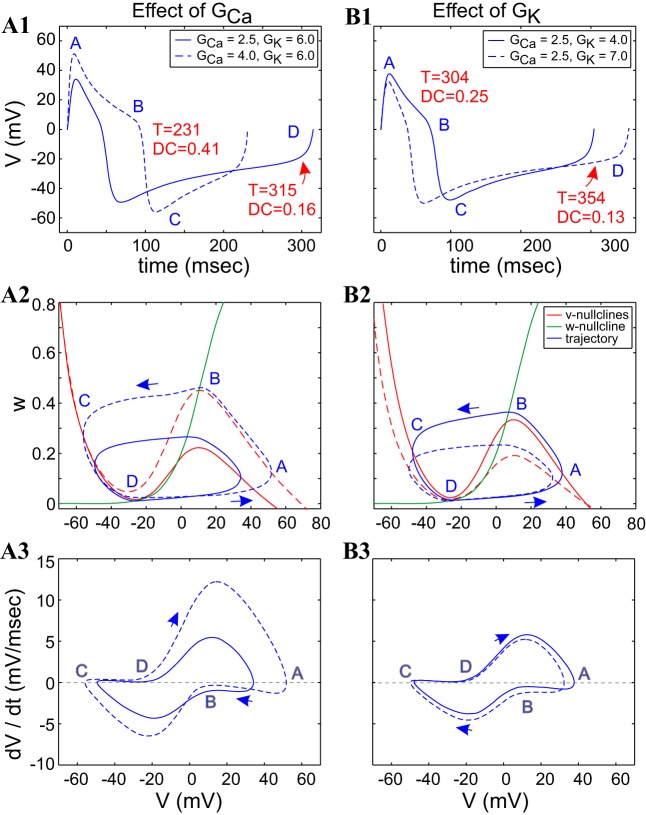
ML-Hopf model: dependence of the period and duty cycle on the values of GCa and GK. A: as GCa increases, the period first decreases and then increases, and the duty cycle monotonically increases. B: as GK increases, the period first decreases and then increases, and the duty cycle decreases. A1 and B1: superimposed voltage trace (time course) during 1 oscillation period. A2 and B2: superimposed phase-plane diagrams. A3 and A4 and B3 and B4: superimposed v-speed diagrams. We used the following parameter values: Iapp = 80 μA/cm2 and ϕ = 0.01. GCa and GK are in millisiemens/square centimeter.
A different situation is observed along the lower branch (Fig. 8B2) of the period level set shown in Fig. 7, where one limit-cycle trajectory is fully contained inside of the other limit-cycle trajectory. In addition, the portion of the left and right branches of the v-nullcline that are available for the limit-cycle trajectories to move along is larger for the dashed v-nullcline than for the solid one, and the distance between the w-nullcline and the left and right branches of the v-nullclines is larger for the dashed case than for the solid one, forcing a larger (absolute) speed for the dashed limit-cycle trajectory than for the solid one, especially on the active (points A–B) phase (Fig. 8B3).
A significant difference between the two cases (upper vs. lower branch of the period level set) is the presence of an additional fixed point in the vicinity of the upper knee in Fig. 8B2, which is closer to the maximum for the dashed v-nullcline than for the solid one.
In Fig. 8A, the larger speed for the dashed limit-cycle trajectory on the active phase (points D–A) compensates for the larger portion of the right branch that the limit-cycle trajectory has to move along. The dashed limit-cycle trajectory jumps down before the solid one, but it has to move along a larger distance in the silent phase. The speed of both limit-cycle trajectories is controlled by the fixed point near the minimum of the v-nullclines.
In Fig. 8B, the dashed limit-cycle trajectory moves faster at the beginning of the active phase, but it slows down, due to the presence of the fixed point near the maximum. This maintains not only the constancy of the period but also the constancy of the duty cycle. A similar effect occurs in the silent phase.
In Fig. 9, the two points on the level set in each column have the same value of GK (Fig. 9, A1–A4) or GCa (Fig. 9, B1–B4) but different values of the other maximal conductance. They correspond to the black dots on the period level-set branches joined by the horizontal and vertical dashed lines, respectively, in Fig. 7A. The compensation mechanisms leading to period level sets in Fig. 9 are qualitatively similar for constant values of GK (Fig. 9A) and constant values of GCa (Fig. 9B). They also derive from the mechanisms explained in the context of Fig. A3, which in essence, correspond to similar compensatory effects of increases in GK as decreases in GCa and vice versa: the v-nullcline raises by increasing in values of both GCa (Fig. 9A2) and decreasing values of GK (Fig. 9B2). In both cases, the portion of the left and right branches in which the limit-cycle trajectory has to move along is larger for the dashed v-nullcline than for the solid one. The duty cycle is smaller for the solid limit-cycle trajectory than for the dashed one, not only because of the shorter distance the solid limit-cycle trajectory has to move on the active phase but also because of the presence of a fixed point near the maximum for the dashed curve, which attracts the trajectory to that point and slows down its progress toward the hyperpolarized state, and the presence of a fixed point near the lower knee for the solid curve, which attracts it to the hyperpolarized state (Fig. 9B2). As before, note that the changes in speed along the fast portions of the trajectory (points D–A and B–C) have a much less significant effect than the speed changes along its slow portions (points A–B and C–D). This slows down the dashed limit-cycle trajectory more than the solid one along the active phase (points A–B in Fig. 9, A3 and A4 and B3 and B4), but compensation results when the dashed trajectory speeds up more than the solid limit-cycle trajectory along the silent (points C–D) phase. Again, this arises from the fact that the solid system has a fixed point on the v-nullcline close to the lower knee, whereas the dashed system has a fixed point on the v-nullcline near the upper knee (Fig. 9, A2 and B2).
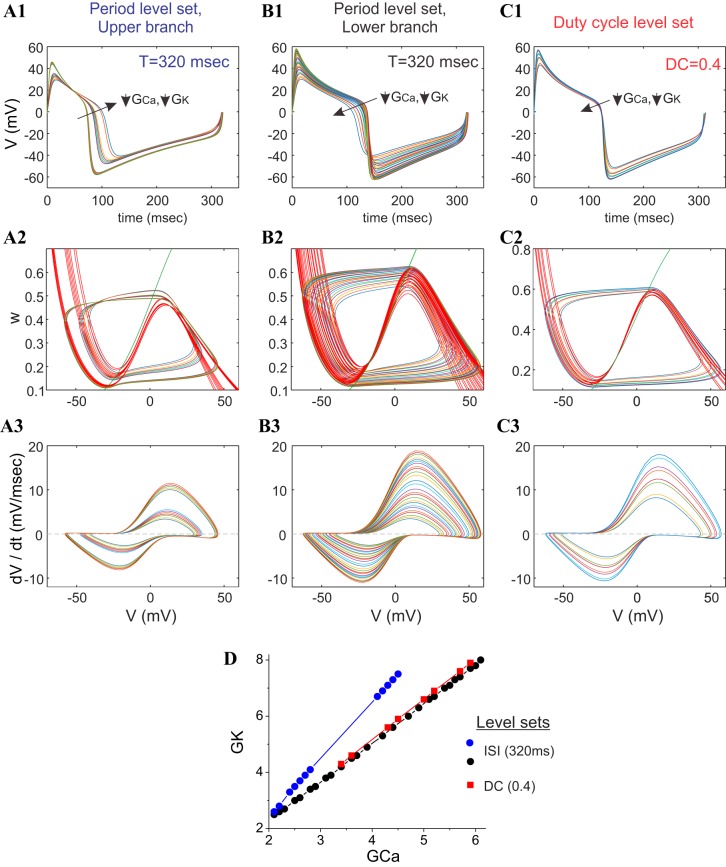
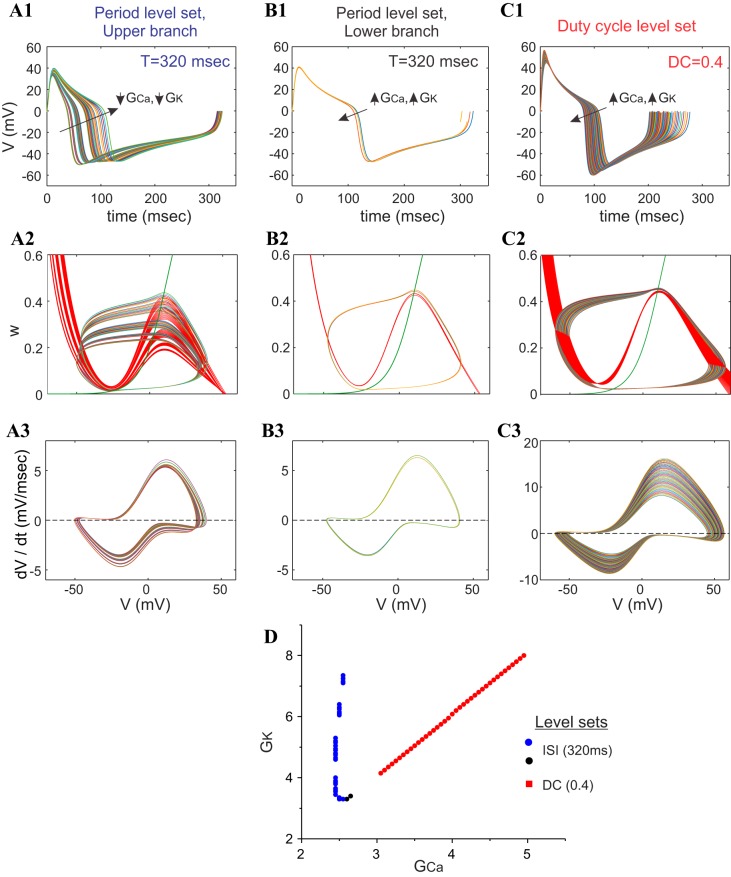
From a more global standpoint, we observe that systems whose period level sets are close and parallel to duty-cycle level sets (Figs. 7B and 10D) are characterized by voltage traces that are almost vertically scaled versions of each other, having positive and negative peaks that occur at nearly the same time, and are (obviously) almost identical in the horizontal (time) direction (Figs. 8B1 and 10B1). At the same time, each limit-cycle trajectory in the phase plane along this branch of the period level set (Figs. 8B2 and 10B2) and along the duty-cycle level set (Figs. 8B2 and 10C2) is fully contained within the next-largest one. Likewise, we observe that the v-speed graph curves also appear fully contained within the next-largest one along these levels sets (Figs. 8B3 and 10, B3 and C3). In contrast, we observe that systems whose period level sets are not parallel to any duty-cycle level sets behave very differently, with voltage traces whose maxima and minima vary substantially from each other along the level set (Figs. 8A1 and 10A1). The limit-cycle trajectories in the phase plane along this branch of the period level sets (Figs. 8B2 and 10B2) appear to shift up or down and/or left or right in such a way that they appear always to cross over each other significantly (Fig. 10A2). Likewise, in this version of the ML model, we do not observe significant crossovers of the v-speed graphs along this level set (Fig. 10A3).
Fig. 10.
Behavior of the ML-Hopf model along the different portions of the period and duty-cycle level sets. A1, B1, and C1: superimposed voltage traces. A2, B2, and C2: superimposed phase planes. A3, B3, and C3: superimposed v-speed graphs along the upper branch of the period level set (T = 320 ms; A), lower branch of the period level set (T = 320 ms; B), and duty-cycle level set (DC = 0.4; C). D: level sets from which A–C are taken. Traces are color coded, and the traces with the highest voltage maxima and minima values have the largest GCa and GK values. GCa and GK are in millisiemens/square centimeter. ISI, interspike interval or period.
DISCUSSION
Variability of the parameter values that determine neuronal activity has been amply reported (Etheredge et al. 2007; Goldman et al. 2001; Golowasch 2014; Khorkova and Golowasch 2007; Leao et al. 2012; Liss et al. 2001; O'Leary et al. 2013; Olypher and Calabrese 2007; Ransdell et al. 2012; Schulz et al. 2006, 2007; Swensen and Bean 2005; Temporal et al. 2012; Unal et al. 2012). At the same time, features of the neuronal activity that these parameters influence, such as activity-cycle period and phase relationships, are known to be well maintained, despite this variability (Bucher et al. 2005; Burdakov 2005; Goaillard et al. 2009; Golowasch 2015; Hudson and Prinz 2010; Lamb and Calabrese 2013; O'Leary et al. 2013; Olypher and Prinz 2010; Zhang and Golowasch 2011; Zhao and Golowasch 2012). The sets of parameter combinations that result in the same values of a chosen activity feature or attribute (e.g., period, duty cycle, and phase) constitute a level set. Whereas level sets have been shown to be pervasive in neuronal dynamics, the underlying biophysical and dynamic compensation mechanisms are not well understood.
We set out to examine these mechanisms in several models of varying degrees of complexity and realism (linearized, FHN, and ML of types I and II) for two attributes: period and duty cycle. We have identified the compensation mechanisms that can help us understand how level sets of these attributes can be produced. The overall conclusion from this analysis is that maximum conductances, which are constants, and thus static parameters that primarily determine the amplitude of each current interact with the dynamical properties of these currents in ways that allow for these temporal features to be maintained constant. In this sense, we describe the relationships between the currents involved as compensatory, because they balance each other out to generate activity with the same attribute level. Although our work shows what relationship the maximal conductances of these currents need to be, the distinct intrinsic dynamics of each current determine that on a level set, compensation is clearly not the result of a simple addition of currents. Furthermore, our results are consistent with the work of others, which shows that a perturbation to one parameter (e.g., the maximal conductance of one current) will lead to a change of activity (i.e., departure from the level set) (Etheredge et al. 2007; Grashow et al. 2010; Haedo and Golowasch 2006; O'Leary et al. 2014; Turrigiano et al. 1995). However, this departure can be restored by a modification of the maximal conductance of the partner current(s) toward the values on the level set. The temporal scale of time course required for these changes to occur is much longer than the effective time scales that we analyzed here, which correspond to the intrinsic dynamics of the system during each activity oscillation.
With the analysis of even the simplest linear model, we learned that such level sets arise because the system changes the effective rates at which it operates at different times along its voltage trajectory within a cycle. This can be best visualized by using a combination of analysis of the phase-plane and v-speed diagrams (e.g., Fig. 1). For the nonlinear systems (FHN and ML), the compensatory changes needed to maintain a level set in the time domain are not static, nor are they due to changes in the time constants of the currents, but instead, are due to changes in the time spent by the limit-cycle trajectories along the slow and fast manifolds. In biophysical terms, this means that the necessary compensations happen by the varying contributions that each current makes to the activity of a neuron at different points in time along the system's trajectory and not by the maximum values of their conductances. Such varying contributions change the effective time constants of each current at each time point along the way. The interaction of the different maximum conductance combinations and the different effective time scales that emerge result in period or duty-cycle level sets as a function of the maximum conductances.
Olypher and Calabrese (2007) have previously reported an in-depth analysis of parameter compensation that results in the generation of level sets. Their contribution focused on proving the existence of level sets in complex systems and in determining the number of parameters required, depending on the activity features being considered, for which they mainly relied on the use of the implicit function theorem. Our study focused instead on the biophysical mechanisms that generate level sets in the time domain (period and duty cycle). With the application of a dynamical systems approach to understand the existence of level sets, we discovered that, often, level sets are nonmonotonic, as is the case of period level sets in the ML system. Simplistically, one might imagine that period may remain constant as the inward ICa and the outward IK grow with increasing GCa and GK, respectively, since they oppose each other. Instead, these changes produce shifts in the relative positions of the v- and w-nullclines that push the system toward two different fixed points, depending on the relative values of these conductances. Each fixed point attracts the limit-cycle trajectory toward spending more time in either the more depolarized or the more hyperpolarized state, thus changing the duty cycle and/or the period. The compensatory changes needed to produce constant duty cycle, for example, when the system is attracted toward the more hyperpolarized fixed point are those that also then make it dwell longer around the depolarized fixed point. For this to happen, what may be required is a change in the speed with which the voltage changes between these states.
The ML model describes neuronal dynamics with different excitability properties associated to different types of bifurcations in the phase plane. Therefore, we asked whether the type of excitability affects the properties of the level sets and the mechanisms that underlie their generation. Dynamically, the main difference between the two models is the shape of the recovery (potassium) nullcline. Whereas we found some differences in the shapes of the level sets between the ML-Hopf (see ML Model in results) and ML-SNIC models (appendix c), the principles that govern the compensation mechanisms persist across models and allow us to hypothesize that they are more general than the models that we considered in this paper. More research is needed to test this hypothesis in 2D models, where oscillations arise from the combined activity of different pairs of currents [e.g., persistent sodium and either Ih or M-type potassium and inward-rectifying potassium and either Ih or M-type potassium], and perhaps more importantly, in higher-dimensional models. In higher dimensions, the relatively simple phase-plane analysis becomes significantly harder to perform. However, tools to reduce high-dimensional models to models that allow phase-plane analysis are frequently used and can be applied here, including the reduction of the effective number of variables that governs the subthreshold dynamics (Rinzel 1985) or the elimination of the spiking currents when they have little effect on the subthreshold dynamics responsible for controlling the activity attributes (Rotstein et al. 2006). Nevertheless, we hypothesize the general principle outlined above to be similar: in the time domain, compensations arise from the changes of effective time scales, as the ionic currents change along the voltage trajectory of a neuron. Further research is needed to confirm this hypothesis.
One interesting prediction for experimental neuroscience that arises from this study is our observation that a period level set is often characterized by limit-cycle trajectories in the phase plane that cross each other and v-speed diagrams that also tend to cross each other. By contrast, duty-cycle level sets show limit-cycle trajectories in the phase plane that contain each other, and the same is observed of their v-speed diagrams. Period level sets may show limit-cycle trajectories and v-speed diagrams that contain each other, but that occurs only when a period level set runs parallel to one of the duty-cycle level sets. This information could be used to identify the likely structure of a period level set by analyzing the activity of a neuron without any detailed information about its maximum conductance values and parameter space structure.
Models have different levels of the time-scale separation among the participating variables. In this study, we have used a relatively strong one. We hypothesize that the dynamic compensation mechanisms described in this paper are valid for more relaxed levels of the time-scale separation as well. However, the extent to which this is true requires further studies.
The compensation mechanism that we have identified relates the geometry of the phase plane with the existence of period and duty-cycle level sets in the GCa–GK parameter space of the ML model. These mechanisms are essentially based on the way in which changes in these parameters cause changes in the shape of the v-nullclines, which in turn, control the speed of the trajectory in different portions of the phase plane. However, it is expected that other parameter values cause different types of changes in the v-nullcline and also changes in the recovery variable nullcline. Additionally, it remains an open question as to whether the mechanisms we propose here persist and have more generality with respect to other activity features, such as oscillation amplitude or spiking frequency, for example.
Future studies should examine the details of the behavior of the currents flowing through the membrane, for which the obvious choice is to use the simplified conductance-based systems captured by the ML models. This type of study should be able to determine, with great level of detail, how each current compensates for the others to generate level sets and to establish, at the conductance level, what properties are necessary to accomplish this. We have, so far, discovered that it is not only the conductance levels but also the dynamics of each of these conductances that determine the compensatory properties necessary to generate level sets of different activity features. What remains to be understood is what the combined contribution of the kinetics of one or another current, the voltage-dependence properties of the different currents, and the maximum conductance levels is to the generation of the activity-feature level sets.
Whereas our results describe the dynamic compensation mechanism by which level sets are maintained, they do not describe the mechanisms leading to the system to choose a specific value of one maximal conductance upon changes in the other. This requires additional modeling that includes the level sets as system constraints. Further research is needed to clarify this point.
An important aspect of data-driven modeling is the determination of the model parameters based on experimental results. For this process to be efficient, one would like to use the minimal amount of information. The existence of level sets creates some ambiguity on the ability of determining the model parameters based solely on the attributes for which these level sets exist. Additional research should determine what additional information can be used or which experiments should be performed to disambiguate this.
GRANTS
Support for this research was provided by the National Institute of Mental Health (Grant R01_MH64711; to J. Golowasch) and the National Institute of Neurological Disorders and Stroke (Grant R56_NS085330; to J. Golowasch and H. G. Rotstein).
DISCLOSURES
No conflicts of interest, financial or otherwise, are declared by the authors.
AUTHOR CONTRIBUTIONS
H.G.R. and J.G. conception and design of research; H.G.R., M.O., and J.G. performed experiments; H.G.R., M.O., and J.G. analyzed data; H.G.R., M.O., and J.G. interpreted results of experiments; H.G.R., M.O., and J.G. prepared figures; H.G.R. and J.G. drafted manuscript; H.G.R., M.O., and J.G. edited and revised manuscript; H.G.R., M.O., and J.G. approved final version of manuscript.
Appendix A
Effects of Changes of the FHN Model Parameter on the Model's Dynamic Properties
Effects of changes in λ and α.
As a first step in understanding the compensation mechanisms generating the level sets presented in Fig. 2, it is useful to examine the effects of changes in a single parameter (λ or α) on both the oscillation patterns and the effective time scales along the corresponding limit cycles. Figure A1 illustrates these effects for the same parameter values as in Fig. 2. The effects of changes in λ are captured by comparing Fig. A1, A and B, and the effects of changes in α are captured by comparing Fig. A1, A and C.
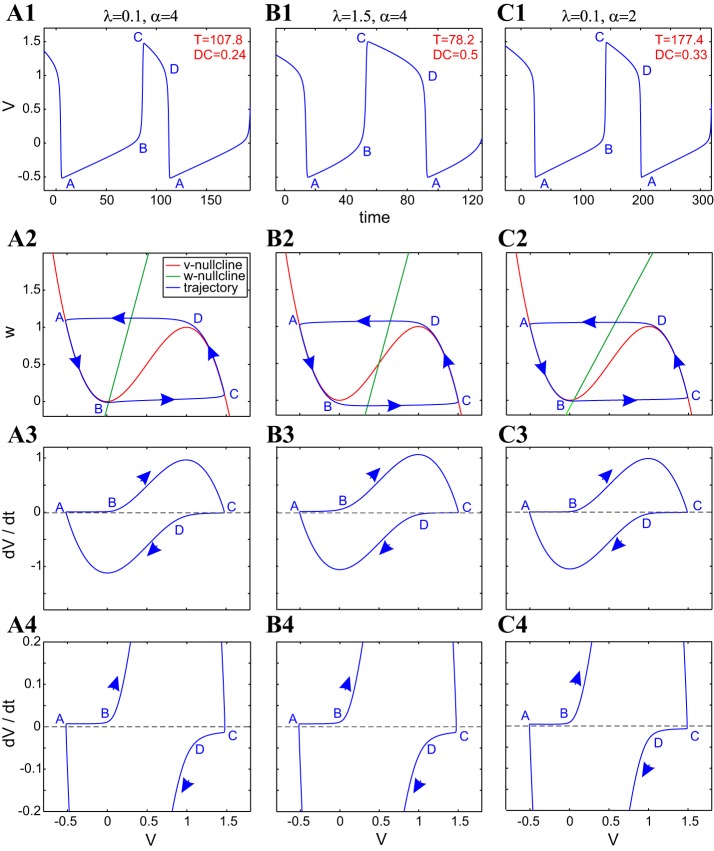
Fig. A1.
Dynamics of the FHN model as α and λ change. A1, B1, and C1: voltage traces. A2, B2, and C2: phase planes. A3 and A4, B3 and B4, and C3 and C4: v-speed graphs. α = 4, λ = 0.1, T = 107.8, DC = 0.24 (A). α = 4, λ = 1.5, T = 78.2, DC = 0.5 (B). α = 2, λ = 0.1, T = 177.4, DC = 0.33 (C). Other parameter values include the following: h = 2, a = 3, and ε = 0.01.
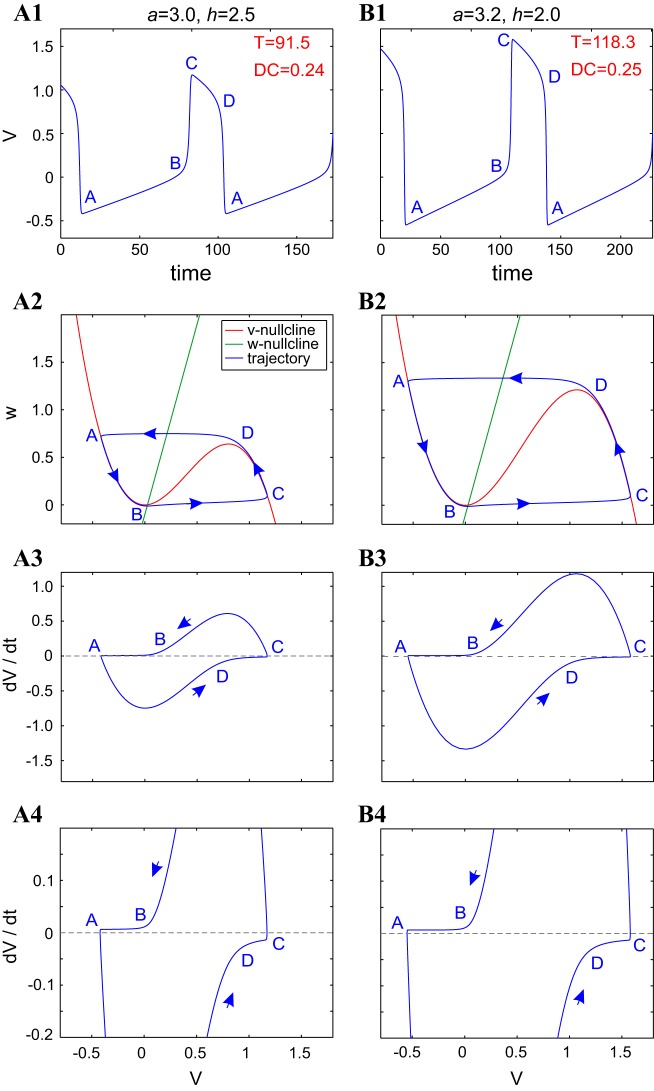
As noted in methods with a small value of ε (ε = 0.01), oscillations (Fig. A1, A1, B1, and C1) evolve in two well-separated time scales (fast and slow; Fig. A1, A2, B2, and C2), with the slow time scale corresponding to the evolution of the trajectory in close vicinity of the v-nullcline (portions A–B and C–D, corresponding to the silent and active phases, respectively) in the phase plane. The fast time scale corresponds to the jumps of the trajectory in between the slow manifolds (portions B–C and D–A). The v-speed graphs (Fig. A1, A3 and A4, B3 and B4, and C3 and C4) capture the voltage rate of change along the different portions of the limit cycle and therefore, the magnitude of the effective time scales and time-scale separation. These effective time scales are not uniform along the slow portions of the limit cycle.
Geometrically, the relative position of the two nullclines determines the relative speed of the trajectory on each branch of the v-nullcline. For instance, the close proximity of the fixed point to the lower knee of the v-nullcline (Fig. A1A2) creates a region of slow motion of the limit-cycle trajectory that extends the time the trajectory spends on the silent phase (portion A–B) compared with the active phase (portion C–D; compare Fig. A1, A1 with B1). As the increase in λ moves the fixed point toward the center of the middle branch (Fig. A1B2), the distances between the w-nullcline and the two local extrema of the v-nullcline become roughly the same, and the silent portion (A–B) and active portion (C–D) of the limit-cycle trajectory have roughly the same duration. In other words, an increase in λ causes the fixed point to move to the right (see the transition from Fig. A1, A1 to B2), and therefore, increases in λ cause an increase in the duty cycle. In addition, there is a decrease in the period caused by the reduced time spent near the lower knee of the limit-cycle trajectory. A further increase in λ (not shown) causes the distance between the w-nullcline and the local maximum of the v-nullcline to decrease and the DC to increase further, as the limit-cycle trajectory is attracted to a more depolarized fixed point. However, for a critical value of λ, the period begins to increase due to a decrease in the speed of the limit-cycle trajectory near this depolarized fixed point. The fact that the same period can be achieved for two different duty cycles (longer duration in the passive phase and longer duration in the active phase) explains the nonmonotonic dependence of the period with changing values of λ and the curved level set observed in Fig. 2A.
Changes in the value of α cause changes in the slope of the w-nullcline, which in turn, causes changes in the relative distances between this nullcline and the local extrema of the v-nullcline and therefore, changes in the speed of the limit-cycle trajectories. A decrease in the value of α, for instance, causes a decrease in the slope of the w-nullcline (compare Fig. A1, A2 with C2), accompanied by an increase in both the period and the duty cycle. For lower values of α (e.g., α = 2 in Fig. A1C2), the w-nullcline is closer to the upper knee than for higher values of α (e.g., α = 4 in Fig. A1A2). However, there is no significant difference in their distance from the lower knee for both values of α, and so the limit-cycle trajectory spends more time in the vicinity of the upper knee of the v-nullcline for α = 2 than for α = 4, hence the longer period, as well as duty cycle.
Effects of changes in a and h.
The parameters a and h affect the shape of the v-nullcline. Specifically, they control the location of its local maximum (upper knee), given by (2/3 a h−1, 4/27 a3 h−2), whereas the local minimum (lower knee) is located at the origin for all values of a and h (Fig. A2, A2 and B2). Both coordinates of the local maximum are increasing functions of a and decreasing functions of h, and therefore, increasing (decreasing) values of a cause the maximum to move to the right (left) and upward (downward), whereas increasing (decreasing) values of h cause the maximum to move to the left (right) and downward (upward). Changes in a and h modify the length of the portions of the v-nullcline (left and right branches) that the trajectory follows during the slow phases (compare Fig. A2, A2 with B2) and therefore, the period (compare Fig. A2, A1 and B1), which increases with increasing values of a and decreasing values of h.
Fig. A2.
Dynamics of the FHN model for representative parameter values. A1 and B1: voltage traces. A2 and B2: phase planes. A3 and A4 and B3 and B4: v-speed graphs. a = 3, h = 2.5, T = 91.5, DC = 0.24 (A). a = 3.2, h = 2, T = 118.3, DC = 0.25 (B). Other parameter values include the following: α = 4, λ = 0.1, and ε = 0.01.
Changes in a and h modify the effective time-scale separation between the variables v and w. This is reflected mostly on the fast time scale (compare Fig. A2, A3 with B3), whereas the slow time scale remains almost unaffected (compare Fig. A2, A4 with B4). The change in the period as the result of changes in a and h is due mostly to a change in the time that the limit-cycle trajectories spend moving along the slow manifold and not to a change in the slow time scale.
Appendix B
Effects of Changes of the ML-Hopf Model Parameter on the Model's Dynamic Properties
Dynamic mechanisms underlying the dependence of the period and duty cycle upon changes in GCa in the ML-Hopf model.
With all other parameters fixed, the increase of values of GCa causes the period to decrease first and then to increase, whereas the duty cycle is instead an increasing function of GCa (Fig. A3A1).
The increase in GCa causes the v-nullcline to rise (Fig. A3A2), but the lower knee rises less than the upper knee. The overall effect is an increase in the portions of the left and especially, right branches that are available for the limit-cycle trajectory to move along, which leads to a monotonic increase in duty cycle and a nonmonotonic increase in period. These changes are accompanied by changes in the speed at which the limit-cycle trajectories evolve, in particular, along the left (points C to D) and right (points A to B) branches of the v-nullclines (Fig. A3A3). This is best illustrated in (Fig. A3A4), which shows a magnified version of the v-speed diagrams around the zero speed level. Although changes along the top and bottom trajectory branches appear larger than along the left and right branches, the trajectories are so fast that this acceleration does not significantly affect the overall period or duty cycle compared with the changes observed along the left and right branches.
As the v-nullcline rises, the fixed point moves from the lower knee (Fig. A3A2) to the upper knee (Fig. A3A2). For the intermediate value of GCa (Fig. A3A2), there are fixed points in the vicinities of both the lower and upper knee, but they are located farther away from the minimum than for both solid curves. As we mentioned earlier, the distance between these fixed points and the minima and maxima of the v-nullcline control, to some extent, the speed of the trajectory along the lower and upper branches, respectively. The increase in the duty cycle (Fig. A3A1) is the result of the decrease in the relative speed of the limit-cycle trajectories along the right branch compared with the left branch as GCa increases (Fig. A3, A3 and A4), due to the generation of a fixed point on the dashed upper knee and its subsequent motion to the right, near the maximum, on the solid upper knee (Fig. A3A2).
The initial decrease in the period as GCa increases (Fig. A3A1) is due to the location of the fixed point on the lower knee, which is closer to the minimum of the dotted v-nullcline than to the dashed one. This causes a significant decrease in the speed of the dotted limit-cycle trajectory in a vicinity of the lower knee compared with the dashed limit-cycle trajectory (points D in Fig. A3, A3 and A4). The increase in the period as GCa increases further is mainly due to the increase in the duty cycle described above. The speed of the solid and dashed limit-cycle trajectories is roughly the same along the left branches (silent phases). More precisely, the speed of the solid limit-cycle trajectory is only slightly higher than the dashed one in the vicinity of the lower knee, due to the closer location of the fixed point relative to the minimum of the v-nullclines, which compensates for the longer portion of the v-nullcline along which the solid limit-cycle trajectory has to move.
A biophysical explanation of these observations is that an initial increase in Ca2+ current leads to a prolonged, depolarized phase (thus an increase duty cycle) but also, a faster depolarization from the hyperpolarized phase (thus reducing period). A further increase in GCa leads to a more prolonged, depolarized phase (longer time spent along the right branch of the phase plane) and thus further increases duty cycle, which cannot be compensated for by the further increase in speed. Thus ensues a longer period and larger duty cycle.
Dynamic mechanisms underlying the dependence of the period and duty cycle upon changes in GK in the ML-Hopf model.
With all other parameters fixed, the increase of values of GK causes the period to decrease first and then to increase, whereas the duty cycle is a decreasing function of GK (Fig. A3B1). The increase in GK in Fig. A3B2 has opposite effects on the phase-plane diagram than the increase in GCa described above. The mechanism of decrease of the duty cycle as GK increases (Fig. A3B1) is analogous to the mechanism of duty-cycle decrease as GCa decreases (Fig. A3A1). Similarly, the mechanism of decrease of the period as GK increases (Fig. A3B1) is analogous to the mechanism of decrease of the period as GCa decreases (Fig. A3A1). The v-nullcline shifts down (Fig. A3B2), and the fixed point moves from a vicinity of the upper knee to a vicinity of the lower knee with additional fixed points near the upper and lower knees. Similar changes occur in the speed along the trajectory, with the most significant ones being those along the (slower) left and right branches of the limit cycle, when GK increases (Fig. A3, B3 and B4), as when GCa decreases (Fig. A3, A3 and A4).
A similar biophysical explanation as for GCa changes can be made for inverse changes in GK: the increase in GK monotonically decreases the duration of the depolarized phase of the oscillation and gradually (but nonmonotonically) increases the hyperpolarized phase, with the resulting decrease in duty cycle. The decrease in period is initially dominated by the reduction in the duration of the depolarized phase, whereas the subsequent increase in period is dominated by an increased duration of the hyperpolarized phase as GK increases.
These results and the results of the previous section show that increases in GCa and GK have opposite effects on the changes in the v-nullclines and the speed of the limit-cycle trajectories on both branches of the v-nullcline, which provides a partial qualitative explanation of the existence of period and duty-cycle level sets in the GCa–GK parameter space and the monotonicity properties (positive slope) of the period and duty-cycle level sets in Fig. 7: both conductances need to increase to maintain these features constant, since they have opposing effects. However, important questions remain unanswered, which we address in the main body of this paper (see ML Model in results).
Appendix C
The ML-SNIC Model
Effects of changes of ML-SNIC model parameters on the dynamical properties of the system.
The main qualitative differences of the ML-SNIC model compared with the ML-Hopf model are the shapes of the w-nullclines and the way the systems behave in close vicinities of the lower knee of the corresponding v-nullclines.
In contrast with the ML-Hopf model, for the ML-SNIC model (Fig. A4B), the w-nullcline is not transversal but rather, almost horizontal in the vicinity of the lower knee, which is characteristic of type I excitability (Rinzel and Ermentrout 1998). There are also differences in the relative speeds along the left and right branches of the v-nullclines (Fig. A4C) that affect the shape of the oscillation, primarily during the silent (point C–D) phase but also during the active (points A–B) phase of the oscillation.
Fig. A4.
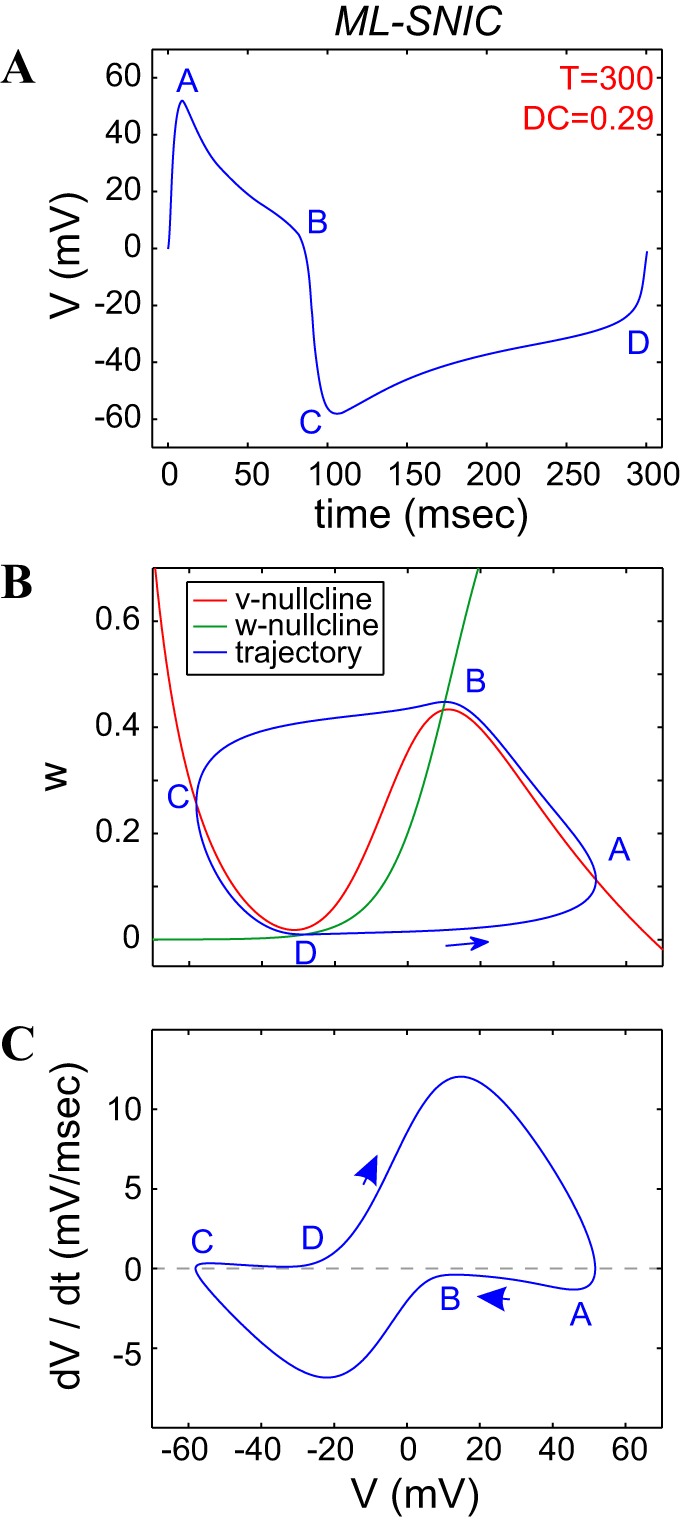
The dynamics of the ML-SNIC model. The parameters of the ML-SNIC model include the following: GCa = 4, GK = 6, Iapp = 42.5. The value of Iapp wa s tuned so that T = 300 ms. A: voltage trace (time course) during 1 oscillation period. B: phase plane. C: v-speed diagram. ϕ = 0.01 = 0.01. GCa and GK are in millisiemens/square centimeter and Iapp in microamperes/square centimeter.
Period and duty-cycle level sets for the ML-SNIC model.
Figure A5 shows the period (Fig. A5A) and duty-cycle (Fig. A5B) heat graphs for the ML-SNIC model, highlighting one example of a period level set (T = 320 ms in Fig. A5A) and one example of a duty-cycle level set (DC = 0.4 in Fig. A5B). The period level sets are weakly nonmonotonic, except for a small range of parameter values on the vertex of the admissible region, where the nonmonotonicity is more marked. The duty-cycle level sets are monotonic.
Fig. A5.
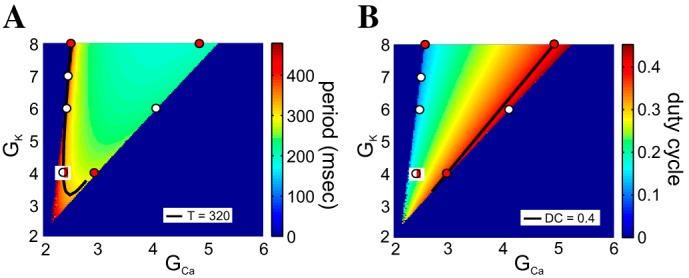
Period and duty-cycle level sets in the GCa–GK parameter space for the ML-SNIC model. A: period heat graphs. B: duty-cycle heat graphs. The colored bars code for the values of the corresponding attribute. The solid black curves indicate the period level set for T = 320 ms (A) and the duty-cycle level set for DC = 0.4 (B). White and red dots highlight points along the 2 level sets in A and B that are analyzed (see Figs. A6 and A7). Iapp = 52 μA/cm2 and ϕ = 0.01. GCa and GK are in millisiemens/square centimeter.
As for the ML-Hopf model, we first describe the mechanisms that govern the dependence of the period and duty cycle upon changes in a single maximal conductance, and we apply this knowledge in the subsequent section to understand the compensation mechanisms that govern the maintenance of constant values for the two attributes along their level sets.
Dynamic mechanisms underlying the dependence of the period and duty cycle upon changes in GCa in the ML-SNIC model.
As with the ML-Hopf model, with all parameters fixed, increasing values of GCa cause the period to decrease (Fig. A5A) and then to increase again and the duty cycle only to increase (Fig. A5B). The nonmonotonic nature of the period level sets is clearly shown by the level set highlighted. Unlike the ML-Hopf model, however, increases in GK (Fig. A5A) cause a monotonic decrease in the period. Additionally, here, we see only a short lower branch for T = 320 ms (Fig. A5).
ML-SNIC shows an asymmetric set of bifurcations, thanks to the different behavior of the system near the lower-knee fixed point compared with the behavior around the fixed point near the upper knee of the phase plane (Fig. A6A2). Near the lower knee, the w-nullcline and the v-nullcline run almost parallel to each other, different from the ML-Hopf system. The fixed point around the upper knee behaves similar to the MK-Hopf system, with the w-nullcline clearly crossing the v-nullcline.
As GCa increases, the v-nullcline rises (Fig. A6A2), primarily due to a rise in the upper knee, and thus the portions of the left and right branches that are available for the limit-cycle trajectory to move along both increase. However, the different underlying bifurcation mechanisms cause these effects to have somewhat different consequences on the period than for the ML-Hopf model. This is so, because the fixed point corresponding to the solid v-nullcline is closer to the SNIC bifurcation point than the fixed point corresponding to the dashed v-nullcline. The dashed limit-cycle trajectory moves slower in a vicinity of the upper knee than the solid limit-cycle trajectory (Fig. A6A3), therefore increasing the duty cycle. However, it moves faster than the solid limit-cycle trajectory along the left branch as a consequence of the v- and w-nullclines being farther apart from each other, therefore keeping the period short.
Fig. A6.
ML-SNIC model: dependence of the period and duty cycle on the values of GCa and GK. A: effect of changes in the values of GCa for fixed values of GK. B: effect of changes in the values of GK for fixed values of GCa. A1 and B1: superimposed voltage trace (time course) during 1 oscillation period. A2 and B2: superimposed phase-plane diagrams. A3 and B3: superimposed v-speed diagrams. Iapp = 52 μA/cm2 and ϕ = 0.01. GCa and GK are in millisiemens/square centimeter.
Dynamic mechanisms underlying the dependence of the period and duty cycle upon changes in GK in the ML-SNIC model.
With all parameters fixed, the increase of values of GK causes the period to increase (Figs. A5A and A6B1; except on the small vertex region) and the duty cycle to decrease (Figs. A5B and A6B1).
The effects of changes in the v-nullcline as the result of increasing values of GK in the ML-SNIC model (Fig. A6B2) are opposite of the effects of increasing values of GCa, described above. The v-nullcline shifts down; the effect is more pronounced for the upper knee than for the lower knee; the portions of the left and right branches available for the limit-cycle trajectory to move along decreases, reducing the duration of the active phase (points A to B); and the fixed point moves from the vicinity of the upper knee to the vicinity of the lower knee (Fig. A6B2). However, there is a major difference between the two ML models: whereas spiking is initiated via a SNIC bifurcation as GCa increases, it is terminated via a Hopf bifurcation as GK increases (not shown).
The increase in the period as GK increases is caused by a decrease in the speed of the dashed limit-cycle trajectory, due to the presence of a fixed point near the lower knee (Fig. A6B3). This slows down the motion of the dashed limit-cycle trajectory compared with the solid one. The decrease in the duty cycle is caused by the decrease of the duration of the active phase (Fig. A6, B1 and B2), combined with the displacement of the fixed point from the vicinity of the upper knee for low GK values (Fig. A6B2) to the middle branch for higher values of GK (Fig. A6B2), which slows the hyperpolarized phase.
From a biophysical point of view, a stronger K+ current is likely to hyperpolarize the cell faster (reducing the active phase) and for longer (increasing the period) than a weaker one, thus simultaneously decreasing the duty cycle, as observed here.
Compensation mechanisms for the ML-SNIC model.
Figure A7 shows the superimposed voltage traces, phase-plane diagrams, and v-speed diagrams for pairs of points in the GCa–GK parameter space along the period level set (upper branch in Fig. A5A) and along the duty-cycle level set (Fig. A5B). Note that we selected level sets here for the same value of the period (T = 320 ms) and of duty cycle (DC = 0.4) as for the ML-Hopf model described in the main text.
Fig. A7.
ML-SNIC model oscillatory activity dynamics along period and duty-cycle level sets. A: period level set (upper branch of Fig. A5A). B: duty-cycle level set (Fig. A5B). A1 and B1: superimposed voltage traces. A2 and B2: superimposed phase planes. A3 and A4 and B3 and B4: superimposed v-speed graphs. Iapp = 52 μA/cm2 and ϕ = 0.01. GCa and GK are in millisiemens/square centimeter.
The compensation mechanisms leading to the generation of period level sets (Fig. A7A) with different values of both GCa and GK derive from the mechanisms explained in the context of Fig. A6. The increase of values of GCa raises the v-nullcline, whereas the increase of values of GK shifts it down, but here, they do so to a different degree, resulting in v-nullclines and limit-cycle trajectories that are significantly higher for the solid than the dashed trace for the traces along the period level set (Fig. A7A2) and somewhat higher and much broader for the dashed than the solid curve along the duty-cycle level set (Fig. A7B2). In Fig. A7A2, the dashed lower knee is slightly below the solid lower knee, whereas the distance between the higher solid and the lower dashed upper knees is much larger. As a consequence, the portion of the left and right branches that are available for the limit-cycle trajectories to move along is larger for the solid v-nullcline than for the dashed one. However, the solid limit-cycle trajectory moves slower than the dashed limit-cycle trajectory along the right (active) branch (Fig. A7, A3 and A4), because there is a fixed point closer to the maximum of the solid v-nullcline than to that of the dashed one, thus increasing the duty cycle of the solid trace. In contrast, the solid limit-cycle trajectory spends less time moving along the left branch than the dashed limit-cycle trajectory, because the w-nullcline is closer to the dashed lower knee than to the solid one, thus making the duty cycle larger for the solid curve but maintaining the periods the same.
In Fig. A7B2, both the solid and dashed lower and upper knees are almost superimposed. Here, the duty cycle is maintained, because the solid limit-cycle trajectory moves slower than the dashed limit-cycle trajectory on both branches, thus increasing the period of the solid curve without changing the duty cycle. This is due to the fact that the dashed v-nullcline opens up with respect to the solid one, and therefore, both dashed branches are farther away from the w-nullcline than the solid branches, increasing the speed of the limit-cycle trajectory along both branches (Fig. A7B3).
Globally, one significant difference between the ML-Hopf and ML-SNIC systems is the much shorter lower branches of the period level sets in the ML-SNIC system. However, the ML-SNIC system (Fig. A8) also shows clear similarities with the ML-Hopf system (Fig. 10). The limit-cycle trajectories of ML-SNIC along the duty-cycle level set are all contained within the next-largest limit cycle (Figs. A7B2 and A8C2), as are the limit cycles along the lower branch of the (shorter) period level set that runs close and parallel to the duty-cycle level set (Fig. A8B2). By contrast, the limit cycles along the upper branches of the period level set, which do not run parallel to the duty-cycle level sets, expand as GCa and GK decrease (Fig. A8A1), but they do so in an asymmetric manner that leads to the limit cycles crossing over each other (Figs. A7A2 and A8A2). The limit cycles of the short lower branch of the period level set, as well as those of the nearly parallel duty-cycle level set, are all almost completely contained within the next-largest one. Only near the fixed point (on the upper knee of the v-nullcline) do the limit cycles of the duty-cycle level sets appear to cross, but that is limited to a very narrow region along the trajectory (Fig. A8C2). Finally, in contrast to what we observe in the ML-Hopf model (Fig. 10A3), in the ML-SNIC model, the v-speed graphs along the upper branch of the period level sets are observed to cross over each other multiple times (Fig. A8A3), whereas those along the duty-cycle level sets and those along the lower branch of the period level sets behave similar to the ML-Hopf model in that they are fully contained within the next-largest one (Fig. A8, B3 and C3).
Fig. A8.
Behavior of the ML-SNIC model along the different portions of the period and duty-cycle level sets. A1, B1, and C1: superimposed voltage traces. A2, B2, and C2: superimposed phase planes. A3, B3, and C3: superimposed v-speed graphs along the upper branch of the period level set (T = 320 ms; A), lower branch of the period level set (T = 320 ms; B), and duty-cycle level set (DC = 0.4; C). D: level sets from which A–C are taken. Traces are color coded, and the traces with the highest voltage maxima and minima values have the largest GCa and GK values. GCa and GK are in millisiemens/square centimeter.
REFERENCES
- Bucher D, Prinz AA, Marder E. Animal-to-animal variability in motor pattern production in adults and during growth. J Neurosci : 1611–1619, 2005. [DOI] [PMC free article] [PubMed] [Google Scholar]
- Burdakov D. Gain control by concerted changes in I(A) and I(H) conductances. Neural Comput : 991–995, 2005. [DOI] [PMC free article] [PubMed] [Google Scholar]
- Burden RL, Faires JD. Numerical Analysis. Boston: PWS, 1980. [Google Scholar]
- Clay JR, Shrier A. On the role of subthreshold dynamics in neuronal signaling. J Theor Biol : 207–216, 1999. [DOI] [PubMed] [Google Scholar]
- Deng B, Wang J, Wei X, Tsang KM, Chan WL. Vibrational resonance in neuron populations. Chaos : 013113, 2010. [DOI] [PubMed] [Google Scholar]
- Doloc-Mihu A, Calabrese RL. Identifying crucial parameter correlations maintaining bursting activity. PLoS Comput Biol : e1003678, 2014. [DOI] [PMC free article] [PubMed] [Google Scholar]
- Ermentrout GB, Terman D. Mathematical Foundations of Neuroscience. New York: Springer, 2010. [Google Scholar]
- Etheredge JA, Murchison D, Abbott LC, Griffith WH. Functional compensation by other voltage-gated Ca2+ channels in mouse basal forebrain neurons with Ca(V)2.1 mutations. Brain Res : 105–119, 2007. [DOI] [PubMed] [Google Scholar]
- Fitzhugh R. Thresholds and plateaus in the Hodgkin-Huxley nerve equations. J Gen Physiol : 867–896, 1960. [DOI] [PMC free article] [PubMed] [Google Scholar]
- Goaillard JM, Taylor AL, Schulz DJ, Marder E. Functional consequences of animal-to-animal variation in circuit parameters. Nat Neurosci : 1424–1430, 2009. [DOI] [PMC free article] [PubMed] [Google Scholar]
- Goldman MS, Golowasch J, Marder E, Abbott LF. Global structure, robustness, and modulation of neuronal models. J Neurosci : 5229–5238, 2001. [DOI] [PMC free article] [PubMed] [Google Scholar]
- Golowasch J. Ionic current variability and functional stability in the nervous system. Bioscience : 570–580, 2014. [DOI] [PMC free article] [PubMed] [Google Scholar]
- Golowasch J. Stability and homeostasis in small network central pattern generators. In: Encyclopedia of Computational Neuroscience, edited by Jaeger D and Jung R. New York: Springer Verlag, 2015, p. 2858–2864. [Google Scholar]
- Grashow R, Brookings T, Marder E. Compensation for variable intrinsic neuronal excitability by circuit-synaptic interactions. J Neurosci : 9145–9156, 2010. [DOI] [PMC free article] [PubMed] [Google Scholar]
- Haedo RJ, Golowasch J. Ionic mechanism underlying recovery of rhythmic activity in adult isolated neurons. J Neurophysiol : 1860–1876, 2006. [DOI] [PMC free article] [PubMed] [Google Scholar]
- Hudson AE, Prinz AA. Conductance ratios and cellular identity. PLoS Comput Biol : e1000838, 2010. [DOI] [PMC free article] [PubMed] [Google Scholar]
- Izhikevich E. Dynamical Systems in Neuroscience: The Geometry of Excitability and Bursting. Cambridge, MA: MIT Press, 2006. [Google Scholar]
- Khorkova O, Golowasch J. Neuromodulators, not activity, control coordinated expression of ionic currents. J Neurosci : 8709–8718, 2007. [DOI] [PMC free article] [PubMed] [Google Scholar]
- Lamb DG, Calabrese RL. Correlated conductance parameters in leech heart motor neurons contribute to motor pattern formation. PLoS One : e79267, 2013. [DOI] [PMC free article] [PubMed] [Google Scholar]
- Leao RM, Li S, Doiron B, Tzounopoulos T. Diverse levels of an inwardly rectifying potassium conductance generate heterogeneous neuronal behavior in a population of dorsal cochlear nucleus pyramidal neurons. J Neurophysiol : 3008–3019, 2012. [DOI] [PMC free article] [PubMed] [Google Scholar]
- Lin CC, Segel LA. Mathematics Applied to Deterministic Problems in the Natural Sciences. Philadelphia: Society for Industrial and Applied Mathematics, 1988. [Google Scholar]
- Liss B, Franz O, Sewing S, Bruns R, Neuhoff H, Roeper J. Tuning pacemaker frequency of individual dopaminergic neurons by Kv4.3L and KChip31 transcription. EMBO J : 5715–5724, 2001. [DOI] [PMC free article] [PubMed] [Google Scholar]
- MacLean JN, Zhang Y, Goeritz ML, Casey R, Oliva R, Guckenheimer J, Harris-Warrick RM. Activity-independent coregulation of IA and Ih in rhythmically active neurons. J Neurophysiol : 3601–3617, 2005. [DOI] [PubMed] [Google Scholar]
- McAnelly ML, Zakon HH. Coregulation of voltage-dependent kinetics of Na(+) and K(+) currents in electric organ. J Neurosci : 3408–3414, 2000. [DOI] [PMC free article] [PubMed] [Google Scholar]
- Morris C, Lecar H. Voltage oscillations in the barnacle giant muscle fiber. Biophys J : 193–213, 1981. [DOI] [PMC free article] [PubMed] [Google Scholar]
- Nagumo JS, Arimoto S, Yoshizawa S. An active pulse transmission line simulating nerve axon. Proc IRE : 2061–2070, 1962. [Google Scholar]
- Nusser Z. Variability in the subcellular distribution of ion channels increases neuronal diversity. Trends Neurosci : 267–274, 2009. [DOI] [PubMed] [Google Scholar]
- O'Leary T, Williams AH, Caplan JS, Marder E. Correlations in ion channel expression emerge from homeostatic tuning rules. Proc Natl Acad Sci USA : E2645–E2654, 2013. [DOI] [PMC free article] [PubMed] [Google Scholar]
- O'Leary T, Williams AH, Franci A, Marder E. Cell types, network homeostasis, and pathological compensation from a biologically plausible ion channel expression model. Neuron : 809–821, 2014. [DOI] [PMC free article] [PubMed] [Google Scholar]
- Olypher AV, Calabrese RL. Using constraints on neuronal activity to reveal compensatory changes in neuronal parameters. J Neurophysiol : 3749–3758, 2007. [DOI] [PubMed] [Google Scholar]
- Olypher AV, Prinz AA. Geometry and dynamics of activity-dependent homeostatic regulation in neurons. J Comput Neurosci : 361–374, 2010. [DOI] [PMC free article] [PubMed] [Google Scholar]
- Ransdell JL, Nair SS, Schulz DJ. Rapid homeostatic plasticity of intrinsic excitability in a central pattern generator network stabilizes functional neural network output. J Neurosci : 9649–9658, 2012. [DOI] [PMC free article] [PubMed] [Google Scholar]
- Richardson MJ, Brunel N, Hakim V. From subthreshold to firing-rate resonance. J Neurophysiol : 2538–2554, 2003. [DOI] [PubMed] [Google Scholar]
- Rinzel J. Excitation dynamics: insights from simplified membrane models. Fed Proc : 2944–2946, 1985. [PubMed] [Google Scholar]
- Rinzel J, Ermentrout GB. Analysis of neural excitability and oscillations. In: Methods in Neural Modeling, edited by Koch C and Segev I. Cambridge, MA: MIT Press, 1998, p. 251–292. [Google Scholar]
- Rotstein HG, Coombes S, Gheorghe AM. Canard-like explosion of limit cycles in two-dimensional piecewise-linear models of FitzHugh-Nagumo type SIAM. J Appl Dyn Syst : 135–180, 2012. [Google Scholar]
- Rotstein HG, Nadim F. Frequency preference in two-dimensional neural models: a linear analysis of the interaction between resonant and amplifying currents. J Comput Neurosci : 9–28, 2014. [DOI] [PMC free article] [PubMed] [Google Scholar]
- Rotstein HG, Opperman T, White JA, Kopell N. A reduced model for medial entorhinal cortex stellate cells: subthreshold oscillations, spiking and synchronization. J Comput Neurosci : 271–292, 2006. [DOI] [PubMed] [Google Scholar]
- Schulz DJ, Goaillard JM, Marder E. Variable channel expression in identified single and electrically coupled neurons in different animals. Nat Neurosci : 356–362, 2006. [DOI] [PubMed] [Google Scholar]
- Schulz DJ, Goaillard JM, Marder EE. Quantitative expression profiling of identified neurons reveals cell-specific constraints on highly variable levels of gene expression. Proc Natl Acad Sci USA : 13187–13191, 2007. [DOI] [PMC free article] [PubMed] [Google Scholar]
- Strogatz SH. Nonlinear Dynamics and Chaos. Boston: Addison Wesley, 1994. [Google Scholar]
- Swensen AM, Bean BP. Robustness of burst firing in dissociated Purkinje neurons with acute or long-term reductions in sodium conductance. J Neurosci : 3509–3520, 2005. [DOI] [PMC free article] [PubMed] [Google Scholar]
- Temporal S, Desai M, Khorkova O, Varghese G, Dai A, Schulz DJ, Golowasch J. Neuromodulation independently determines correlated channel expression and conductance levels in motor neurons of the stomatogastric ganglion. J Neurophysiol : 718–727, 2012. [DOI] [PMC free article] [PubMed] [Google Scholar]
- Turrigiano G, Abbott LF, Marder E. Activity-dependent changes in the intrinsic properties of cultured neurons. Science : 974–977, 1994. [DOI] [PubMed] [Google Scholar]
- Turrigiano G, LeMasson G, Marder E. Selective regulation of current densities underlies spontaneous changes in the activity of cultured neurons. J Neurosci : 3640–3652, 1995. [DOI] [PMC free article] [PubMed] [Google Scholar]
- Unal CT, Golowasch JP, Zaborszky L. Adult mouse basal forebrain harbors two distinct cholinergic populations defined by their electrophysiology. Front Behav Neurosci : 21, 2012. [DOI] [PMC free article] [PubMed] [Google Scholar]
- Wu YC, Fettiplace R. A developmental model for generating frequency maps in the reptilian and avian cochleas. Biophys J : 2557–2570, 1996. [DOI] [PMC free article] [PubMed] [Google Scholar]
- Zhang Y, Golowasch J. Recovery of rhythmic activity in a central pattern generator: analysis of the role of neuromodulator and activity-dependent mechanisms. J Comput Neurosci : 685–699, 2011. [DOI] [PMC free article] [PubMed] [Google Scholar]
- Zhao S, Golowasch J. Ionic current correlations underlie the global tuning of large numbers of neuronal activity attributes. J Neurosci : 13380–13388, 2012. [DOI] [PMC free article] [PubMed] [Google Scholar]


