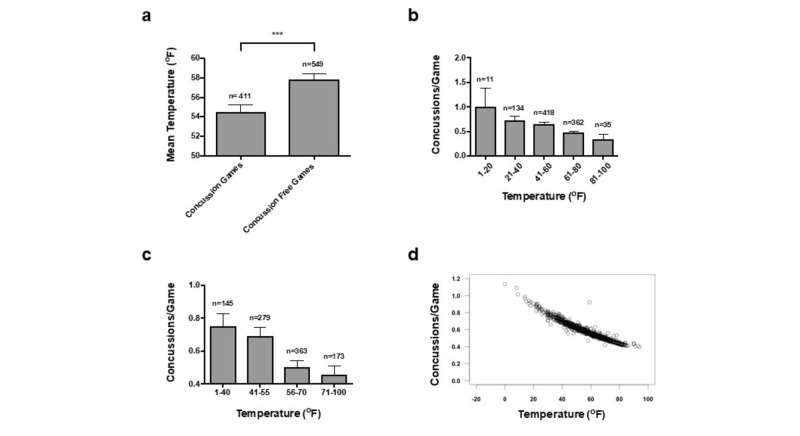
Figure 1. Concussion Incidence Increases as Game Temperature Decreases.
(a) Bar graph shows mean temperature (SEM) for concussion and concussion-free games (p <0.001, ***). (b-c) Bar graphs show mean concussion incidence for games played at different temperature increments. Graph b divides temperature into 20oF increments, and graph c divides temperature into 15oF and 30oF increments. (d) Poisson regression computes the predicted concussion incidence of any given game played at a certain temperature. The environmental factors of temperature, dew point, humidity, and barometric pressure were utilized in the model.

