Abstract
Purpose:
To demonstrate a circular EPI (CEPI) sequence as well as a generalized EPI reconstruction for fast functional MRI (fMRI) with parallel imaging acceleration.
Methods:
The CEPI acquisition was constructed using variable readout lengths and maximum ramp sampling as well as blipped-CAIPI z-gradient encoding for simultaneous multi-slice (SMS) and three-dimensional (3D) volumetric imaging. A signal equation model with constant and linear phase terms was utilized to iteratively reconstruct images with low ghosting. Simulation, phantom, and human imaging experiments including audio/visual fMRI were performed at 3T using a 52-channel coil.
Results:
Application of CEPI gradients with duration of 27 ms covering a 22 cm FOV at a 64X64 pixel resolution in SMS and 3D acquisitions resulted in images with comparable quality to those of standard Cartesian EPI. With parallel imaging techniques robust detection of Blood Oxygenation Level Dependent (BOLD) fMRI activation with temporal sampling down to 275 ms was possible. The high temporal resolution enabled higher activation statistics at a penalty in increased noise and residual aliasing. The un-accelerated 3D acquisition showed large temporal instability compared to a standard 2D acquisition.
Conclusions:
Non-uniform sampling and generalized image reconstructions can be applied to EPI acquisitions including those with blipped-CAIPI z gradients. The same gradients can be utilized for either SMS or 3D acquisitions providing identical coverage.
Keywords: Simultaneous Multi-Slice excitation, Echo Planar Imaging, BOLD fMRI
Introduction
Echo Planar Imaging (EPI) methods are important for Blood Oxygen Level Dependent (BOLD) functional MRI (fMRI) applications because of increased temporal and spatial resolution (1,2). Improved spatial resolution is useful for better identification of activation as well as reduced signal dropout in regions with large magnetic susceptibility induced distortion and signal loss (3,4). Increased temporal resolution has received particular interest in fMRI for enhanced statistical power, better resolution of the Hemodynamic Response Function (HRF), and better identification of nuisance physiological components (5–9). A common method for increasing speed in MRI is to acquire reduced data sets with receiver coil arrays using parallel imaging (10–12). A drawback of parallel imaging is a reduction in image signal to noise ratio (SNR) equal to , where R is the k-space reduction factor, as well as residual aliasing and “g-factor” noise enhancement. In the case of BOLD fMRI however temporal SNR (tSNR) is typically dominated by physiological variations rather than the SNR of each individual image making parallel imaging an attractive option (13).
One approach for parallel imaging in fMRI is with volumetric EPI methods using either Simultaneous Multi-Slice (SMS) or three-dimensional (3D) implementations (14–16). The advantage of parallel SMS and 3D EPI is that excitation and encoding steps can be omitted yielding accelerations on the order of the number of simultaneously excited slices NSMS or similarly the reduction factor R obtained from skipping z phase encoding planes. Furthermore SMS imaging does not incur the typical loss in SNR because readout length is unchanged compared to a 2D readout ignoring relaxation. If one views SMS imaging as an undersampled 3D acquisition then like 3D the reduced SNR from fewer phase encoding steps is offset by the multiband or slab excitation (17). The SMS and 3D parallel imaging efficiency can be further optimized by introducing alternating z-gradient phase encoding “blips” simultaneous to the EPI gradients (18). The alternating blips provide gradient encoding along z for a more efficient usage of the volumetric receiver arrays and spread aliasing across the Field of View (FOV) with Controlled Aliasing in Parallel Imaging (CAIPI) for lower g-factors (19). These volumetric SMS or 3D EPI techniques with alternating z blips are commonly referred to as “blipped-CAIPI” EPI.
This work generalizes the blipped-CAIPI EPI approach for any SMS or 3D EPI trajectory including a circular EPI (CEPI) trajectory as an example (20,21). The CEPI trajectory is a non-Cartesian variant of EPI and was generated using maximum ramp-sampled readout gradients of varying area to obtain a circular k-space for reduced readout length. A generalized reconstruction framework is also introduced using a signal equation model and sensitivity encoding (SENSE) (22,23). The signal model is solved iteratively with gridding using the Non-Uniform Fast Fourier Transformation (NUFFT) (24,25). The framework can reconstruct arbitrary blipped-CAIPI volumetric EPI trajectories allowing direct comparison and interchangeability between SMS and 3D acquisitions (26,27). The reconstruction also compensates for ghosting in a straightforward manner using constant and linear phase terms in the signal equation (28,29). Simulations as well as phantom and human brain imaging experiments including fMRI at 3T are presented.
Theory
A CEPI k-space trajectory was generated from a standard EPI trajectory by having the readout k-space maximum be a function of the phase encoding step m (i.e. 1 through 64):
| [1] |
Here, FOV is the in-plane field of view of an image with pixels where the readout and phase encoding directions are defined as x and y respectively.
The CEPI data no longer reside on a Cartesian grid and reconstruction is not a straightforward Fourier Transform. Reconstruction can be accomplished in several ways including using gridding or zero-filling the missing k-space points. We propose a generalized reconstruction adopted from spiral imaging using the MRI signal equation and a Non-Uniform Fast Fourier Transform (NUFFT) for increased efficiency:
| [2] |
Here, s (t) is the raw data signal, ρ(r) is the spin density, R(r) is the coil sensitivity, and k(t) is the k-space trajectory. Eqn. [2] can be solved iteratively using a conjugate gradient algorithm that can include regularization or off-resonance correction if needed (30). The generalized reconstruction also allows for a straightforward extension to parallel imaging with SENSE and to blipped-CAIPI SMS and 3D acquisitions.
The CEPI reconstruction requires compensation for ghosting due to time delays and phase errors between the alternating k-space lines. The time delays and phase errors are typically modeled with constant and linear terms estimated from a calibration scan where data are acquired without the y phase encoding. These can be incorporated into the signal equation with the following modification:
| [3] |
Here, Gx(t) is the readout gradient and γ is the gyromagnetic ratio. The linear term is modeled as a k-space shift along kx or equivalently a time delay τ on Gx(t). The constant term is defined by θx and is set to change sign as the polarity of Gx(t) changes during the readout.
Methods
SEQUENCE DESIGN
The CEPI gradients were designed using a continuous series of alternating trapezoidal readout gradients along x and phase encoding blips along y. The area of each readout trapezoid was derived from Eqn. 1 for each y phase encoding step. The ramps of the trapezoids were set by a slew rate of 130 T/m/s and gradient maximum of 30 mT/m. The sampling dwell time was 2.5 μs such that for a single-shot acquisition the readout gradient waveform was predominantly triangular and almost all sampling occurred on the ramps. For comparison EPI gradients were also constructed for uniform Cartesian sampling. A maximum slew rate of 130 T/m/s and gradient peak of 20 mT/m were used. The gradients were designed such that the diameter of the CEPI trajectory matched the length of the EPI readout k-space dimension with the same FOV.
Blipped-CAIPI z blips were also added for SMS and 3D applications. Following Ref. (17) the sampling for SMS and 3D acquisitions can be viewed similarly and the same set of readout gradients can be used for either. The area of the z blips Δkz was determined by the following:
| [4] |
Here, Rz is the reduction factor along z. In the case of an SMS acquisition d is the separation between each of the NSMS simultaneously excited slices. For a 3D acquisition N is the total number of slices (phase encoding steps) and Δz is the slice thickness. In-plane acceleration is also possible by skipping y phase encoding steps that can be parameterized by a reduction factor Ry. In blipped-CAIPI EPI one typically adds z blips to a fully sampled single-slice EPI acquisition making the number of z-blip steps equal to Ry. For SMS applications the total acceleration factor is then R = RyRz = NSMS and the total number of excitations needed to cover an entire volume with an NSMS multiband RF pulse is N/R. Accordingly, for a 3D acquisition the number of z phase encoding steps that are actually acquired with a slab select RF pulse is equal to N/R.
Figure 1 (a) shows an example of blipped-CAIPI readout gradients for EPI and CEPI for an acquisition with a 22 cm FOV and 64X64 resolution. The length of the CEPI and EPI readout gradients are 27.2 and 45.8 ms, respectively. Figure 1 (b) shows the kx-ky k-space coverage of the EPI and CEPI gradients. Note that the maximum k-space extent was matched between the two. The z-gradient blips in (a) produced two planes in kz for SMS and 3D imaging with a total acceleration of R = 4 (Ry = 2 and Rz = 2) and could be used for either an NSMS = 4 acquisition or a 3D acquisition that uses every fourth z phase encode. Figure 1 (c) shows a diagram of the SMS k-space in red that is utilized for each RF excitation. A 3D acquisition uses slab selection and phase encoding to obtain the entire k-space shown in red and blue. Similarly Fig. 1 (d) shows the k-space for R = 8 (Ry = 4 and Rz = 2) for an NSMS = 8 acquisition or a 3D acquisition that uses every eighth phase encode. The gradients would be identical to (a) except the z blips would have four steps. In both (c) and (d) the spatial coverage is N = 32 total slices with thickness Δz = 3 mm. Figure 1 (e) shows a diagram depicting slab selection for 3D in blue and an NSMS = 4 multiband excitation in red.
FIG. 1.
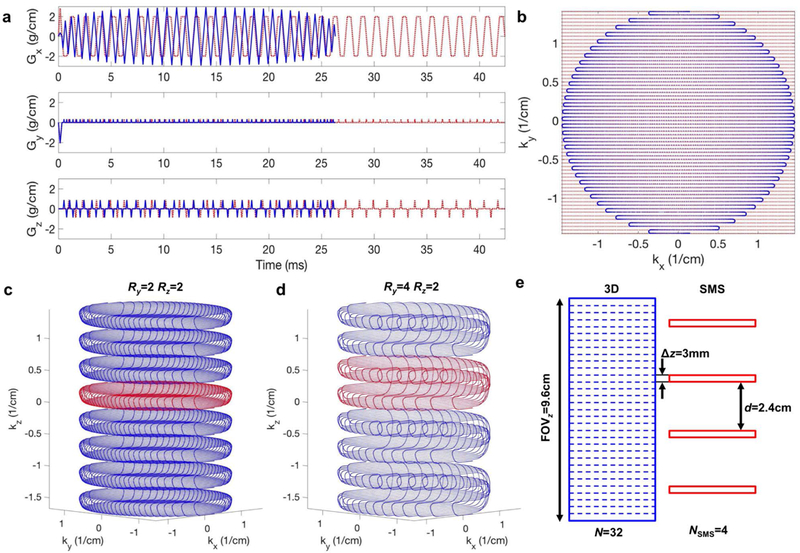
(a) Blipped-CAIPI readout gradients for EPI (red) and CEPI (blue) for a 22 cm FOV and 64X64 resolution acquisition. These gradients provide an acceleration of R = 4 (Ry = 2 and Rz = 2) (b) kx-ky k-space for the EPI (red) and CEPI (blue) gradients. (c) Diagram of the k-space for SMS (red) and 3D (red and blue) acquisitions. (d) Diagram of the SMS and 3D k-space for R = 8 (Ry = 4 and Rz = 2). The spatial coverage is N = 32 total slices with thickness Δz = 3 mm. (e) Diagram depicting slab selection for 3D (blue) and NSMS = 4 (red).
All gradient waveforms were generated in Matlab (The Mathworks, Natick, MA) and read into the pulse sequence before scanning. Data were transferred and reconstructed offline in Matlab using the Michigan Image Reconstruction Toolbox (MIRT) (https://web.eecs.umich.edu/~fessler/code/). The entire CEPI gradient waveform was used for acquisition including data that were acquired during the y and z blips. In the case of the EPI scans only the data that were acquired along the flat portion of the readout gradients were used for reconstruction. All images were reconstructed using the same generalized reconstruction without the application of apodization filters. For ghost-correction reference scans consisting of four echoes without y or z blips were also collected. The constant phase and delay terms were determined from the reference scans after fitting the even and odd echoes (31). All imaging was performed on a Siemens (Erlangen, Germany) Prisma 3T scanner using a 52-channel head coil.
IMAGE RESOLUTION, SNR, AND GHOSTING
Point spread function (PSF) simulations were performed to evaluate the performance of the CEPI acquisition compared to EPI. The first PSF simulation examined the effect of circular sampling on the resolution of the CEPI acquisition compared to EPI. The input image was a circle of diameter equal to 3.4 mm and the input k-space trajectories are shown in Fig. 1 (b). It is important to note that actual resolution of the EPI and CEPI acquisitions were not identical. Matching the CEPI k-space diameter to the length of the EPI readout is equivalent to multiplying the EPI k-space with a circular window (32). The effect of this is that the CEPI resolution will be approximately (ratio of the root of the k-space areas) larger than the EPI resolution (33). PSF simulations were also performed for 150 Hz of off-resonance, which is a typical maximal value for field inhomogeneity in the brain. Simulations of the noise properties of the EPI and CEPI readouts were also performed. The k-space data for a digital brain phantom were first generated for the EPI and CEPI readouts using Eq. [2]. Gaussian noise with a 0.005 standard deviation was then added independently to the real and imaginary parts of the normalized synthetic k-space data. Images were then reconstructed with the generalized reconstruction with and without the added noise for comparison using the EPI and CEPI k-space trajectories.
Phantom and human brain scans were also performed to evaluate ghost reduction as well as overall image quality between CEPI and EPI. All scans were single-slice with a 3 mm thickness over a 22 cm FOV and 64X64 matrix size at minimum TEs of 15.6 and 24.6 ms for CEPI and EPI respectively. The k-space trajectories are shown in Fig. 1 (b). Reference scans were also acquired and images were reconstructed with and without ghost correction. The phantom was a uniform sphere of water. A single normal subject was scanned after obtaining informed consent from the Queens Medical Center and University of Hawaii Joint Institutional Review Boards.
ACCELERATED FUNCTIONAL MRI
Functional MRI in five normal subjects was performed after obtaining informed consent. In three subjects the fMRI experiments were conducted using NSMS = 1, 4, and 8 SMS blipped-CAIPI CEPI and in two subjects R = 1, 4, and 8 3D blipped-CAIPI CEPI. The imaging parameters were a 22 cm FOV, 64X64 resolution, 32 3 mm thick slices, and a 32.6 ms TE. The flip angle and TR for the SMS scans were 84, 55, 41 degrees and 2200, 550, and 275 ms respectively. The flip angle and TR for the 3D scans were 21 degrees and 68 ms. The flip angles were determined using the Ernst angle equation assuming a T1 of 1 s in the brain. Maps of the coil sensitivities were also acquired using a standard gradient echo acquisition matched for coverage and calculated with the regularized sensitivity map estimation algorithm available in the MIRT (34). Ghost correction was performed using the gradient delay τ and constant phase determined from the phantom and human scanning described above. No reference scan was acquired.
The fMRI task was designed to produce visual and auditory activation and was designed using the Cogent 2000 toolbox (Cogent 2000 developed by the Cogent 2000 team at the FIL and the ICN and Cogent Graphics developed by John Romaya at the LON at the Welcome Department of Imaging Neuroscience). The timing diagram of the task is shown in Fig. 2. The task started after an initial resting period of W0 = 14.25 s while the baseline fMRI data were acquired. An audio stimulus that consisted of a pure sine wave at a frequency of 1400 Hz was then played out for A = 2.2 s, which was equal to the sampling time for one whole brain image of the NSMS/R = 1 acquisitions. The audio stimulus was followed by a resting interval W1 = 1.1 s and subsequently a 10.7 s visual stimulus that consisted of a checkerboard flashing at a frequency of 8 Hz. Finally there was a resting period of W2 = 16 s. The total time for each audio/visual task block was 30 s and was repeated four times for a total duration of 120 s.
FIG. 2.
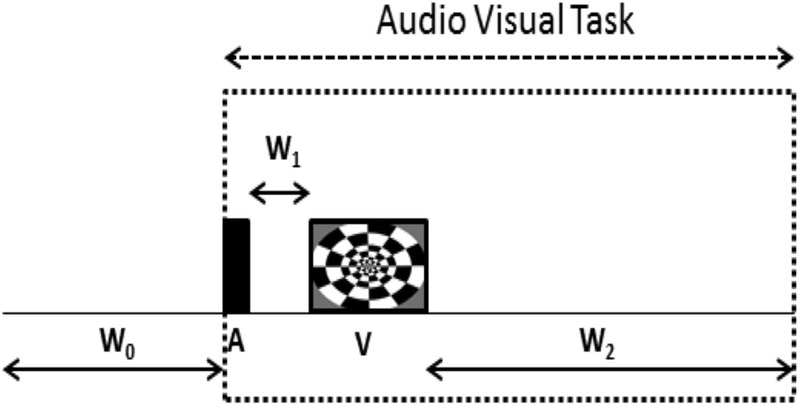
This figure shows the timing diagram of the audio/visual fMRI task block that was repeated four times within the paradigm. The block begins with an initial resting period of W0 = 14.25 s, followed by a 2.2 s 1400 Hz audio stimulus, a resting interval W1 = 1.1 s, a 10.7 s 8 Hz flashing checkerboard sequence and finally another resting period of W2 = 16 s. The time for each block was 30 s giving a 120 s long paradigm.
The fMRI data processing was performed in Matlab. The first 6.6 s of the time course (first three data points of the NSMS/R = 1 acquisition) were omitted to ensure a steady state condition within the data. In order to account for slow drifts unrelated to the paradigm, first and second order temporal trends were then removed. Next, spatial smoothing was performed at each time point using a three pixel wide Gaussian kernel with a 0.65 standard deviation. The images were then masked to exclude regions outside of the brain in the analysis. In order to be able to examine the effect of the higher temporal resolution of the accelerated acquisitions on the tSNR (temporal mean divided by the temporal standard deviation) as well as the BOLD activation, an anti-aliasing low-pass Chebyshev filter was applied and the data were decimated to match the 2.2 s TR of the NSMS or R = 1 acquisitions similar to Ref. (6). Finally, a general linear model (GLM) activation analysis was performed using a canonical HRF, taken from the SPM8 software (www.fil.ion.ucl.ac.uk/spm/software/spm8) with default values, convolved with the stimulus onset function to obtain the BOLD model function. No correction for multiple comparisons or correction for temporal correlations from the increased sampling rate (i.e. auto regressive modeling) was performed.
Maps of the g-factor were simulated for each accelerated trajectory using an approach based on the pseudo-replica method of Robson et al. (35) assuming negligible noise correlation between elements. First synthetic k-space data were obtained from the sensitivity map gradient echo magnitude images using the forward nuFFT operator for each undersampled and corresponding fully sampled trajectories. The k-space data were then normalized to the peak value and bivariate Gaussian noise with a 0.005 standard deviation was added. Images were generated for each undersampled and fully sampled data set using the sensitivity maps in the iterative reconstruction. This was repeated with a unique noise vector 100 times for each trajectory and SNR maps were obtained by taking the mean divided by standard deviation across all repetitions. The g-factor maps were then determined from ratio of the fully sampled SNR to the undersampled SNR times the square root of the acceleration factor.
Results
IMAGE RESOLUTION, SNR, AND GHOSTING
Figure 3 shows PSF simulation results for the EPI and CEPI trajectories for (a, b) 0 Hz and (c, d) 150 Hz of off-resonance. The EPI PSF shows a Gibbs ringing pattern consistent with Cartesian sampling whereas CEPI has a circular symmetry. Plots of the PSFs for EPI (red) and CEPI (blue) without and with off-resonance are shown in the Supporting Information Figure S1 (a) and (b) respectively. While the effect on the EPI PSF is a shift along the phase encoding (vertical) direction as expected, the CEPI PSF shows a smaller shift along the phase encoding direction as well as an observable broadening. The plots also show that the resolution of the CEPI is slightly lower due to the circular sampling. Note that the PSF from the EPI acquisition will be slightly different along the diagonal direction than what is shown here. Figure 3 also shows the digital brain phantom simulations for EPI and CEPI without noise in (e, f). These images are visually comparable. Figures (g) and (h) show the differences between (e) and (f) and the input digital brain phantom. The difference for CEPI in (h) shows residual Gibbs ringing. Figures (i) and (j) show the EPI and CEPI simulated images with added noise. The SNR of the simulated CEPI acquisition is reduced to approximately .77 of the SNR of the simulated EPI acquisition. This value is equal to the theoretical SNR ratio given by the ratio of the square roots of the readout lengths.
FIG. 3.
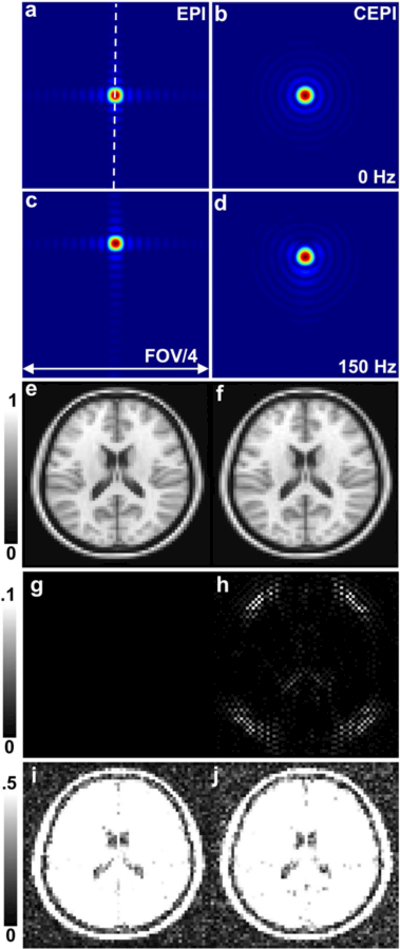
PSF simulations for EPI and CEPI for (a, b) 0 Hz and (c, d) 150 Hz of off resonance (scaled down to FOV/4) are shown. Also shown are digital brain phantom simulations for (e) EPI and (f) CEPI without noise. Figures (g) and (h) show the differences between (e) and (f) and the input digital brain phantom (windowed between 0 and 0.1). Figures (i) and (j) show EPI and CEPI simulated images with added noise (windowed between 0 and 0.5).
A demonstration of the efficacy of the ghosting correction in the generalized reconstruction is shown in Fig. 4. The reference scan determined that the constant term was approximately zero and the linear time delay was approximately 1.17 s. The phantom images acquired with the 2D CEPI acquisition with (a, c) and without (b) ghost correction show ghosting reduced to the order of a few percent. Similar results for the delay and level of ghosting were found for the brain images shown in (d-f). The efficacy of the ghost correction can also be seen in Supporting Information Figure S2 by the good alignment of the even and odd echoes for the phantom images.
FIG. 4.
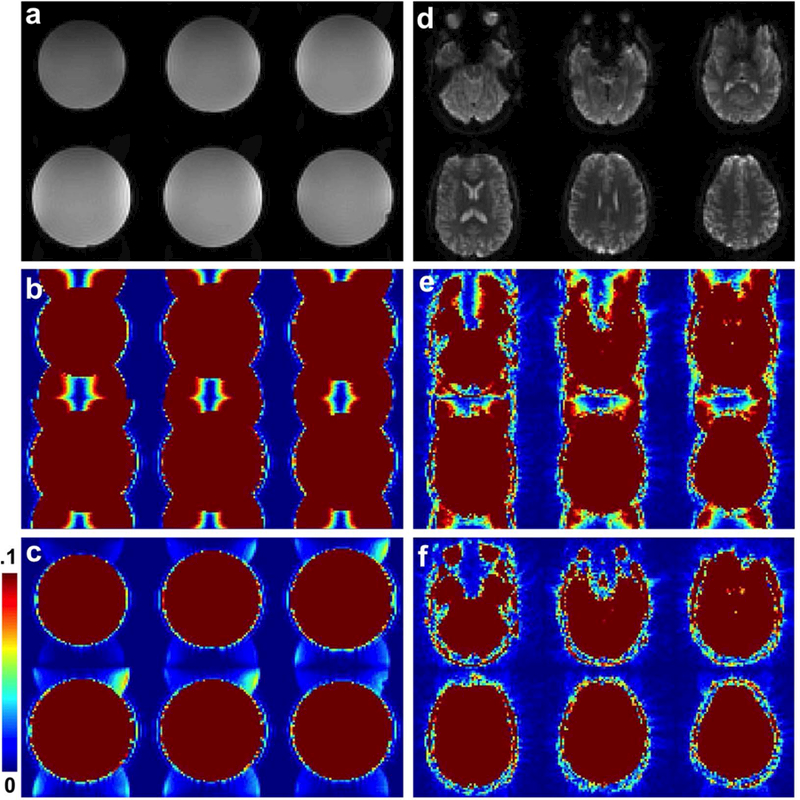
(a-c) Example of a phantom image acquired with the 2D CEPI trajectory with (a, c) and without (b) ghost correction ((b) and (c) are windowed to 10% of the maximum magnitude). Similarly brain images are shown in (d-f).
Figure 5 shows a comparison of brain images acquired using the 2D CEPI (a) and EPI (b) sequences. The x and y gradients and trajectories are depicted in Figs. 1 (a) and (b). The images were reconstructed using the same generalized reconstruction however the calibration for the EPI scan measured a time delay of 0.5 μs. There is no visible difference in image quality or artifact between the two.
FIG. 5.
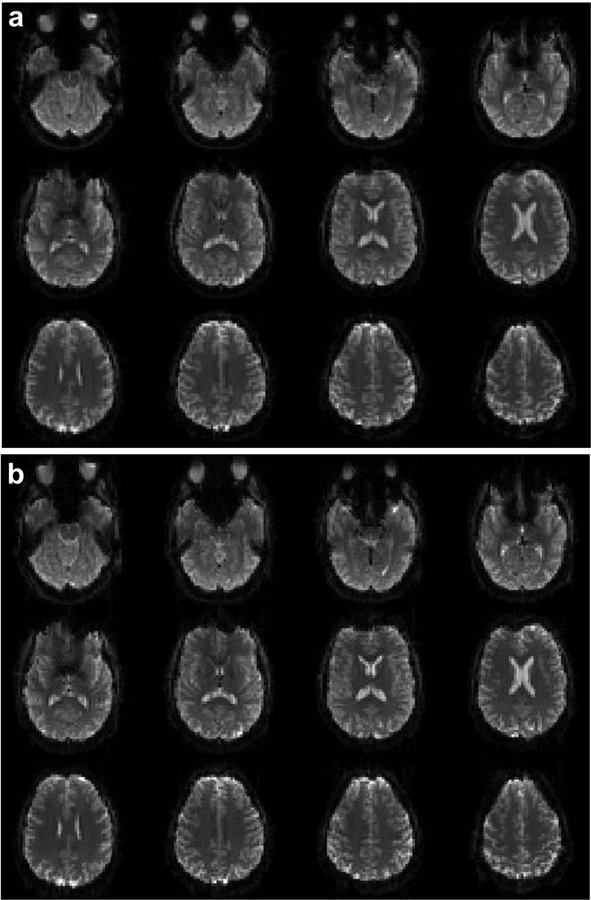
Comparison of images acquired using CEPI (a) and EPI (b) sequences. The x and y gradients and trajectories are shown in Figs. 1 (a) and (b) by the blue and red lines respectively. The images are windowed identically.
ACCELERATED FUNCTIONAL MRI
Figure 6 shows mean brain images from four slices in an fMRI time series for a subject acquired with NSMS = 1, 4, and 8 (a-c) using SMS blipped-CAIPI CEPI. An overall loss in magnitude going to higher acceleration due to the lower steady-state magnetization and shorter TR can be seen. The NSMS = 8 images have noticeable regions of uneven magnitude due to residual aliasing and g-factor noise enhancement. Supporting Information Table S1 lists the mean magnitudes for all three subjects, across all slices and brain pixels, and shows similar trends. Also shown are mean brain images for the R = 1, 4, and 8 (d-f) 3D blipped-CAIPI CEPI fMRI time series. Unlike the SMS images the 3D acquisition has similar magnitudes for each reduction factor because the TR and flip angle remain the same. Like the NSMS = 8 SMS images in (c), the R = 8 images also show regions with residual aliasing and g-factor noise. Supporting Information Table S2 lists the mean magnitudes for both subjects showing similar results. Supporting Information Figure S3 shows all slices for each acquisition, where the yellow box indicates the subset of the four slices shown in Fig. 6.
FIG. 6.
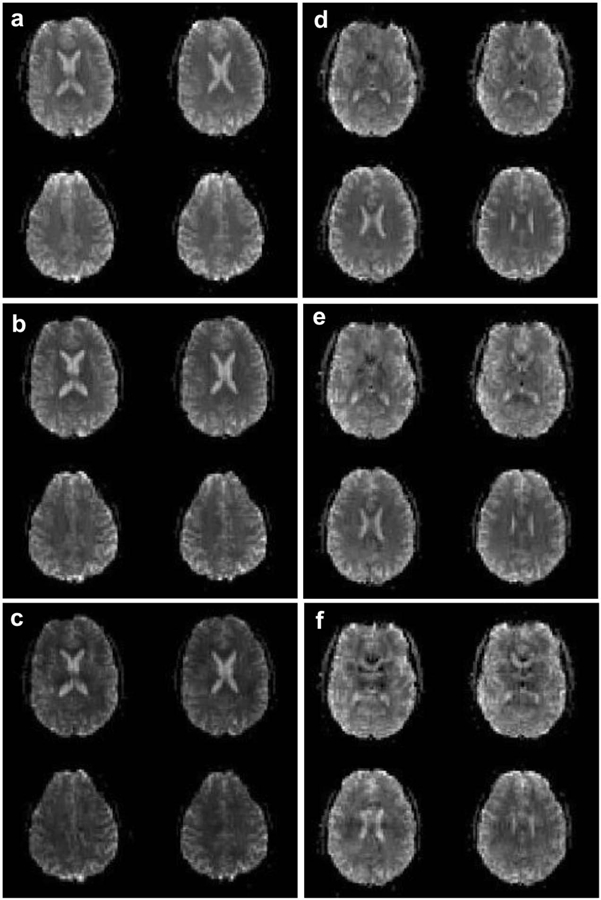
Four mean brain slices from an fMRI time series for a representative single subject acquired with (a) NSMS = 1, (b) NSMS = 4, and (c) NSMS = 8 SMS blipped-CAIPI CEPI. All three images are windowed identically. Also shown are the mean brain images for an (d) R = 1, (e) R = 4, and (f) R = 8 3D blipped-CAIPI CEPI fMRI time series. All three images are windowed identically.
The tSNR maps corresponding to the SMS blipped-CAIPI CEPI results in Fig. 6 (a-c) are shown in Fig. 7. The maps in (a-c) are for NSMS = 1, 4, and 8 show that tSNR decreases as a function of increasing acceleration due to factors including decreased steady-state magnetization, increased artifact from g-factor noise enhancement and residual aliasing, and increased noise due to the higher sampling rate. Supporting Information Figure S4 (a, b) shows tSNR maps for the NSMS = 4 and 8 results after decimation to account for the different sampling rates. The adjusted NSMS = 4 tSNR is a slightly lower than but in the range of the NSMS = 1 tSNR and the adjusted NSMS = 8 tSNR exceeds the NSMS = 4 value before decimation. This trend is consistent for all datasets as shown in Supporting Information Table S1 that lists the average tSNR for all three subjects. The bottom row of Fig. 7 shows g-factor simulations for NSMS = 4 and 8 (d, e) that were generated using the sensitivity maps from the subject. Note the large g-factor penalty for the NSMS = 8 acquisition which is a major factor for the decreased tSNR.
FIG. 7.
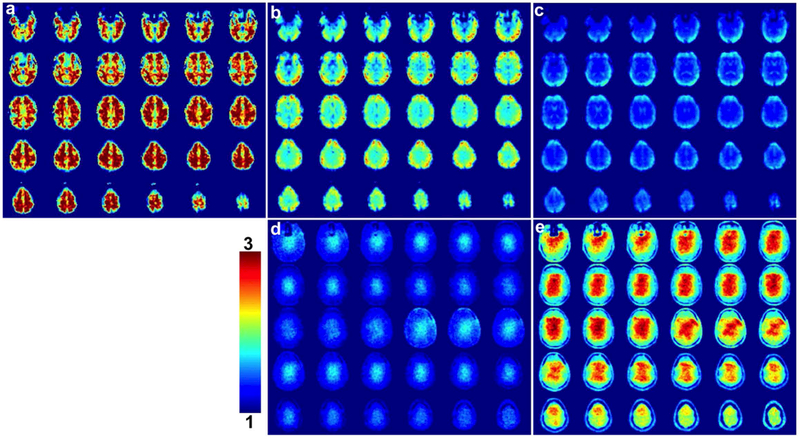
Maps of the tSNR for SMS blipped-CAIPI CEPI for (a) NSMS = 1, (b) NSMS = 4, and (c) NSMS = 8. The tSNR was calculated across all acquired time points excluding the first 6.6 s to account for the time to reach steady state conditions. The bottom row shows g-factor simulations for (d) NSMS = 4 and (e) NSMS = 8 windowed between 1 and 3.
Figure 8 (a-c) shows tSNR maps for 3D blipped-CAIPI CEPI results of Fig 6 (d-f) for R = 1, 4, and 8. The 3D tSNR is largest for the (b) R = 4 acquisition with the (a) R = 1 tSNR significantly lower compared to the NSMS = 1 SMS tSNR shown in Fig. 7 (a). The R = 4 and 8 (b, c) 3D tSNR however are comparable to the NSMS = 4 and 8 SMS tSNR shown in Fig. 7 (b, c). Supporting Information Figure S4 (c, d) shows the tSNR maps for R = 4 and 8 after decimation. The tSNR improves after decimation and is comparable to the respective SMS tSNR after decimation. It can be seen in Supporting Information Table S2 that this trend is observed in both subjects. The bottom row of Fig 8 shows g-factor simulations for R = 4 and 8 (d, e). The regions with reduced tSNR correspond closely to the areas with larger g-factor penalty.
FIG. 8.
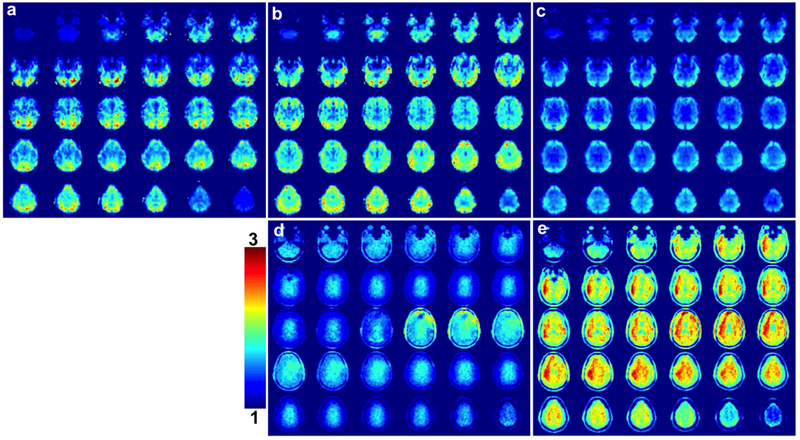
Maps of the tSNR for 3D blipped-CAIPI CEPI for (a) R = 1, (b) R = 4, and (c) R = 8. The tSNR was calculated across all acquired time points excluding the first 6.6 s to account for the time to reach steady state conditions. The bottom row shows g-factor simulations for (d) R = 4 and (e) R = 8 windowed between 1 and 3.
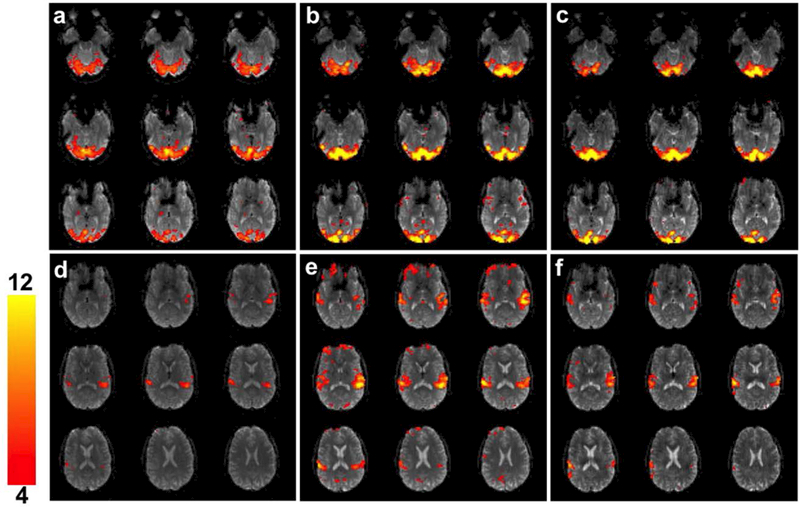
The BOLD fMRI analyses results of the SMS blipped-CAIPI CEPI are shown in Figure 9 for a single subject. The maps in (a-c) are for NSMS = 1, 4, and 8 and were obtained as a response to the 10.7 s visual cue and all show activation in the visual cortex with the higher sampling rates leading to larger t-values. Supporting Information Figure S5 (a) and (b) show visual activation for the same slices for NSMS = 4 and 8 after decimation and are visually comparable to NSMS = 1. Similarly activation from the 2.2 s audio tone for NSMS = 1, 4, and 8 (d-f) all show activation in the auditory regions with the higher sampling rate giving larger t-values. Similarly Supporting Information Figure S5 (c) and (d) show auditory activation for NSMS = 4 and 8 after decimation and are again comparable to NSMS = 1. Similar trends are observed for all three subjects as indicated in Supporting Information Table S1.
FIG. 9.
Figures (a)-(c) show visual activation in nine slices for NSMS = 1, 4, and 8 SMS blipped-CAIPI CEPI overlaid on the mean image for a single subject. The activation was windowed between t = 4 to 12. Similarly figures (d)-(f) show the audio activation in nine slices for NSMS = 1, 4, and 8 overlaid on the mean image.
Figure 10 (a-c) shows the BOLD fMRI results for the visual cue for R = 1, 4, and 8 3D blipped-CAIPI CEPI in a single subject. All maps show visual activation with the R = 4 and 8 having significantly larger t-values due to the higher sampling rate. Furthermore the (a) R = 1 activation maps have lower average t-values than the NSMS = 1 SMS activation maps shown in Fig. 9 (a). Supporting Information Figure S5 (e) and (f) show visual activation for the same slices for R = 4 and 8 after decimation and show activation maps with larger average t-values than R = 1 with the R = 4 acquisition having the highest. The audio activation is shown in Fig. 10 (d-f). Like the visual task the (f) R = 1 activation t-values are on average lower than the accelerated scans. After decimation the accelerated scans Supporting Information Figure S5 (g, h) also show higher t-values than the R = 1 scan. Supporting Information Table S2 lists the results for both subjects and shows similar trends.
FIG. 10.
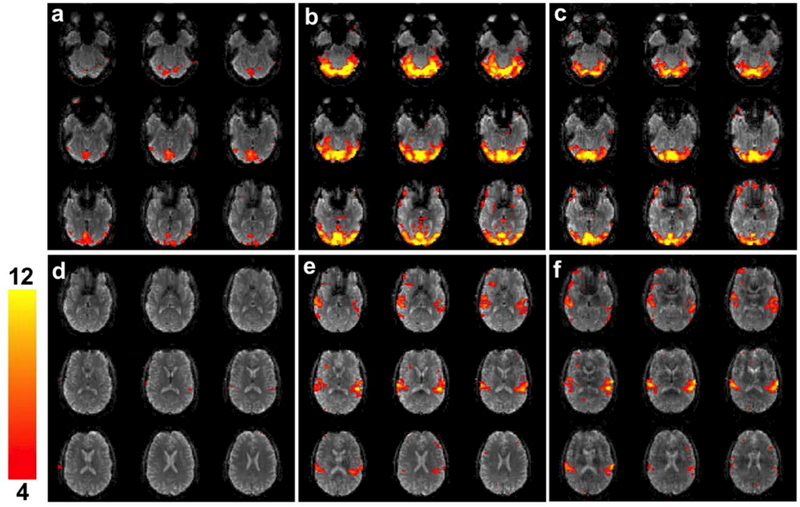
Figures (a)-(c) show visual activation in nine slices for R = 1, 4, and 8 3D blipped-CAIPI CEPI overlaid on the mean image for a single subject. The activation was windowed between t = 4 to 12. Similarly figures (d)-(f) show the audio activation in nine slices for R = 1, 4, and 8 overlaid on the mean image.
Discussion
A combination of maximum ramp sampling as well as a circular k-space support produced a CEPI acquisition with a short readout length. Specifically a readout length of 27.2 ms for a 64X64 resolution over a 22 cm FOV was obtained compared to 45.8 ms for a Cartesian EPI acquisition. The diameter of the circular region of the CEPI k-space was matched to the edge of the EPI k-space. As a result the CEPI resolution was approximately 12% lower than the EPI resolution. The resolutions would be identical if the k-space areas were matched instead resulting in a CEPI trajectory 32.7 ms in length for the same coverage. It was observed that the off resonance properties of the CEPI acquisition resulted in a shift along the phase encode direction similar to EPI but also some small blurring common to spiral. Although blurring was observed to be minimal, it is possible to implement corrections similar to those for spiral within the reconstruction framework proposed (36).
A challenge of the CEPI acquisition is the requirement of a non-Cartesian image reconstruction. Although iterative image reconstruction approaches using a signal equation model are common for spiral acquisitions they are not typically used for EPI (30). We show that EPI can be reconstructed within this same framework and that ghosting artifacts can be corrected by adding constant and linear phase terms to the signal equation. We found on our system that ghosting levels were reduced to levels on the order of a few percent. The phase terms could be obtained using a standard EPI reference and other approaches should be effective as well. On our system we found the constant phase term to be negligible and used only the linear term as a time delay in the reconstruction. We also found that the same delay worked for repeated scanning that used a given EPI trajectory; however more careful characterization of the eddy currents and associated delays on our system is still needed. The use of the generalized reconstruction framework also makes other k-space variants such as wave encoding for controlled aliasing and sparsity enforced compressed sensing with L1 regularization possible with EPI as well (37,38). The framework allows for the application of EPI to other model based techniques such as low rank image reconstruction (39,40).
The generalized framework also provides a straightforward extension of EPI and CEPI to SMS and 3D acquisitions using blipped-CAIPI and SENSE for the application of fast fMRI. We found that the same blipped-CAIPI CEPI trajectory could be applied to either an SMS or 3D implementation providing identical sampling. An advantage of this is that we were able to directly compare SMS and 3D acquisitions using identical parameters. On our system we implemented SMS and 3D blipped-CAIPI CEPI acquisitions to obtain 32 3 mm thick slices with a 22 cm FOV at a 64X64 resolution in 550 and 225 ms respectively. The SENSE reduction factors in each dimension were Rz = 2 in all cases and Ry = 2 or 4 for the NSMS (R) = 4 and 8 acquisitions respectively. In preliminary phantom experiments we determined these acceleration factors to be approximately the most efficient for the 52-channel coil on our system. The optimal acceleration and parallel imaging performance however will vary depending on the system as well as other sequence optimizations such as in Ref. (26) for example. There is nothing intrinsically limiting in our approach that would not allow for similar accelerations on other systems in other published work on EPI.
Although a single-shot 3D acquisition is desirable for fMRI, readout lengths on commercial scanners are currently long compared to T2* and segmentation is required to avoid off-resonance artifacts (41). The primary difference between the SMS and 3D methods can be understood by how they segment the imaged volume across multiple shots. The SMS approach uses a multiband RF pulse to segment the volume spatially along the slice-select direction. This has the advantage of acquiring a set of slices in one shot and “freezing” temporal correlations within the slice group. The 3D approach on the other hand uses a slab-select pulse and phase encoding to segment the acquisition along the kz-direction. This may average the temporal variations including physiological noise and BOLD activation across shots. However the exact mechanisms need further investigation. The 3D acquisition however has the advantage of a larger steady-state magnetization due to the larger volume excited offset by the shorter TR and lower flip angle. The impact of the differences between SMS and 3D on the tSNR and BOLD activation are discussed below.
Examination of the SMS and 3D blipped-CAIPI CEPI fMRI data found that the tSNR was in general similar across acceleration factors and acquisitions. The primary exception was that the R = 1 3D acquisition had significantly lower tSNR than the NSMS = 1 SMS acquisition in spite of having a comparable image magnitude and temporal resolution. This is likely the result of temporal averaging of the physiological fluctuations including motion as mentioned above. However once parallel imaging acceleration is applied the 3D tSNR becomes comparable to the SMS tSNR. This suggests that acceleration is crucial for 3D fMRI applications. We also observed that the tSNR for both 3D and SMS methods decreases with increasing sampling rate. This is likely the result of several factors including the reduced TR and flip angle for SMS and reduced phase encodes for 3D as well as g-factor noise, residual aliasing, and fluctuations with higher frequency such as physiological noise. Removing the high frequency noise by low pass filtering in the decimation process was found to increase the tSNR of the accelerated data, however remaining g-factor noise and lower steady state magnetization still produced a reduced tSNR compared to the fully sampled data. In this work we applied a low pass filter before decimation, however the higher sampling should allow more advanced noise filtering including the regression of physiological noise to preserve tSNR at higher sampling rates (42).
Activation from the BOLD fMRI task consisting of a repeated 10.7 s visual stimulation and 2.2 s audio tone were examined as well. All of the acquisitions generally found activation in the visual and auditory cortices as expected with similar results dependent on acceleration and sampling rates. The exception was again the R = 1 3D acquisition that produced very little activation above the t = 4 threshold. This can be partially attributed to the relatively low tSNR as discussed above. However the R = 8 3D acquisition that had the lowest tSNR but the highest sampling rate was able to capture the activation over more pixels with higher t-values. The accelerated 3D acquisitions still showed reasonable activation even after decimation down to the R = 1 sampling rate. Again, this suggests that the slower 3D acquisition may perform an unwanted averaging of the BOLD response over the z-phase encoding shots giving an additional reason why acceleration is desirable.
All of the accelerated acquisitions showed higher t-values than the non-accelerated acquisitions. After decimation the t-values for NSMS = 4 and 8 SMS were reduced and the results became comparable to the NSMS = 1 scan. The R = 4 and 8 3D scans also showed comparable activation to the SMS scans with the same sampling rate both before and after decimation. However the degree to how much the increased sampling rate using SMS or 3D with acceleration actually improves the sensitivity to neuronal activation is an open question in task fMRI. The increased acceleration offers more degrees of freedom however these will be offset by the decreased tSNR. In all five subjects we were not able to distinguish whether the activation from NSMS (R) = 8 was lower than the NSMS (R) = 4 case in spite of the lower tSNR. No significant difference in sensitivity between the accelerated SMS and 3D imaging was observed, however the sample size was limited. It is likely with more subjects and acceleration factors we will find the optimal configuration for the scanner hardware and paradigm we used as well as differences between SMS and 3D modalities.
Another challenge is how to properly account for added degrees of freedom and the serial correlation between time points. The faster the fMRI data are acquired, the greater that chance of having autocorrelation in between successive time points. This will also likely increase the t-score values obtained by standard fMRI statistical tests. Although methods for modeling temporal correlations have been proposed (7–9), the actual effect of increased sampling rates on the BOLD statistics is still an open question for investigation. In this work we applied a less conservative approach by only decimating the data as discussed in the work of Todd et al. (6). We are currently performing research into the temporal correlations of the BOLD signal as well as the noise structure of accelerated fMRI data.
Conclusions
We demonstrated a blipped-CAIPI CEPI acquisition for efficient SMS or 3D fMRI. A generalized signal equation framework was also presented that accounts for ghosting and should allow for the extension of EPI to more advanced model-based reconstructions and sampling schemes. Both the SMS and 3D accelerated acquisitions showed similar activation sensitivities as well as tSNR. However, acceleration of the 3D acquisition was crucial for the 3D acquisition due to temporal smoothing of the data. The optimal tradeoff in acceleration, tSNR, and BOLD sensitivity however is an open issue and likely application and hardware dependent.
Supplementary Material
Acknowledgments
Grant sponsor: This work was supported by NIH R01DA019912 and R21EB020760
References
- 1.Bandettini PA, Wong EC, Hinks RS, Tikofsky RS, Hyde JS. Time course EPI of human brain function during task activation. Magn Reson Med 1992;25(2):390–397. [DOI] [PubMed] [Google Scholar]
- 2.Turner R, Jezzrad P, Wen H, Kwong KK, Le Bihan D, Zeffiro T, Balaban RS. Functional Mapping of the Human Visual Cortex at 4 and 1.5 Tesla Using Deoxygenation Contrast EPI. Magnetic Resonance in Medicine 1993;29:277–279. [DOI] [PubMed] [Google Scholar]
- 3.Todd N, Moeller S, Auerbach EJ, Yacoub E, Flandin G, Weiskopf N. Evaluation of 2D multiband EPI imaging for high-resolution, whole-brain, task-based fMRI studies at 3T: Sensitivity and slice leakage artifacts. Neuroimage 2016;124(Pt A):32–42. [DOI] [PMC free article] [PubMed] [Google Scholar]
- 4.Jezzard P, Balaban RS. Correction for geometric distortion in echo planar imagnes from B0 variations. Magn Reson Med 1995;34:65–73. [DOI] [PubMed] [Google Scholar]
- 5.Feinberg DA, Moeller S, Smith SM, Auerbach E, Ramanna S, Glasser MF, Miller KL, Ugurbil K, Yacoub E. Multiplexed echo planar imaging for sub-second whole brain FMRI and fast diffusion imaging. PLoS One 2011;5(12):e15710. [DOI] [PMC free article] [PubMed] [Google Scholar]
- 6.Todd N, Josephs O, Zeidman P, Flandin G, Moeller S, Weiskopf N. Functional Sensitivity of 2D Simultaneous Multi-Slice Echo-Planar Imaging: Effects of Acceleration on g-factor and Physiological Noise. Front Neurosci 2017;11:158. [DOI] [PMC free article] [PubMed] [Google Scholar]
- 7.Bollmann S, Puckett AM, Cunnington R, Barth M. Serial correlations in single-subject fMRI with sub-second TR. Neuroimage 2018;166:152–166. [DOI] [PubMed] [Google Scholar]
- 8.Sahib AK, Mathiak K, Erb M, Elshahabi A, Klamer S, Scheffler K, Focke NK, Ethofer T. Effect of temporal resolution and serial autocorrelations in event-related functional MRI. Magn Reson Med 2016;76(6):1805–1813. [DOI] [PubMed] [Google Scholar]
- 9.Corbin N, Todd N, Friston KJ, Callaghan MF. Accurate modeling of temporal correlations in rapidly sampled fMRI time series. Hum Brain Mapp 2018. [DOI] [PMC free article] [PubMed] [Google Scholar]
- 10.Pruessmann KP, Weiger M, Scheidegger MB, Boesiger P. SENSE: Sensitivity encoding for fast MRI. Magn Reson Med 1999;42:952–962. [PubMed] [Google Scholar]
- 11.Griswold MA, Jakob PM, Heidemann RM, Nittka M, Jellus V, Wang J, Kiefer B, Haase A. Generalized autocalibrating partially parallel acquisitions (GRAPPA). Magn Reson Med 2002;47(6):1202–1210. [DOI] [PubMed] [Google Scholar]
- 12.Sodickson DK, Manning WJ. Simultaneous acquisition of spatial harmonics (SMASH): fast imaging with radiofrequency coil arrays. Magn Reson Med 1997;38(4):591–603. [DOI] [PubMed] [Google Scholar]
- 13.Hu X, Le TH, Parrish T, Erhard P. Retrospective Estimation and Correction of Physiological Fluctuation in Functional MRI. Magn Reson Med 1995;34:201–212. [DOI] [PubMed] [Google Scholar]
- 14.Larkman DJ, Hajnal JV, Herlihy AH, Coutts GA, Young IR, Ehnholm G. Use of multicoil arrays for separation of signal from multiple slices simultaneously excited. J Magn Reson Imaging 2001;13(2):313–317. [DOI] [PubMed] [Google Scholar]
- 15.Poser BA, Koopmans PJ, Witzel T, Wald LL, Barth M. Three dimensional echo-planar imaging at 7 Tesla. Neuroimage 2010;51(1):261–266. [DOI] [PMC free article] [PubMed] [Google Scholar]
- 16.Feinberg DA, Setsompop K. Ultra-fast MRI of the human brain with simultaneous multi-slice imaging. J Magn Reson 2013;229:90–100. [DOI] [PMC free article] [PubMed] [Google Scholar]
- 17.Zahneisen B, Poser BA, Ernst T, Stenger VA. Three-dimensional Fourier encoding of simultaneously excited slices: generalized acquisition and reconstruction framework. Magn Reson Med 2014;71(6):2071–2081. [DOI] [PMC free article] [PubMed] [Google Scholar]
- 18.Setsompop K, Gagoski BA, Polimeni JR, Witzel T, Wedeen VJ, Wald LL. Blipped-controlled aliasing in parallel imaging for simultaneous multislice echo planar imaging with reduced g-factor penalty. Magn Reson Med 2012;67(5):1210–1224. [DOI] [PMC free article] [PubMed] [Google Scholar]
- 19.Breuer FA, Blaimer M, Heidemann RM, Mueller MF, Griswold MA, Jakob PM. Controlled aliasing in parallel imaging results in higher acceleration (CAIPIRINHA) for multi-slice imaging. Magnetic resonance in medicine : official journal of the Society of Magnetic Resonance in Medicine / Society of Magnetic Resonance in Medicine 2005;53(3):684–691. [DOI] [PubMed] [Google Scholar]
- 20.Pauly JM, Butts K, LukPat GT, Macovski A. A Circular Echo-Planar Sequence, In: Proceedings of the Soc. of Magn. Reson, 3rd Scientific Meeting; 1995. p. 106. [Google Scholar]
- 21.Kerr AB, Pauly JM, Hu BS, Li KC, Hardy CJ, Meyer CH, Macovski A, Nishimura DG. Real-time interactive MRI on a conventional scanner. Magn Reson Med 1997;38(3):355–367. [DOI] [PubMed] [Google Scholar]
- 22.Pruessmann KP, Weiger M, Bornert P, Boesiger P. Advances in sensitivity encoding with arbitrary k-space trajectories. Magn Reson Med 2001;46:638–651. [DOI] [PubMed] [Google Scholar]
- 23.Zahneisen B, Ernst T, Poser BA. SENSE and simultaneous multislice imaging. Magn Reson Med 2015;74(5):1356–1362. [DOI] [PMC free article] [PubMed] [Google Scholar]
- 24.Fessler JA. Model-Based Image Reconstruction for MRI. IEEE Signal Process Mag 2010;27(4):81–89. [DOI] [PMC free article] [PubMed] [Google Scholar]
- 25.Fessler JA. On NUFFT-based gridding for non-Cartesian MRI. Journal of magnetic resonance 2007;188(2):191–195. [DOI] [PMC free article] [PubMed] [Google Scholar]
- 26.Stirnberg R, Huijbers W, Brenner D, Poser BA, Breteler M, Stocker T. Rapid whole-brain resting-state fMRI at 3 T: Efficiency-optimized three-dimensional EPI versus repetition time-matched simultaneous-multi-slice EPI. Neuroimage 2017;163:81–92. [DOI] [PubMed] [Google Scholar]
- 27.Narsude M, Gallichan D, van der Zwaag W, Gruetter R, Marques JP. Three-dimensional echo planar imaging with controlled aliasing: A sequence for high temporal resolution functional MRI. Magn Reson Med 2016;75(6):2350–2361. [DOI] [PubMed] [Google Scholar]
- 28.Buonocore MH, Gao L. Ghost artifact reduction for echo planar imaging using image phase correction. Magn Reson Med 1997;38(1):89–100. [DOI] [PubMed] [Google Scholar]
- 29.Bruder H, Fischer H, Reinfelder HE, Schmitt F. Image reconstruction for echo planar imaging with nonequidistant k-space sampling. Magnetic Resonance in Medicine 1992;23:311–323. [DOI] [PubMed] [Google Scholar]
- 30.Sutton BP, Noll DC, Fessler JA. Fast, iterative image reconstruction for MRI in the presence of field inhomogeneities. IEEE Trans Med Imaging 2003;22(2):178–188. [DOI] [PubMed] [Google Scholar]
- 31.Ahn CB, Cho ZH. A new phase correction method in NMR imaging based on autocorrelation and histogram analysis. IEEE Trans Med Imaging 1987;6(1):32–36. [DOI] [PubMed] [Google Scholar]
- 32.Bernstein MA, Fain SB, Riederer SJ. Effect of windowing and zero-filled reconstruction of MRI data on spatial resolution and acquisition strategy. J Magn Reson Imaging 2001;14(3):270–280. [DOI] [PubMed] [Google Scholar]
- 33.Van Geldern P Comparing true resolution in circular versus square sampling. In Proceedings of the 6th Annual Meeting of ISMSM, Sydney, Austrailia, 1998. p. 424. [Google Scholar]
- 34.Allison MJ, Ramani S, Fessler JA. Accelerated regularized estimation of MR coil sensitivities using augmented Lagrangian methods. IEEE Trans Med Imaging 2013;32(3):556–564. [DOI] [PMC free article] [PubMed] [Google Scholar]
- 35.Robson PM, Grant AK, Madhuranthakam AJ, Lattanzi R, Sodickson DK, McKenzie CA. Comprehensive quantification of signal-to-noise ratio and g-factor for image-based and k-space-based parallel imaging reconstructions. Magnetic resonance in medicine : official journal of the Society of Magnetic Resonance in Medicine / Society of Magnetic Resonance in Medicine 2008;60(4):895–907. [DOI] [PMC free article] [PubMed] [Google Scholar]
- 36.Noll D, Pauly J, Meyer C, Nishimura D, Macovski A. Deblurring for non-2D Fourier transform magnetic resonance imaging. Magn Reson Med 1992;25(2):319–333. [DOI] [PubMed] [Google Scholar]
- 37.Bilgic B, Gagoski BA, Cauley SF, Fan AP, Polimeni JR, Grant PE, Wald LL, Setsompop K. Wave-CAIPI for highly accelerated 3D imaging. Magn Reson Med 2015;73(6):2152–2162. [DOI] [PMC free article] [PubMed] [Google Scholar]
- 38.Lustig M, Donoho D, Pauly JM. Sparse MRI: The application of compressed sensing for rapid MR imaging. Magn Reson Med 2007;58(6):1182–1195. [DOI] [PubMed] [Google Scholar]
- 39.Otazo R, Candes E, Sodickson DK. Low-rank plus sparse matrix decomposition for accelerated dynamic MRI with separation of background and dynamic components. Magn Reson Med 2015;73(3):1125–1136. [DOI] [PMC free article] [PubMed] [Google Scholar]
- 40.Chiew M, Smith SM, Koopmans PJ, Graedel NN, Blumensath T, Miller KL. k-t FASTER: Acceleration of functional MRI data acquisition using low rank constraints. Magn Reson Med 2015;74(2):353–364. [DOI] [PMC free article] [PubMed] [Google Scholar]
- 41.Zahneisen B, Hugger T, Lee KJ, LeVan P, Reisert M, Lee HL, Asslander J, Zaitsev M, Hennig J. Single shot concentric shells trajectories for ultra fast fMRI. Magnetic resonance in medicine : official journal of the Society of Magnetic Resonance in Medicine / Society of Magnetic Resonance in Medicine 2012;68(2):484–494. [DOI] [PubMed] [Google Scholar]
- 42.Cordes D, Nandy RR, Schafer S, Wager TD. Characterization and reduction of cardiac-and respiratory-induced noise as a function of the sampling rate (TR) in fMRI. Neuroimage 2014;89:314–330. [DOI] [PMC free article] [PubMed] [Google Scholar]
Associated Data
This section collects any data citations, data availability statements, or supplementary materials included in this article.


