

Abstract
Purpose
Independent and combined effects of air pollution and psychosocial stressors on hypertension, a risk factor for cardiovascular disease, among Hispanics are not well studied.
Methods
We administered a pilot-tested questionnaire on individual- and neighborhood-level psychosocial stressors, developed with community input, to nearly 2500 individuals from the MD Anderson Cancer Center cohort of Mexican-Americans. We used data from local air quality monitors to estimate individual exposures to ozone (O3) and fine particulate matter (PM2.5) for the 12-month period preceding enrollment using inverse distance interpolation. We applied logistic regression models to examine relationships between exposures to psychosocial stressors and air pollution with prevalent hypertension and used stratified analyses to examine the interacting effects of these two exposures on hypertension.
Results
There was a positive association between prevalent hypertension and a high frequency of feeling anxious or depressed (prevalence odds ratio (POR) = 1.36, 95% CI [1.06–1.75]) and experiencing aches and pains (POR = 1.29, 95% CI [1.01–1.64]). The odds of having hypertension were also elevated among those worrying about their own health (POR = 1.65, 95% CI [1.30–2.06]) or about not having enough money (POR = 1.27, 95% CI [1.01–1.6]). We observed an inverse association between O3 and hypertension. There was no interaction between psychosocial stressors and O3 on hypertension.
Conclusion
Our findings add to the evidence of a positive association between individual and family stressors on hypertension among Hispanics and other racial/ethnic groups. Contrary to previous studies reporting positive associations, our results suggest that long-term exposure to O3 may be inversely related to prevalent hypertension.
Keywords: Air pollution, Psychosocial stress, Hypertension, Mexican-origin Hispanics
Introduction
A relatively large body of literature has examined associations between psychosocial stressors and hypertension, one of the leading risk factors for cardiovascular disease (CVD). Making comparisons between investigations, however, is challenging. Not only do the specific domains of psychosocial stress that have been evaluated vary between studies, but the indicators selected to measure these domains and the duration (e.g., acute versus chronic) and context (e.g., at work) in which stress occurs also differ [1]. Further, most of the research has focused on non-Hispanic whites [2–5].
Relatively less is known about the impact of psychosocial stress on the risk of hypertension among Hispanics in the United States (U.S.), for whom CVD is the leading cause of death [6]. Gallo et al. found that self-reported chronic stress was positively associated with increased odds of hypertension (OR = 1.10, 95% CI [1.02–1.19]) whereas traumatic stress was associated with a lower odds of hypertension (0R = 0.88, 95%, CI [0.82–0.93]) among adult Hispanics largely from Mexico, Cuba, and Central America [1]. Among postmenopausal Hispanic women, Zambrana et al. reported a positive association between depression and hypertension at baseline (OR = 1.25, 95% CI [1.04–1.51]), as well as between history of depression and pre-hypertensive status (OR = 1.27, 95% CI [1.01–1.61) [7]. Acculturation has also been studied as a psychosocial risk factor for hypertension among Hispanics with conflicting findings [8–11]. Additionally, perceived race-based discrimination has been associated with hypertension among racial and ethnic minorities [12]. Hicken et al. found that racism-related vigilance, a source of chronic stress, is associated with hypertension among Hispanics (OR = 1.05, 95% CI [0.99–1.12) [13]. Further, LeBron et al. report that Latino immigrants are more likely to experience increases in blood pressure associated with individual or institutional discrimination compared to US-born Latinos [14].
Beyond psychosocial stressors, there are ample studies underscoring the putative role of exposures to outdoor air pollutants on risk of hypertension [15–20]. Of particular concern is fine particulate matter (particulate matter with aerodynamic diameter less than 2.5 μm; PM2.5) [18, 21–24]. In contrast, fewer studies have examined the risks of hypertension associated with exposure to ozone (O3) [16, 18], a secondary air pollutant formed when oxides of nitrogen and volatile organic compounds interact in the presence of sunlight. Thus far, the relation between O3 exposure and hypertension is equivocal [25–30] and unlike PM2.5, no studies have investigated the association between O3 and hypertension among U.S. Hispanics.
Proinflammatory and oxidative stress pathways have been posited as underlying biological mechanisms for CVD. Potential pathways linking psychosocial stressors and CVD involve neuroendocrine activity of the autonomic nervous system (ANS) and the hypothalamus-pituitary adrenal (HPA) axis [31]. Ambient air pollutants are capable of mediating adverse cardiovascular responses through several mechanisms, such as impacting endothelial and other hemodynamic function, triggering acute autonomic imbalance and oxidative stress in the lungs with systematic inflammatory responses [15–20].
We designed a study to address the paucity of literature informing the role of air pollution and psychosocial stress on hypertension among individuals of Mexican-origin in Houston, Texas. In addition to being a busy seaport and home to the largest petrochemical complex in the country, Houston’s heavy traffic contributes to its poor air quality and the city’s diverse residents face documented health disparities [32–35]. Finally, while there is evidence of health inequity linked to myriad neighborhood-level environmental and social factors in urban centers [36, 37], the combined effect of air pollution and psychosocial stressors, particularly among Hispanics, is not well understood. Thus, our overall objective was twofold: (1) using a mixed-methods approach, to assess exposures to ambient air pollution (PM2.5 and O3) and individual- and neighborhood-level psychosocial stressors in this vulnerable population and (2) to evaluate the independent and interacting effects of these chemical and non-chemical stressors on prevalent hypertension.
Methods
Study Population
Participants were randomly selected from The University of Texas MD Anderson Cancer Center (MDACC) Mano a Mano Mexican-American cohort study in Houston, Harris County, Texas (n = 23,606) [38]. At baseline, participants complete an interview in the language of their choice (either English or Spanish) and provide information about health status, demographic characteristics, access to healthcare, degree of acculturation, lifestyle behaviors, and occupational and residential histories. As part of the Mano a Mano study, additional follow-up telephone interviews occur every 6 months.
For the present analysis, we recruited 2481 participants aged 20 years or older who enrolled in Mano a Mano between 2007 and 2014, based on responses to the question: “have you been told by a health professional that you have high blood pressure, also called hypertension?” After excluding participants (n = 13) without valid geographic coordinates for their residential address, the final sample size was 2468: 1135 cases with hypertension and 1333 controls without hypertension. There were 87 households with two participants and six households with more than two participants.
Psychosocial Stressors
We collected primary data in 2014–2015 during regularly scheduled Mano a Mano follow-up interviews. Following development of a questionnaire [39], trained interviewers administered a 32-item survey in the language preference of participants (English or Spanish) on psychosocial stressors in the home, neighborhood, and at work that they may have experienced at the time they enrolled. Questions were also asked about certain behaviors and lifestyle preferences that might affect exposure to air pollutants. Participants responded to each question using a five-point Likert scale: Not at all; Yes, a little bit; Yes, sometimes; Yes, a lot of the time; Yes, Most of the time. For analyses, responses were collapsed into three categories: low (no, not at all and yes, a little bit), medium (yes, sometimes) and high (yes, a lot of the time and yes, most of the time). Large proportions of participants (66% percent of cases and 63% of controls) did not answer the questions about work-related stressors (e.g., occupational exposure to chemicals, unsafe work conditions, working too hard). Hence, these questions were not further analyzed.
Long-Term Exposures to PM2.5 and O3
We obtained validated hourly air pollution data for O3 and PM2.5 from the Texas Commission on Environmental Quality (TCEQ), the environmental agency for the state. We used data from all active monitoring stations that continuously measured hourly O3 (n = 49) and PM2.5 (n = 15) concentrations in the 8-county greater Houston area (i.e., Brazoria, Chambers, Fort Bend, Galveston, Harris, Liberty, Montgomery, and Waller Counties) for 2006 through 2014 (Fig. 1). We excluded one O3 monitoring station and one PM2.5 monitoring station reporting ≥ 25% missing observations over the entire study period. Ozone and PM2.5 concentrations were reported in parts per billion and micrograms per cubic meter, respectively.
Fig. 1.
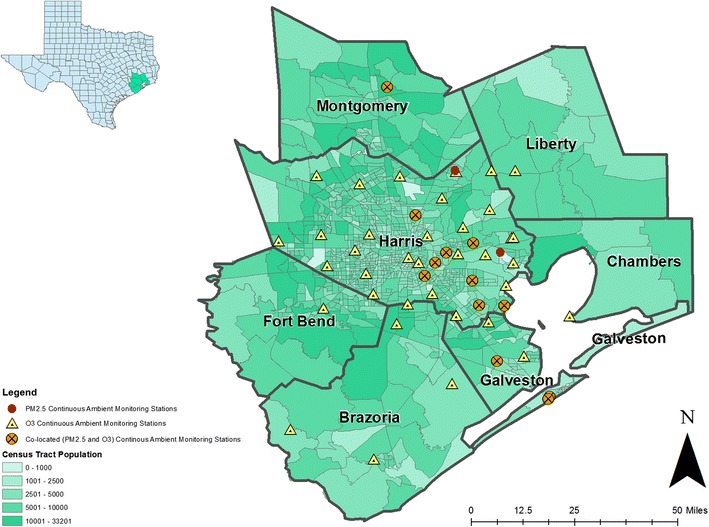
Locations of all regulatory and non-regulatory continuous ambient monitoring stations for O3 and PM2.5 active at any time in the study region from 2006—2014. The number of O3 monitoring stations ranged from 41 to 45 in a given year: 41 in 2013; 42 in 2007, 2008, 2010, and 2014; 43 in 2006 and 2012; 45 in 2009 and 2011. The number of PM2.5 stations included was 9 in 2006, 2011–2014; 10 in 2007–2008; and 11 in 2009–2010
Exposure estimates were constructed using SAS (Version 9.4, SAS Institute, Cary, North Carolina) and ArcGIS Desktop (Release 10.2.2., Environmental Systems Research Institute (ESRI), Redlands, California). We calculated the maximum average eight-hour O3 concentration within a 24-h period and the daily average PM2.5 concentration for each monitoring station from January 1, 2006 to December 31, 2014. Using this daily time series of O3 and PM2.5 concentrations, we assigned individual exposure estimates based on the average concentration for the 12-month period preceding baseline enrollment using inverse distance weighting (IDW; p = 2) [40] for the three monitoring stations nearest to the participant’s geocoded residential address.
Covariates
Demographic characteristics were obtained during the baseline Mano a Mano interview. Age at baseline was categorized into four strata (<30, 30–39, 40–39, 50+). Education was assessed in terms of highest level completed and collapsed into three levels (< High School, High School/General Education Development (GED), and > High School education). Nativity status (U.S.- or Mexico-born) was used to measure acculturation. Annual household income in the year preceding baseline was broken down into four levels (≤ $24,999, $25,000 to $44,999, $45,000 to $74,999, ≥ $75,000). Smoking and alcohol use were categorized as current, former, or never. Body Mass Index (BMI) was calculated and categorized as underweight/normal weight (< 25.0 kg/m2), overweight (25.0–< 30.0 kg/m2), obese (30.0–< 35.0 kg/m2), extremely obese II (35.0–< 40.0 kg/m2), and extremely obese III (≥ 40.0 kg/m2). Having asthma at baseline as diagnosed by a healthcare provider was reported as “yes” or “no”.
Statistical Analyses
All statistical analyses were conducted using SAS software (Version 9.4, SAS Institute, Cary, North Carolina). We used logistic regression and computed prevalence odds ratios (POR) and 95% confidence intervals (CI) to examine associations between psychosocial stressors or air pollution and hypertension. We examined air pollution exposures as continuous or categorical (quartiles) variables, in separate models. The following variables were identified a priori as risk factors and included in all adjusted models: age, sex, nativity, smoking, alcohol, BMI, and having asthma. We also evaluated education and employment using the change-in-estimate approach [41] but their inclusion did not change the effect estimate by more than 10% and thus, they were excluded from the final models. We additionally used stratified analysis to examine potential interaction between air pollution and those psychosocial stressors that were independently associated with hypertension (p < 0.05).
Sensitivity Analyses
We conducted sensitivity analyses using air pollution exposure estimates constructed with a single (i.e., the closest) monitor and applied mixed-effects logistic regression models with household specified as random effect to account for the correlation among individuals living together in the same household.
The Institutional Review Boards at MDACC and the University of Texas Health Science Center at Houston (UTHealth) approved the study and oral informed consent during phone interviews was obtained from all participants.
Results
The majority of participants lived within the Houston city limits (66.25%). The next largest proportion of participants lived in Pasadena (22.11%), a community located east of Houston, near the Houston Ship Channel and numerous industrial facilities. Individuals ranged in age from 20 to 60 years at baseline; the mean age was 53 years (SD 11.15) among cases and 40 years (SD 10.77) among controls (Table 1). Over 85% of cases and controls were women and most had less than 12 years of education (64% of cases and 57% of controls) and were born in Mexico (72% of cases and 85% of controls). A large proportion of cases (42%) and controls (39%) did not report on income (data not shown).
Table 1.
Sociodemographic characteristics and self-reported hypertension among Mexican-origin Hispanics (N = 2468) (missing observations are not shown), Houston, Texas, 2007–2014
| Cases (n = 1135) | Controls (n = 1333) | OR | 95% CI | ||
|---|---|---|---|---|---|
| Age (years) | |||||
| < 30 | 22 | 219 | Ref | ||
| 30–39 | 131 | 503 | 2.59* | 1.61 | 4.18 |
| 40–49 | 271 | 359 | 7.51* | 4.72 | 11.97 |
| 50+ | 711 | 252 | 28.09* | 17.71 | 44.55 |
| Gender | |||||
| Men | 163 | 99 | Ref | ||
| Women | 972 | 1234 | 0.48* | 0.37 | 0.62 |
| Nativity | |||||
| Mexico | 820 | 1131 | Ref | ||
| USA | 314 | 201 | 2.16* | 1.77 | 2.63 |
| Education (years) | |||||
| 13+ | 209 | 264 | Ref | ||
| < 12 | 722 | 764 | 1.19 | 0.97 | 1.47 |
| High school graduate/GED | 203 | 305 | 0.84 | 0.65 | 1.08 |
| Employment | |||||
| Never worked | 192 | 210 | Ref | ||
| Ever worked | 936 | 1103 | 0.93 | 0.75 | 1.15 |
| Smoking | |||||
| Never | 842 | 1113 | Ref | ||
| Current | 81 | 88 | 1.22 | 0.89 | 1.67 |
| Former | 211 | 132 | 2.11* | 1.67 | 2.67 |
| Alcohol Consumption | |||||
| Never | 837 | 1049 | Ref | ||
| Current | 169 | 200 | 1.06 | 0.85 | 1.33 |
| Former | 129 | 79 | 2.05* | 1.53 | 2.75 |
| Body mass index (kg/m2) | |||||
| Underweight/normal weight (< 24.9) | 103 | 244 | Ref | ||
| Overweight (25.0 to 29.9) | 303 | 455 | 1.58* | 1.20 | 2.07 |
| Obese I (30.0 to 34.9) | 309 | 350 | 2.09* | 1.59 | 2.76 |
| Obese II (35.0 to 39.9) | 199 | 168 | 2.81* | 2.06 | 3.82 |
| Obese III (≥ 40.0) | 190 | 75 | 6.00* | 4.22 | 8.54 |
| Asthma | |||||
| No | 451 | 342 | Ref | ||
| Yes | 684 | 991 | 0.52* | 0.44 | 0.62 |
OR odds ratio; CI confidence interval
*p < 0.05 for associations between covariates and hypertension
Selected percentiles of the distribution of O3 and PM2.5 exposures appear in Table 2. The median (IQR) O3 exposure was 35.41 ppb (4.78) among cases and 36.07 ppb (2.69) among controls. The median (IQR) PM2.5 exposure was 11.44 μg/m3 (1.12) among cases and 11.58 μg/m3 (0.85) among controls. Due to the lack of variability in estimated exposure to PM2.5, we excluded this pollutant from subsequent analyses.
Table 2.
Distribution of annual 8-h maximum O3 and 24-h average PM2.5 exposure estimates among Mexican-origin Hispanics N = 2468), Houston, Texas, 2007–2014
| Mean ± SD | 25th percentile | 50th percentile | 75th percentile | Range | |
|---|---|---|---|---|---|
| O3 (ppb) | |||||
| Cases | 35.45 ± 1.95 | 34.06 | 35.41 | 38.84 | 27.54–42.11 |
| Controls | 35.88 ± 2.04 | 34.56 | 36.07 | 37.25 | 23.77–43.97 |
| PM2.5 (μg/m3) | |||||
| Cases | 11.60 ± 0.92 | 10.94 | 11.44 | 12.06 | 9.51–14.88 |
| Controls | 11.77 ± 0.92 | 11.24 | 11.58 | 12.09 | 9.36–14.92 |
Table 3 presents adjusted associations between hypertension and sources of psychosocial stress. There was a positive association between both reporting high frequency of stress due to unfair or disrespectful treatment based on race, ethnicity, or immigration status (POR = 1.55, 95% CI [1.04–2.32]) as well as stress due to too much litter or trash in the neighborhood (POR = 1.48, 95% CI [1.06–2.07]) and hypertension. Lower odds of prevalent hypertension were observed among individuals experiencing medium (POR = 0.60, 95% CI [0.40–0.90]) and high (POR = 0.87, 95% CI [0.55–1.38]) levels of stress due to domestic violence.
Table 3.
Association between sources of psychosocial stressors and prevalent hypertension among Mexican-origin Hispanics (N = 2468) (missing observations are not shown) Houston, Texas, 2007–2014
| Stressor | Cases (n = 1135) | Controls (n = 1333) | POR1 | 95% CI | |
|---|---|---|---|---|---|
| Domestic violence | |||||
| Low | 1023 | 1196 | Ref | ||
| Medium | 58 | 85 | 0.60* | 0.40 | 0.90 |
| High | 54 | 52 | 0.87 | 0.55 | 1.38 |
| Problems with children | |||||
| Low | 582 | 728 | Ref | ||
| Medium | 249 | 352 | 1.03 | 0.82 | 1.31 |
| High | 279 | 249 | 1.17 | 0.92 | 1.49 |
| Caring for a sick family member | |||||
| Low | 788 | 1005 | Ref | ||
| Medium | 145 | 156 | 1.03 | 0.77 | 1.37 |
| High | 202 | 172 | 0.99 | 0.76 | 1.30 |
| Separated from family living elsewhere | |||||
| Low | 866 | 890 | Ref | ||
| Medium | 123 | 226 | 0.83 | 0.63 | 1.10 |
| High | 146 | 217 | 0.90 | 0.68 | 1.19 |
| Contact with authorities/law enforcement | |||||
| Low | 975 | 1112 | Ref | ||
| Medium | 99 | 147 | 0.80 | 0.59 | 1.10 |
| High | 61 | 74 | 0.73 | 0.49 | 1.10 |
| Unfair treatment/disrespect based on race, ethnicity or immigration status | |||||
| Low | 179 | 357 | Ref | ||
| Medium | 119 | 213 | 1.13 | 0.80 | 1.59 |
| High | 100 | 89 | 1.55* | 1.04 | 2.32 |
| Neighborhood noise | |||||
| Low | 898 | 1106 | Ref | ||
| Medium | 141 | 151 | 1.14 | 0.85 | 1.53 |
| High | 96 | 76 | 1.19 | 0.81 | 1.73 |
| Neighborhood traffic/construction | |||||
| Low | 749 | 884 | Ref | ||
| Medium | 208 | 272 | 0.99 | 0.77 | 1.26 |
| High | 178 | 177 | 1.09 | 0.82 | 1.43 |
| Neighborhood litter/trash | |||||
| Low | 871 | 1070 | Ref | ||
| Medium | 138 | 168 | 0.98 | 0.73 | 1.31 |
| High | 126 | 95 | 1.48* | 1.06 | 2.07 |
| Being safe in home or neighborhood | |||||
| Low | 716 | 850 | Ref | ||
| Medium | 255 | 340 | 0.99 | 0.79 | 1.24 |
| High | 164 | 143 | 1.21 | 0.90 | 1.62 |
| Unknown people hanging around the neighborhood | |||||
| Low | 788 | 922 | Ref | ||
| Medium | 209 | 289 | 0.92 | 0.72 | 1.17 |
| High | 138 | 122 | 1.17 | 0.85 | 1.61 |
| Violence at children’s school | |||||
| Low | 845 | 956 | Ref | ||
| Medium | 152 | 235 | 0.82 | 0.63 | 1.07 |
| High | 138 | 142 | 1.13 | 0.84 | 1.52 |
POR prevalent odds ratio; CI confidence interval
*p < 0.05 for associations between covariates and hypertension status
1Adjusted for age, sex, nativity, smoking, alcohol consumption, BMI and asthma
Table 4 presents adjusted associations between stress-related conditions and hypertension. There was a positive association between both a high frequency of feeling anxious or depressed (POR = 1.36, 95% CI [1.06–1.75]) and experiencing aches, pains or nausea (POR = 1.29, 95% CI [1.0–1.64]) and hypertension. The odds of having hypertension were also elevated among those with concerns about health (POR = 1.65, 95% CI [1.30–2.06]) or not having enough money (POR = 1.27, 95% CI [1.01–1.6]).
Table 4.
Associations between stress-related conditions and prevalent hypertension among Mexican-origin Hispanics (N = 2468), Houston, Texas, 2007–2014
| Stress-related condition | Cases (n = 1135) | Controls (n = 1333) | POR1 | 95% CI | |
|---|---|---|---|---|---|
| Anxiety/depression due to stress | |||||
| Low | 596 | 758 | Ref | ||
| Medium | 277 | 361 | 1.00 | 0.80 | 1.26 |
| High | 262 | 214 | 1.36* | 1.06 | 1.75 |
| Aches/pains/nausea due to stress | |||||
| Low | 594 | 754 | Ref | ||
| Medium | 255 | 333 | 1.05 | 0.83 | 1.33 |
| High | 286 | 246 | 1.29* | 1.01 | 1.64 |
| Trouble sleeping due to stress | |||||
| Low | 552 | 740 | Ref | ||
| Medium | 228 | 320 | 0.93 | 0.73 | 1.19 |
| High | 355 | 273 | 1.22 | 0.96 | 1.53 |
| Worrying about not having enough time for oneself | |||||
| Low | 566 | 594 | Ref | ||
| Medium | 226 | 360 | 0.80 | 0.63 | 1.02 |
| High | 343 | 379 | 0.96 | 0.77 | 1.20 |
| Worrying about one’s own health | |||||
| Low | 430 | 658 | Ref | ||
| Medium | 257 | 372 | 1.05 | 0.82 | 1.33 |
| High | 448 | 303 | 1.65* | 1.30 | 2.06 |
| Worrying about not having enough money | |||||
| Low | 450 | 518 | Ref | ||
| Medium | 302 | 451 | 1.06 | 0.84 | 1.35 |
| High | 383 | 364 | 1.27* | 1.01 | 1.60 |
POR prevalent odds ratio; CI confidence interval
*p < 0.05 for associations between covariates and hypertension status
1Adjusted for age, sex, nativity, smoking, alcohol consumption, BMI and asthma
Adjusted PORs (95% CIs) for the association between O3 exposure and hypertension were 0.89 (0.69–1.15), 0.44 (0.33–0.58), and 0.55 (0.42–0.72) for the second, third, and fourth quartiles of O3, respectively, as compared to the lowest quartile. Odds of hypertension decreased by a factor of 0.90 for each parts per billion increase in exposure to O3 (adjusted POR = 0.90, 95% CI [0.86–0.95]). There was no evidence of effect measure modification by psychosocial stress in the association between ozone and hypertension. These results did not change when using data from a single monitor to construct air pollution exposure estimates (data not shown). Further, the results from the mixed-effects models accounting for the correlation among individuals living in the same household were similar as well (Adjusted PORs (95% CIs) were 0.89 (0.68–1.15), 0.44 (0.33–0.59), and 0.55 (0.41–0.73) for the second, third and fourth quartiles of O3, respectively).
Discussion
We examined co-exposures to air pollution and psychosocial stress among an overburdened population, i.e., Mexican-origin Hispanics living in Houston, Texas. We observed elevated odds of prevalent hypertension with several conditions resulting from stress including feeling anxious or depressed, experiencing aches, pains, or nausea and having concerns about poor health and not having enough money. Additionally, we detected associations between hypertension and being unfairly treated or disrespected because of race ethnicity or immigration status and having too much litter and trash in the neighborhood. While we could not examine associations with PM2.5 because of too little variability in our exposure estimates, we found inverse associations between ozone exposure and hypertension.
In our study, experiencing a high level of stress-induced anxiety or depression was associated with a 36% increase in the odds of prevalent hypertension. Zambrana et al. reported similar associations between depression and prevalent hypertension among postmenopausal Hispanic women ages 50 and older [7]. In a meta-analysis, Meng et al. reported elevated risks of hypertension with depression, which increased with longer follow-up time [42]. We also found that a high level of stress from unfair or disrespectful treatment based on race, ethnicity or immigration status was positively associated with hypertension, which is consistent with the literature on perceived racial discrimination and hypertension [12–14]. In contrast, we observed that experiencing stress from domestic violence in the home resulted in lower odds of prevalent hypertension, which is similar to the inverse association reported previously between traumatic stressors (including physical or sexual assault) and hypertension [1].
We found an inverse association between 12-month averaged ozone exposure and prevalent hypertension. This finding is consistent with previous studies of short-term [29, 30] but not long-term exposure. Chuang et al. reported a 21.51-mmHg (95% CI [16.90–26.13]) change in systolic blood pressure and a 20.56-mmHg (95% CI [18.14–22.97]) change in diastolic blood pressure with an IQR increase of 8.95 ppb in 1-year averaged O3 concentrations among Taiwanese men and women ages 54 and older [27]. A study conducted in China found that an IQR increase of 22 μg/m3 (approximately 11 ppb) in 3-year averaged O3 concentrations increased the odds of prevalent hypertension (OR = 1.13, 95% CI [1.06–1.20]) [28]. In a study of black women in the U.S., Coogan et al. reported elevated risks of hypertension per IQR increase of 6.7 ppb of averaged O3 levels over 2 years (hazard ratio (HR) = 2.09, 95% CI [1.00–1.18]) [43]. The inconsistency between our findings and the results previously reported may be due to differences in the degree of variability in O3 exposure in our study population (IQR = 2.75 ppb), particularly, as compared to populations outside of the U.S.
Our study relied on prevalent cases of hypertension and was therefore unable to establish a temporal relationship between the exposures and the outcome. Further, the validity and accuracy of using self-reported hypertension have been evaluated with inconsistent results [44–49]. Hence, it will be important to evaluate the association of psychosocial stress and air pollution with incident hypertension when follow-up data become available in the Mexican-American Mano a Mano cohort. We constructed long-term estimates of O3 exposure based on the residential address of each participant using a relatively large air pollution database from stationary monitors in the study region. Thus, our exposure assessment likely captured spatial and temporal influences on outdoor air levels of ozone. Yet, the lack of equally distributed monitors in the study area may have introduced some error in our exposure assessment. Notwithstanding the complex and multi-dimensional aspects of stress that make it difficult to study, a strength of our study was in the use of mixed methods to assess exposure to psychosocial stressors.
Our study provides evidence of positive associations between multiple indicators of psychosocial stress in the family, social and neighborhood environments and hypertension in an ethnically homogenous population of Mexican-origin Hispanics. As CVD remains the leading cause of death among U.S. Hispanics, developing interventions that target some of these potentially modifiable sources of psychosocial stress may lead to improvements in cardiovascular health among this population.
Author Contributions
Elaine Symanski designed the study and provided oversight for all aspects of data collection, analysis and interpretation. Melissa Bondy and Sara Strom provided access to the Mano a Mano cohort. Sara Strom oversaw data collection via phone interviews and Maria Jimenez served as the liaison between the MD Anderson Cancer Center interviewers and UTHealth School of Public Health researchers. Wenyaw Chan provided oversight of the statistical analysis; Amal Rammah performed all analyses. Amal Rammah and Elaine Symanski drafted the manuscript and Kristina Whitworth, Inkyu Han, and Sara Strom offered revisions of the manuscript. All authors contributed to and approved the final version.
Funding
This work was supported by the U.S. Environmental Protection Agency (EPA) STAR grant (#83458101) and the National Institute of Occupational Safety and Health (NIOSH) Education and Research Center Grant (#5T42OH008421). The Mexican-American cohort study is partially supported by funds from the University of Texas MD Anderson Duncan Family Institute for Cancer Prevention and Risk Assessment and by funds collected pursuant to the Comprehensive Tobacco Settlement to the University of Texas MD Anderson Cancer Center. Funders had no role in the study design, data analysis or the preparation of the manuscript.
Conflict of Interest
The authors declare that they have no conflict of interest.
Ethical Approval
The Institutional Review Boards at MDACC and the University of Texas Health Science Center at Houston (UTHealth) approved the study and oral informed consent during phone interviews was obtained from all participants. All procedures performed in studies involving human participants were in accordance with the ethical standards of the institutional and/or national research committee and with the 1964 Helsinki declaration and its later amendments or comparable ethical standards.
References
- 1.Gallo LC, Roesch SC, Fortmann AL, Carnethon MR, Penedo FJ, Perreira K, Birnbaum-Weitzman O, Wassertheil-Smoller S, Castañeda SF, Talavera GA, Sotres-Alvarez D, Daviglus ML, Schneiderman N, Isasi CR. Associations of chronic stress burden, perceived stress, and traumatic stress with cardiovascular disease prevalence and risk factors in the Hispanic community health study/study of Latinos sociocultural ancillary study. Psychosom Med. 2014;76(6):468–475. doi: 10.1097/PSY.0000000000000069. [DOI] [PMC free article] [PubMed] [Google Scholar]
- 2.Cuffee Y, Ogedegbe C, Williams NJ, Ogedegbe G, Schoenthaler A. Psychosocial risk factors for hypertension: an update of the literature. Curr Hypertens Rep. 2014;16(10):483. doi: 10.1007/s11906-014-0483-3. [DOI] [PMC free article] [PubMed] [Google Scholar]
- 3.Esler M. Mental stress and human cardiovascular disease. Neurosci Biobehav Rev. 2017;74(Pt B):269–276. doi: 10.1016/j.neubiorev.2016.10.011. [DOI] [PubMed] [Google Scholar]
- 4.Spruill TM. Chronic psychosocial stress and hypertension. Curr Hypertens Rep. 2010;12(1):10–16. doi: 10.1007/s11906-009-0084-8. [DOI] [PMC free article] [PubMed] [Google Scholar]
- 5.Ushakov AV, Ivanchenko VS, Gagarina AA. Psychological stress in pathogenesis of essential hypertension. Curr Hypertens Rev. 2016; [DOI] [PubMed]
- 6.Statistical Fact Sheet—Populations . Hispanics/Latinos and cardiovascular diseases—Statistics. Dallas: American Heart Association; 2016. [Google Scholar]
- 7.Zambrana RE, Lopez L, Dinwiddie GY, Ray RM, Eaton CB, Phillips LS, et al. Association of baseline depressive symptoms with prevalent and incident pre-hypertension and hypertension in postmenopausal Hispanic women: results from the Women’s health initiative. PLoS One. 2016;11(4):e0152765. doi: 10.1371/journal.pone.0152765. [DOI] [PMC free article] [PubMed] [Google Scholar]
- 8.Eamranond PP, Legedza AT, Diez-Roux AV, Kandula NR, Palmas W, Siscovick DS, et al. Association between language and risk factor levels among Hispanic adults with hypertension, hypercholesterolemia, or diabetes. Am Heart J. 2009;157(1):53–59. doi: 10.1016/j.ahj.2008.08.015. [DOI] [PMC free article] [PubMed] [Google Scholar]
- 9.Lopez L, Peralta CA, Lee A, Zeki Al Hazzouri A, Haan MN. Impact of acculturation on cardiovascular risk factors among elderly Mexican Americans. Ann Epidemiol. 2014;24(10):714–719. doi: 10.1016/j.annepidem.2014.07.011. [DOI] [PMC free article] [PubMed] [Google Scholar]
- 10.Rodriguez CJ, Allison M, Daviglus ML, Isasi CR, Keller C, Leira EC, Palaniappan L, Piña IL, Ramirez SM, Rodriguez B, Sims M, American Heart Association Council on Epidemiology and Prevention. American Heart Association Council on Clinical Cardiology. American Heart Association Council on Cardiovascular and Stroke Nursing Status of cardiovascular disease and stroke in Hispanics/Latinos in the United States: a science advisory from the American Heart Association. Circulation. 2014;130(7):593–625. doi: 10.1161/CIR.0000000000000071. [DOI] [PMC free article] [PubMed] [Google Scholar]
- 11.Rodriguez F, Hicks LS, Lopez L. Association of acculturation and country of origin with self-reported hypertension and diabetes in a heterogeneous Hispanic population. BMC Public Health. 2012;12:768. doi: 10.1186/1471-2458-12-768. [DOI] [PMC free article] [PubMed] [Google Scholar]
- 12.Dolezsar CM, McGrath JJ, Herzig AJ, Miller SB. Perceived racial discrimination and hypertension: a comprehensive systematic review. Health Psychol: Off J Div Health Psychol, Am Psychol Assoc. 2014;33(1):20–34. doi: 10.1037/a0033718. [DOI] [PMC free article] [PubMed] [Google Scholar]
- 13.Hicken MT, Lee H, Morenoff J, House JS, Williams DR. Racial/ethnic disparities in hypertension prevalence: reconsidering the role of chronic stress. Am J Public Health. 2014;104(1):117–123. doi: 10.2105/AJPH.2013.301395. [DOI] [PMC free article] [PubMed] [Google Scholar]
- 14.LeBron AMW, Schulz AJ, Mentz G, Reyes AG, Gamboa C, Israel BA, et al. Impact of change over time in self-reported discrimination on blood pressure: implications for inequities in cardiovascular risk for a multi-racial urban community. Ethnicity Health. 2018:1–19. 10.1080/13557858.2018.1425378. [DOI] [PMC free article] [PubMed]
- 15.Brook RD, Rajagopalan S, Pope CA, 3rd, Brook JR, Bhatnagar A, Diez-Roux AV, et al. Particulate matter air pollution and cardiovascular disease: an update to the scientific statement from the American Heart Association. Circulation. 2010;121(21):2331–2378. doi: 10.1161/CIR.0b013e3181dbece1. [DOI] [PubMed] [Google Scholar]
- 16.Cai Y, Zhang B, Ke W, Feng B, Lin H, Xiao J, Zeng W, Li X, Tao J, Yang Z, Ma W, Liu T. Associations of short-term and long-term exposure to ambient air pollutants with hypertension: a systematic review and meta-analysis. Hypertension. 2016;68(1):62–70. doi: 10.1161/HYPERTENSIONAHA.116.07218. [DOI] [PubMed] [Google Scholar]
- 17.Franklin BA, Brook R, Arden Pope C., 3rd Air pollution and cardiovascular disease. Curr Probl Cardiol. 2015;40(5):207–238. doi: 10.1016/j.cpcardiol.2015.01.003. [DOI] [PubMed] [Google Scholar]
- 18.Giorgini P, Di Giosia P, Grassi D, Rubenfire M, Brook RD, Ferri C. Air pollution exposure and blood pressure: an updated review of the literature. Curr Pharm Des. 2016;22(1):28–51. doi: 10.2174/1381612822666151109111712. [DOI] [PubMed] [Google Scholar]
- 19.Gold DR, Mittleman MA. New insights into pollution and the cardiovascular system: 2010 to 2012. Circulation. 2013;127(18):1903–1913. doi: 10.1161/CIRCULATIONAHA.111.064337. [DOI] [PubMed] [Google Scholar]
- 20.Kelly FJ. Oxidative stress: its role in air pollution and adverse health effects. Occup Environ Med. 2003;60(8):612–616. doi: 10.1136/oem.60.8.612. [DOI] [PMC free article] [PubMed] [Google Scholar]
- 21.Coogan PF, White LF, Jerrett M, Brook RD, Su JG, Seto E, Burnett R, Palmer JR, Rosenberg L. Air pollution and incidence of hypertension and diabetes mellitus in black women living in Los Angeles. Circulation. 2012;125(6):767–772. doi: 10.1161/CIRCULATIONAHA.111.052753. [DOI] [PMC free article] [PubMed] [Google Scholar]
- 22.Du Y, Xu X, Chu M, Guo Y, Wang J. Air particulate matter and cardiovascular disease: the epidemiological, biomedical and clinical evidence. J Thorac Dis. 2016;8(1):E8–e19. doi: 10.3978/j.issn.2072-1439.2015.11.37. [DOI] [PMC free article] [PubMed] [Google Scholar]
- 23.Liang R, Zhang B, Zhao X, Ruan Y, Lian H, Fan Z. Effect of exposure to PM2.5 on blood pressure: a systematic review and meta-analysis. J Hypertens. 2014;32(11):2130–2140. doi: 10.1097/HJH.0000000000000342. [DOI] [PubMed] [Google Scholar]
- 24.Zhang Z, Laden F, Forman JP, Hart JE. Long-term exposure to particulate matter and self-reported hypertension: a prospective analysis in the Nurses’ health study. Environ Health Perspect. 2016;124:1414–1420. doi: 10.1289/EHP163. [DOI] [PMC free article] [PubMed] [Google Scholar]
- 25.Brook RD, Kousha T. Air pollution and emergency department visits for hypertension in Edmonton and Calgary, Canada: a case-crossover study. Am J Hypertens. 2015;28(9):1121–1126. doi: 10.1093/ajh/hpu302. [DOI] [PubMed] [Google Scholar]
- 26.Chuang KJ, Yan YH, Cheng TJ. Effect of air pollution on blood pressure, blood lipids, and blood sugar: a population-based approach. J Occup Environ Med / Am Coll Occup Environ Med. 2010;52(3):258–262. doi: 10.1097/JOM.0b013e3181ceff7a. [DOI] [PubMed] [Google Scholar]
- 27.Chuang KJ, Yan YH, Chiu SY, Cheng TJ. Long-term air pollution exposure and risk factors for cardiovascular diseases among the elderly in Taiwan. Occup Environ Med. 2011;68(1):64–8. 10.1136/oem.2009.052704. [DOI] [PubMed]
- 28.Dong GH, Qian ZM, Xaverius PK, Trevathan E, Maalouf S, Parker J, Yang L, Liu MM, Wang D, Ren WH, Ma W, Wang J, Zelicoff A, Fu Q, Simckes M. Association between long-term air pollution and increased blood pressure and hypertension in China. Hypertension. 2013;61(3):578–584. doi: 10.1161/HYPERTENSIONAHA.111.00003. [DOI] [PubMed] [Google Scholar]
- 29.Hoffmann B, Luttmann-Gibson H, Cohen A, Zanobetti A, de Souza C, Foley C, Suh HH, Coull BA, Schwartz J, Mittleman M, Stone P, Horton E, Gold DR. Opposing effects of particle pollution, ozone, and ambient temperature on arterial blood pressure. Environ Health Perspect. 2012;120(2):241–246. doi: 10.1289/ehp.1103647. [DOI] [PMC free article] [PubMed] [Google Scholar]
- 30.Szyszkowicz M, Rowe BH, Brook RD. Even low levels of ambient air pollutants are associated with increased emergency department visits for hypertension. The Can J Cardiol. 2012;28(3):360–366. doi: 10.1016/j.cjca.2011.06.011. [DOI] [PubMed] [Google Scholar]
- 31.Cuevas AG, Williams DR, Albert MA. Psychosocial factors and hypertension: a review of the literature. Cardiol Clin. 2017;35(2):223–230. doi: 10.1016/j.ccl.2016.12.004. [DOI] [PMC free article] [PubMed] [Google Scholar]
- 32.Bangia KS, Symanski E, Strom SS, Bondy M. A cross-sectional analysis of polycyclic aromatic hydrocarbons and diesel particulate matter exposures and hypertension among individuals of Mexican origin. Environ Health: Glob Access Sci Source. 2015;14:51. doi: 10.1186/s12940-015-0039-2. [DOI] [PMC free article] [PubMed] [Google Scholar]
- 33.Chakraborty J, Collins TW, Grineski SE, Montgomery MC, Hernandez M. Comparing disproportionate exposure to acute and chronic pollution risks: a case study in Houston, Texas. Risk Anal: Off Publ Soc Risk Anal. 2014;34(11):2005–2020. doi: 10.1111/risa.12224. [DOI] [PubMed] [Google Scholar]
- 34.Collins TW, Grineski SE, Chakraborty J, Montgomery MC, Hernandez M. Downscaling environmental justice analysis: determinants of household-level hazardous air pollutant exposure in greater Houston. Ann Assoc Am Geogr. 2015;105(4):684–703. [Google Scholar]
- 35.Han I, Guo Y, Afshar M, Stock TH, Symanski E. Comparison of trace elements in size-fractionated particles in two communities with contrasting socioeconomic status in Houston, TX. Environ Monit Assess. 2017;189(2):67. doi: 10.1007/s10661-017-5780-2. [DOI] [PMC free article] [PubMed] [Google Scholar]
- 36.Pastor M, Morello-Frosch R. Integrating public health and community development to tackle neighborhood distress and promote well-being. Health Affairs (Project Hope) 2014;33(11):1890–1896. doi: 10.1377/hlthaff.2014.0640. [DOI] [PubMed] [Google Scholar]
- 37.Sadd JL, Pastor M, Morello-Frosch R, Scoggins J, Jesdale B. Playing it safe: assessing cumulative impact and social vulnerability through an environmental justice screening method in the South Coast Air Basin, California. Int J Environ Res Public Health. 2011;8(5):1441–1459. doi: 10.3390/ijerph8051441. [DOI] [PMC free article] [PubMed] [Google Scholar]
- 38.Chow WH, Chrisman M, Daniel CR, Ye Y, Gomez H, Dong Q, Anderson CE, Chang S, Strom S, Zhao H, Wu X. Cohort profile: the Mexican American Mano a Mano cohort. Int J Epidemiol. 2017;46(2):e3. doi: 10.1093/ije/dyv016. [DOI] [PMC free article] [PubMed] [Google Scholar]
- 39.Symanski E, Karpman M, Jimenez M, Lopez DS, Felknor SA, Upadhyaya M, Strom SS, Bondy ML. Using a community-engaged approach to develop a bilingual survey about psychosocial stressors among individuals of Mexican origin. J Health Care Poor Underserved. 2015;26(4):1456–1471. doi: 10.1353/hpu.2015.0136. [DOI] [PMC free article] [PubMed] [Google Scholar]
- 40.Waller LA, Gotway CA. Applied spatial statistics for public health data. Wiley; 2004.
- 41.Rothman KJ, Greenland S, Lash TL. Modern epidemiology. Lippincott Williams & Wilkins; 2008.
- 42.Meng L, Chen D, Yang Y, Zheng Y, Hui R. Depression increases the risk of hypertension incidence: a meta-analysis of prospective cohort studies. J Hypertens. 2012;30(5):842–851. doi: 10.1097/HJH.0b013e32835080b7. [DOI] [PubMed] [Google Scholar]
- 43.Coogan PF, White LF, Yu J, Brook RD, Burnett RT, Marshall JD, Bethea TN, Rosenberg L, Jerrett M. Long-term exposure to NO2 and ozone and hypertension incidence in the Black women’s health study. Am J Hypertens. 2017;30(4):367–372. doi: 10.1093/ajh/hpw168. [DOI] [PMC free article] [PubMed] [Google Scholar]
- 44.Goldman N, Lin IF, Weinstein M, Lin YH. Evaluating the quality of self-reports of hypertension and diabetes. J Clin Epidemiol. 2003;56(2):148–154. doi: 10.1016/s0895-4356(02)00580-2. [DOI] [PubMed] [Google Scholar]
- 45.Mentz G, Schulz AJ, Mukherjee B, Ragunathan TE, Perkins DW, Israel BA. Hypertension: development of a prediction model to adjust self-reported hypertension prevalence at the community level. BMC Health Serv Res. 2012;12:312. doi: 10.1186/1472-6963-12-312. [DOI] [PMC free article] [PubMed] [Google Scholar]
- 46.Ning M, Zhang Q, Yang M. Comparison of self-reported and biomedical data on hypertension and diabetes: findings from the China health and retirement longitudinal study (CHARLS) BMJ Open. 2016;6(1):e009836. doi: 10.1136/bmjopen-2015-009836. [DOI] [PMC free article] [PubMed] [Google Scholar]
- 47.Peterson KL, Jacobs JP, Allender S, Alston LV, Nichols M. Characterising the extent of misreporting of high blood pressure, high cholesterol, and diabetes using the Australian health survey. BMC Public Health. 2016;16:695. doi: 10.1186/s12889-016-3389-y. [DOI] [PMC free article] [PubMed] [Google Scholar]
- 48.Sorensen M, Hoffmann B, Hvidberg M, Ketzel M, Jensen SS, Andersen ZJ, et al. Long-term exposure to traffic-related air pollution associated with blood pressure and self-reported hypertension in a Danish cohort. Environ Health Perspect. 2012;120(3):418–424. doi: 10.1289/ehp.1103631. [DOI] [PMC free article] [PubMed] [Google Scholar]
- 49.White K, Avendano M, Capistrant BD, Robin Moon J, Liu SY, Maria GM. Self-reported and measured hypertension among older US- and foreign-born adults. J Immigr Minor Health. 2012;14(4):721–726. doi: 10.1007/s10903-011-9549-3. [DOI] [PubMed] [Google Scholar]