Significance
This paper reports on colloid experiments that provide a unique 3D experimental view at the particle level of the fundamental mechanism by which liquids crystallize and crystals melt. Since these mechanisms cannot be observed directly in atomic systems, the colloids serve as models to identify, for example, the equivalent of the often-invoked collision-limited growth of pure crystals. Other observations include the measurement of equal mobilities for growth and melting and the mobility of the body-centered cubic interface being greater than that of the face-centered cubic one.
Keywords: kinetics, crystallization, melting, colloids, phase transformation
Abstract
We study the kinetics of crystal growth and melting of two types of colloidal crystals: body-centered cubic (BCC) crystals and face-centered cubic (FCC) crystals. A dielectrophoretic “electric bottle” confines colloids, enabling precise control of the motion of the interface. We track the particle motion, and by introducing a structural order parameter, we measure the jump frequencies of particles to and from the crystal and determine from these the free-energy difference between the phases and the interface mobility. We find that the interface is rough in both BCC and FCC cases. Moreover, the jump frequencies correspond to those expected from the random walk of the particles, which translates to collision-limited growth in metallic systems. The mobility of the BCC interface is greater than that of the FCC interface. In addition, contrary to the prediction of some early computer simulations, we show that there is no significant asymmetry between the mobilities for crystallization and melting.
Crystallization (solidification) and melting are among the most studied phenomena for both fundamental and technological reasons. Although there is an impressive body of macroscopic and thermodynamic data on these phenomena, direct observation of the transformations at the atomic level remains elusive, because the presence of two condensed phases inhibits any probe of individual atomic movements at the interface. One of the questions that could be addressed by such observations, for example, is that of the ultimate growth velocity. It has been proposed (1), based on measurements of velocity vs. undercooling (2), that the attachment rate of liquid atoms to a growing pure metallic crystal is collision limited (i.e., close to the interatomic vibration frequency). In that case, the ultimate growth velocity would approach the velocity of sound. Should the growth be, in part, diffusion limited (i.e., involve major switches of nearest neighbors), the ultimate velocity would be much lower. The answer to this question is of interest, for example, in evaluating the possibility of forming pure metallic glasses (3). Computer simulations have shed some light on this (4, 5), but a direct investigation on the atomic level is still lacking. Another question that would benefit from direct investigation is the possibility of the mobility for melting being different from that for crystallization, which has been claimed in some simulations (6, 7) and dismissed by later ones (8). There is, however, a way to probe the melting and crystallization behavior on an actual physical system: dense colloidal suspensions form liquid and crystalline phases that are structurally identical to the simple atomic ones, such as metals, but the size (m) and slowness of the particles allow them to be tracked individually in the confocal microscope.
Results
Colloidal suspensions and atomic systems exhibit similar phases, in which, for colloids, the particle concentration is a key parameter in the phase behavior (9). The growth of colloidal crystals from their liquid has been studied under conditions of nucleation (10) or sedimentation (11), but a detailed study of the crystallization and melting kinetics requires closer control of the interface position. A powerful tool to this end is the control of the particle density through dielectrophoresis. Sullivan and coworkers (12, 13) demonstrated how dielectrophoresis can be used to manipulate particles in a confined system in a device that they labeled an “electric bottle.” This technique provides better control of concentration than other body forces, such as gravity or temperature gradients (14, 15).
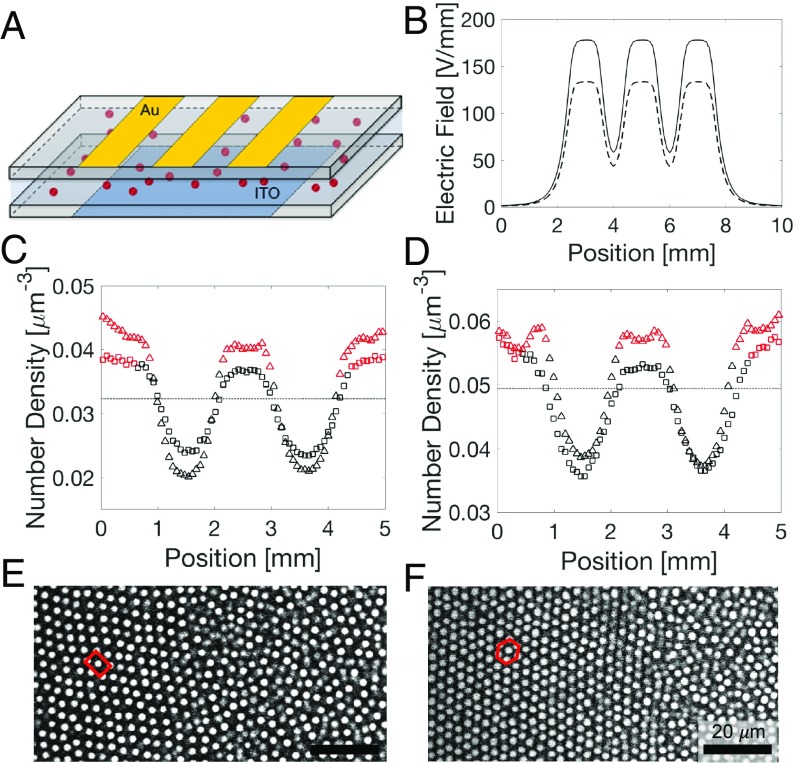
The electric bottle, shown in Fig. 1A with details in SI Appendix, is a capacitor that contains the colloidal suspension as a dielectric spacer. In an electric field, particles with a dielectric constant in a medium with a dielectric constant acquire an induced dipole moment . Dielectrophoresis occurs, because the electric field gradient , shown in Fig. 1B, exerts a force on the induced dipole moment , with , , and the volume fraction of the particles (12, 16, 17). In a sealed electric bottle system, the system reaches equilibrium when all dielectric forces are balanced by the osmotic pressure forces from the density gradients. This corresponds to the chemical potential, including both electrical and chemical contributions, being uniform throughout the system (18).
Fig. 1.
Spatial distribution of particles in an electric bottle. (A) Schematic drawing of the electric bottle. (B) Calculated electric field profile at the center plane at 60 V (dashed line) and 80 V (solid line). (C and D) Particle concentration profile at dielectrophoretic equilibrium. (red, crystalline; black, liquid; squares, 60 V; triangles, 80 V; dashed line, original density). (C) The 15 mM AOT suspension forms BCC crystals. (D) The 5 mM AOT suspension forms FCC crystals. (E and F) Confocal images of a crystal–liquid interface taken at the center of the cell. (E) BCC with (110) parallel to the electrode and the BCC–liquid interface perpendicular to the [113] direction. (F) FCC with (111) parallel to the electrode and the FCC–liquid interface perpendicular to the [541] direction.
The colloidal suspension consists of 1.8-m diameter poly(methyl methacrylate) (PMMA) particles sterically stabilized with poly(hydroxystearic acid) brushes. The particles are suspended in a nonpolar solvent that is a mixture of 60 vol/vol decahydronaphtalene (cis-decalin) and 40 vol/vol tetrachloroethylene. We chose this solvent to closely match both the refractive index of the particles (to minimize scattering in confocal microscopy) and their density (to avoid sedimentation). The interaction between the particles is repulsive as a result of the addition of dioctyl sodium sulfosuccinate (AOT) (SI Appendix). By adjusting the AOT concentration, the particles can be made to crystallize in the face-centered cubic (FCC) or body-centered cubic (BCC) phase (19, 20). The PMMA colloidal particles are more polarizable ( 2.6) than the suspending medium ( 2.3); hence, they move toward stronger electric fields.
The spatial distributions of particles in 15 and 5 mM AOT suspensions are shown in Fig. 1 C and D, respectively (SI Appendix, Fig. S1). We took 3D confocal image stacks at 100-m intervals across the entire width of the cell. The number density was measured by counting the number of particles obtained from the particle-locating image analysis (21). The initial uniform number densities of the 15 and 5 mM suspensions are = 0.032 m−3 and = 0.050 m−3, respectively. The density increases in the high-electric field region during dielectrophoretic compression, resulting in the formation of crystals: BCC crystals in the 15 mM suspension at = 0.036 m−3 and FCC crystals in the 5 mM suspension at = 0.054 m−3. In the latter, crystallization occurs at a volume fraction of = 0.165, much lower than the = 0.494 in the case of hard spheres. This illustrates the effect of the longer-range potential (22). The equilibrated crystal–liquid interfaces of the BCC and FCC are shown in Fig. 1 E and F, respectively.
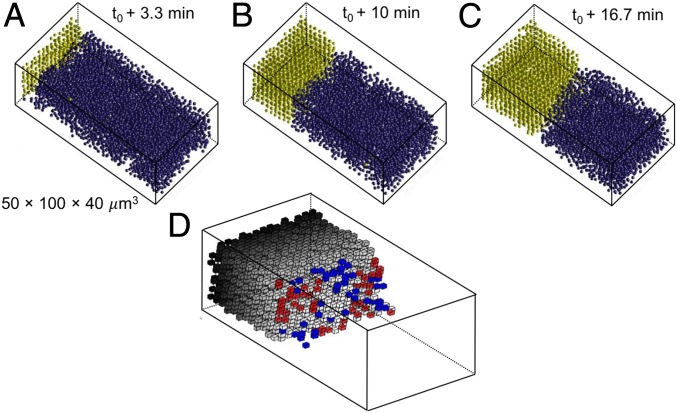
To study the kinetics of the interface motion during crystallization or melting, the cell was first equilibrated at voltage, resulting in a stationary interface. The voltage was then switched off, which resulted in melting; after 10 min, the voltage was switched on again, which reversed the interface motion and let us observe crystallization. Images 100 40 (512 161 pixels) in size were taken every 4 s near the middle of the cell to exclude possible effects of the glass surface,* and the individual particles were tracked in time and space. Dielectrophoretic compression initiates crystal growth under the electrodes, and melting starts when we switch off the electric field and the system relaxes back to the original fluid phase. The orientations of the BCC and FCC crystals are given in Fig. 1 E and F. Movies S1 and S2 show the motion of these interfaces during crystal growth; 3D reconstructions of the crystalline and liquid phases are shown in Fig. 2 A–C. We identify the crystal and liquid phases by assigning an order parameter to each particle. The bond orientation order parameter of particle is defined by the orientation of its nearest neighbor bonds. Here, we use the number of inline nearest neighbor particle pairs [i.e., bonds that make angles of (cos = −1 ± 0.055) (23)]. The order parameter in a perfect BCC crystal is seven (14 neighbors: 8 nearest and 6 next nearest), and it is six for a perfect FCC (12 nearest neighbors). We classify particles with 3.5, 3 as crystalline, and all others as liquid. The successive images in Fig. 2 A–C show how a BCC crystal grows during dielectrophoretic compression until equilibrium is reached.
Fig. 2.
Growth of a BCC crystal from the liquid. (A–C) Reconstructed images of the crystallization process, where yellow particles are crystalline and blue particles are liquid. (D) Identification over one imaging interval of 4 s of attachment (red) and detachment (blue) sites at the crystal boundary with the liquid. The interface particles have been removed for clarity.
The tracking of the particles allows us to determine the rates at which particles attach to or detach from the crystal interface, which can be denoted by jump frequencies, and , both in and out of equilibrium. To identify the attaching and detaching particles, we adopt an additional parameter , the number of crystal neighbors (24). The number of crystal particles that surround a particle, , depends on the region (crystal, interface, or liquid) to which it belongs. When a particle jumps to attach to or detach from the interface, its number of crystal bonds changes. Liquid particles ( 3.5, 3) with a large number of crystalline neighbors (3 6, 2 4) are considered “interfacial” particles, and the remaining ones ( 2, 1) are considered “liquid.” A change from liquid to interfacial at successive measuring times signifies attachment, and conversely, a change from interfacial to liquid signifies detachment. If a particle remains at the interface and keeps its identity as interfacial, it is identified as an interface particle. Fig. 2D visualizes the attachment and detachment sites at equilibrium. As the figure shows, attachment and detachment occur randomly at a rough interface without facet formation.
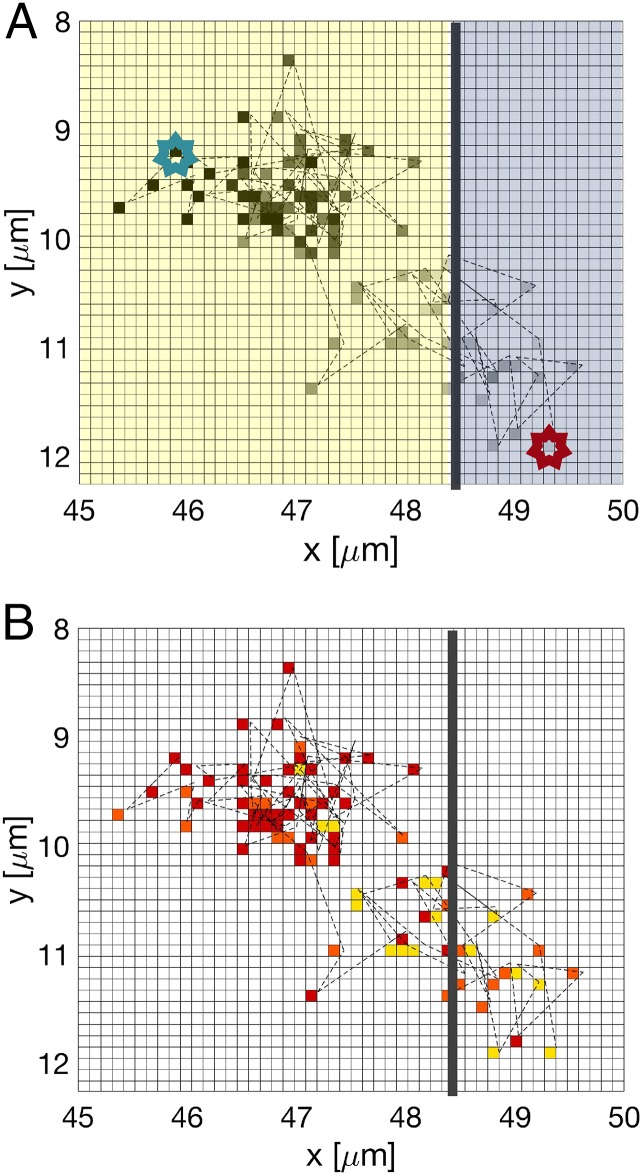
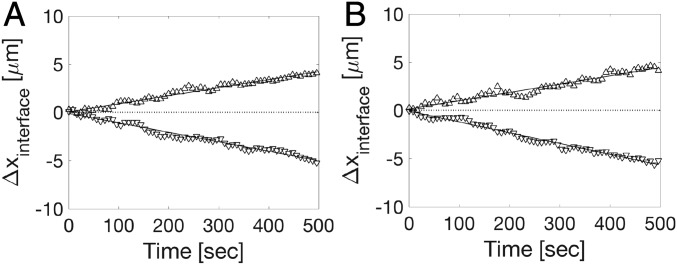
The jump frequencies (, ) are obtained by counting the total number of attachment and detachment events in a time interval of 4 s and dividing by the time and the number of potential jump sites at the interface.† We estimate the latter as , where is the average volume of the particles in the crystal (equal to the average Voronoi cells in SI Appendix, Table S1), A = 1,200 is the cross-sectional interface area, and is the particle dimension along the growth direction. The imaging interval of 4 s is sufficiently short for each observation of a jump to represent a single event. The results are listed in Table 1. At equilibrium, the attachment and detachment rates are equal (), while for crystallization, , and for melting, . The average jump distances for attachment and detachment at equilibrium were measured to be 0.83 0.01 and 0.76 0.01 m for BCC and FCC, respectively. Note that these jump distances are significantly shorter than the interparticle spacings (SI Appendix, Table S2). In other words, a small adjustment in the position of the particle changes its nature between crystalline and liquid and thereby, moves the interface locally by a much larger distance . A 2D projection of the trajectory of a single particle near the interface in equilibrium is shown in Fig. 3. It shows the particle first jumping back and forth between crystal and liquid, making a quasirandom walk. After the particle attaches itself to the crystal, it is trapped for a time. The changing positions of BCC– and FCC–liquid interfaces during growth and melting are shown in Fig. 4. The interface velocities were determined by measuring the total length of the crystal directly on the cell once every 8 s. The resulting “macroscopic” velocities are listed in Fig. 4. The “microscopic” interface velocities are obtained from the measured net jump rates. When liquid particles join the crystal, each attaching particle adds a volume to crystal. When particles join, the interface moves by with . The microscopic interface velocity is then
| [1] |
Table 1.
Average rates of attachment and detachment at the interfaces
| Jump rate, | BCC | FCC |
| Equilibrium | ||
| Growth | ||
| Melting | ||
Fig. 3.
A 2D projection of the trajectory of a particle near the BCC–liquid interface at equilibrium. (A) The color gradient of the pixels encodes points along a particle trajectory (red star, starting point; blue star, end point). The average position of the crystal–liquid interface is shown by the dotted line; the crystalline and liquid areas are yellow and blue, respectively. (B) A map of the particle identity (yellow, liquid; orange, interface; red, crystalline) along its trajectory.
Fig. 4.
Change in interface position during crystallization and melting. , crystal growth when the voltage is stepped from 0 to 80 V; , crystal melting when the voltage is stepped from 80 to 0 V. (A) BCC–liquid interface ( = 0.0087 0.0006 m/s, = −0.0118 0.0013 m/s). (B) FCC–liquid interface ( = 0.0084 0.0004 m/s, = −0.0099 0.0005 m/s).
Using the values of the jump rates, from Table 1, we obtain microscopic velocities: = 0.0081 0.0056 m/s and = −0.0120 0.0058 m/s for the BCC interface and = 0.0089 0.0037 m/s and = −0.0099 0.0039 m/s for the FCC interface. The close agreement between the macroscopic and microscopic interface velocities validates the choices that we made in defining the order parameters and the attachment/detachment criteria. To check if the magnitude of the electric field has any effect on the jump frequencies and growth velocities, we established that identical results could be obtained at 60 and 80 V (SI Appendix, Figs. S2 and S3).
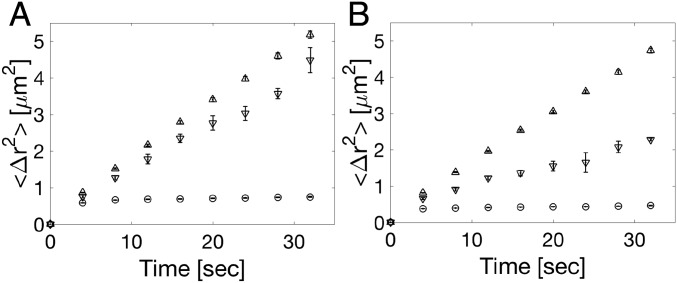
The jump frequency of an atom in a singly activated process can be written as , in which is an attempt frequency and is an activation energy. In some cases, such as pure metals or noble gases, the mechanism is thought to be collision limited, which corresponds to the absence of an activation barrier and hence, . Evidence for this type of growth includes measurements of the growth speed as a function of temperature (1, 25, 26). To establish the attempt frequency in our experiments, we investigated the Brownian motion of the particles in the crystal, interface, and liquid at equilibrium. We determined the mean square displacements (MSDs) of the particles, which are plotted as a function of time in Fig. 5. The MSD of the crystal particles saturates at = 0.72 and = 0.44 due to confinement by their lattice cages, while particles at the interface and in the liquid have diffusive motion, which is evident from the linearly increasing MSD. That the MSD of interfacial particles is less than that in the liquid is the result of their partial constraint by the crystal. A least squares linear fit to the liquid data gives diffusion coefficients of 0.0264 0.0010 and 0.0239 0.0011 /s for BCC and FCC, respectively. The attempt frequency, , is the inverse of the average time that it takes a particle to travel the jump distance, . The attempt frequency for Brownian motion in three dimensions is , which using the average measured values for mentioned above, gives 0.23 0.01 and 0.25 0.01 s−1 for BCC and FCC, respectively; these values are factors of two and three, respectively, greater than the jump frequencies for attachment and detachment listed in Table 1. Given that the attachment and detachment jumps have a pronounced directionality (SI Appendix, Figs. S4–S6) and therefore, cover only a fraction of the full 3D solid angle, we can say that the particles move freely by Brownian across the phase boundary. Such barrier-free motion corresponds to collision-limited growth in atomic systems.
Fig. 5.
MSD as a function of time for particles in the crystal (), interface (), and liquid (). (A) BCC. (B) FCC.
The motion of the phase boundary is then the result of a biased 1D random walk driven by the difference in free energy, , between the two phases. An analysis of the jump frequencies in a biased random walk (see Appendix) gives an expression for this free-energy difference:
| [2] |
The results are listed in Table 2.
Table 2.
Driving forces of crystal growth and melting for BCC and FCC crystals
| Driving force, (kBT per particle) | Growth | Melting |
| BCC crystals | ||
| FCC crystals |
A key phenomenological quantity in the kinetics of phase transformations is the mobility, , which is the ratio of the interface velocity, , to the gradient of the free energy, : . The interface velocity is related to the jump frequencies by Eq. 1: with . The free-energy gradient is established over a distance , the average component of the jumps normal to the interface (here taken to be ), so that . Specific values of for the two structures are 0.43 0.01 and 0.39 0.01 m for BCC and FCC, respectively. Using the above expression for , the mobility becomes
| [3] |
The results are shown in Table 3. The mobilities of the BCC–liquid interface are greater than those of the FCC–liquid interface in qualitative agreement with computer simulations on Fe, for which interfaces of the melt with both types of crystals can be created with the same potential (8). Furthermore, in contrast to earlier simulations (6, 7) and in agreement with more recent ones (8), we find no significant asymmetry in mobility between melting and crystallization for either FCC or BCC.
Table 3.
Mobilities of the BCC and FCC crystal–liquid interface during growth and melting
| Interface mobility, (107 m2/J⋅s) | BCC crystals | FCC crystals |
| Equilibrium | ||
| Growth | ||
| Melting |
Discussion
We observe that the interfaces are not faceted but rough. This holds for interfaces in equilibrium as well as during melting and crystallization. This roughness is dynamic, and the analysis of the fluctuations in the position of an interface at equilibrium allows determination of the interfacial stiffness (18). Furthermore, each site of this rough interface is a potential site for attachment and detachment of particles. In the solidification literature, this is expressed by the site factor being unity (27).
The rates of the attachment and detachment jumps correspond to those expected from the Brownian motion of the particles in the liquid. In other words, the time that it takes for a particle to reach its position in the other phase corresponds to the minimum time expected from its random walk. This translates to the atomic scale as collision-limited or barrier-free growth: the frequency of attachment or detachment is the highest that it can be (i.e., the local atomic vibration frequency). This corresponds to a maximum solidification velocity at high driving force where the reverse flux is suppressed, equal to the speed of sound.
The barrier-free growth observed in our experiments supports the pure collision–control model that was found to apply to fast dendrite growth of pure nickel (1) and solidification after pulsed laser melting of pure gold (25). We do not find evidence for an additional diffusion barrier, such as the one introduced in the modeling of pulsed laser melting experiments on silver (26).
Since the particles move freely across the phase boundary by Brownian motion, displacement of the boundary corresponds to a biased random walk where the bias is the result of the difference in free energy between the two phases, which in turn, results from the density gradient created in the electric bottle. This free-energy difference can be obtained from the difference between the forward and backward jump rates (Eq. 2). This method, based on the structural identification of the phase identity of the particles, may prove useful for analyzing the result of other experiments or simulations. The only colloid crystallization experiments in which free-energy differences were deduced from the growth rate were made on soft poly(N-isopropylacrylamide) particles in a temperature gradient (28). Their value (0.41 per particle) was an order of magnitude greater than ours (Table 2), which is most likely the result of a different interaction potential and a much higher packing fraction in that experiment. We do believe, however, that our method of determining the free-energy difference from a direct analysis of structure-based jump rates is more accurate than their application of the simple Wilson–Frenkel growth law (29, 30).
Finally, we extract the mobility of the interface from the structure-based jump rates. Based on microscopic reversibility, one expects the mobilities for crystallization and melting to be the same. When they are not, this is due to the finite size of the system where, for example, the crystal ledge nucleation frequency at the interface may play a role (31). For the rough interface in these experiments, however, microscopic reversibility is expected and indeed, found for both the BCC and the FCC interfaces. This is in line with the most recent simulation results (8), which contradicted earlier findings of asymmetry (6, 7).
These measurements provide a direct view of the particle-level dynamics and behavior of crystallization and melting at a crystal–fluid interface in a colloidal system. The observed behavior provides an experimental test of computer simulations and yields insight into the properties of atomic systems that are not otherwise accessible experimentally.
Materials and Methods
The sample cell (Fig. 1A) consists of two coverslips (22 22 ) separated by a spacer (200 m). The top plate has three 1-mm-wide gold electrodes separated by 1 mm. The bottom plate is a continuous indium tin-oxide electrode. We apply an ac voltage across the electrodes at a frequency of 1 MHz. The calculated electric field profiles in the center plane between the plates at 60 and 80 V are shown in Fig. 1B.
Appendix: Driving force for the biased random walk (32)
A particle with a mass has a Brownian velocity , where and are jump distance and time, respectively. Application of the equipartition principle to one component of the kinetic energy, , gives . The phase transformation is driven by a difference in chemical potential, , caused by the concentration gradient produced by the dielectrophoretic forces. The driving force is the gradient of the chemical potential, . The drift velocity in response to the driving force is, according to Newton’s third law,
| [4] |
In a 1D random walk, a particle makes steps to the right with a probability in trials and steps to the left with a probability so that and . The average distance that the particle travels is the net number of steps in the growth direction (suppose to the right): . The drift velocity is then with , which then gives . Equating this to the drift velocity in Eq. 4 then gives . Thus, we find
| [5] |
The ratio of these probabilities is also the ratio of the jump frequencies in the transformation:
| [6] |
which gives for the driving force
| [7] |
Supplementary Material
Acknowledgments
We thank Winfield Hill (Rowland Institute at Harvard) for his assistance with the design and construction of the electronics. This work was supported by NSF Contracts DMR-1206765 and DMR-1611089.
Footnotes
The authors declare no conflict of interest.
*In the reconstructed 3D images, the positional resolution is 0.03 m in the x and y directions and 0.1 m in the z direction along the optical axis of the microscope.
†Potential sites are those where the arrival or departure of a particle would turn it into a crystalline or a liquid one, respectively.
This article is a PNAS Direct Submission.
This article contains supporting information online at www.pnas.org/lookup/suppl/doi:10.1073/pnas.1813885116/-/DCSupplemental.
References
- 1.Coriell S, Turnbull D. Relative roles of heat transport and interface rearrangement rates in the rapid growth of crystals in undercooled melts. Acta Metall. 1982;30:2135–2139. [Google Scholar]
- 2.Walker JL. Unpublished Results Described in B. Chalmers, Principles of Solidification. Krieger; New York: 1977. p. 114. [Google Scholar]
- 3.Greer AL. New horizons for glass formation and stability. Nat Mater. 2015;14:542–546. doi: 10.1038/nmat4292. [DOI] [PubMed] [Google Scholar]
- 4.Broughton J, Gilmer G, Jackson K. Crystallization rates of a lennard-jones liquid. Phys Rev Lett. 1982;49:1496–1500. [Google Scholar]
- 5.Ashkenazy Y, Averback R. Kinetic stages in the crystallization of deeply undercooled body-centered-cubic and face-centered-cubic metals. Acta Mater. 2010;58:524–530. [Google Scholar]
- 6.Tymczak C, Ray JR. Asymmetric crystallization and melting kinetics in sodium: A molecular-dynamics study. Phys Rev Lett. 1990;64:1278–1281. doi: 10.1103/PhysRevLett.64.1278. [DOI] [PubMed] [Google Scholar]
- 7.Celestini F, Debierre JM. Measuring kinetic coefficients by molecular dynamics simulation of zone melting. Phys Rev E. 2002;65:041605. doi: 10.1103/PhysRevE.65.041605. [DOI] [PubMed] [Google Scholar]
- 8.Sun D, Asta M, Hoyt J. Crystal-melt interfacial free energies and mobilities in fcc and bcc fe. Phys Rev B. 2004;69:174103. [Google Scholar]
- 9.Pusey P, Van Megen W. Phase behaviour of concentrated suspensions of nearly hard colloidal spheres. Nature. 1986;320:340–342. [Google Scholar]
- 10.Gasser U, Weeks ER, Schofield A, Pusey P, Weitz D. Real-space imaging of nucleation and growth in colloidal crystallization. Science. 2001;292:258–262. doi: 10.1126/science.1058457. [DOI] [PubMed] [Google Scholar]
- 11.Dullens RP, Aarts DG, Kegel WK. Dynamic broadening of the crystal-fluid interface of colloidal hard spheres. Phys Rev Lett. 2006;97:228301. doi: 10.1103/PhysRevLett.97.228301. [DOI] [PubMed] [Google Scholar]
- 12.Sullivan M, et al. An electric bottle for colloids. Phys Rev Lett. 2006;96:015703. doi: 10.1103/PhysRevLett.96.015703. [DOI] [PubMed] [Google Scholar]
- 13.Leunissen ME, Sullivan MT, Chaikin PM, Van Blaaderen A. Concentrating colloids with electric field gradients. i. particle transport and growth mechanism of hard-sphere-like crystals in an electric bottle. J Chem Phys. 2008;128:164508. doi: 10.1063/1.2909198. [DOI] [PubMed] [Google Scholar]
- 14.Zhu J, et al. Crystallization of hard-sphere colloids in microgravity. Nature. 1997;387:883–885. [Google Scholar]
- 15.Cheng Z, Russel WB, Chaikin P. Controlled growth of hard-sphere colloidal crystals. Nature. 1999;401:893–895. [Google Scholar]
- 16.Pohl H. Dielectrophoresis: The Behavior of Neutral Matter in Nonuniform Electric Fields. Cambridge Univ Press; Cambridge, UK: 1978. [Google Scholar]
- 17.Kumar A, Qiu Z, Acrivos A, Khusid B, Jacqmin D. Combined negative dielectrophoresis and phase separation in nondilute suspensions subject to a high-gradient ac electric field. Phys Rev E. 2004;69:021402. doi: 10.1103/PhysRevE.69.021402. [DOI] [PubMed] [Google Scholar]
- 18.Hwang H. 2016. Crystal-liquid transitions studied with colloids in an electric bottle. PhD thesis (Harvard University, Cambridge, MA)
- 19.Hsu MF, Dufresne ER, Weitz DA. Charge stabilization in nonpolar solvents. Langmuir. 2005;21:4881–4887. doi: 10.1021/la046751m. [DOI] [PubMed] [Google Scholar]
- 20.Kanai T, et al. Crystallization and reentrant melting of charged colloids in nonpolar solvents. Phys Rev E. 2015;91:030301. doi: 10.1103/PhysRevE.91.030301. [DOI] [PubMed] [Google Scholar]
- 21.Gao Y, Kilfoil ML. Accurate detection and complete tracking of large populations of features in three dimensions. Opt Express. 2009;17:4685–4704. doi: 10.1364/oe.17.004685. [DOI] [PubMed] [Google Scholar]
- 22.Yethiraj A, van Blaaderen A. A colloidal model system with an interaction tunable from hard sphere to soft and dipolar. Nature. 2003;421:513–517. doi: 10.1038/nature01328. [DOI] [PubMed] [Google Scholar]
- 23.Ackland G, Jones A. Applications of local crystal structure measures in experiment and simulation. Phys Rev B. 2006;73:054104. [Google Scholar]
- 24.Ramsteiner I, Weitz DA, Spaepen F. Stiffness of the crystal-liquid interface in a hard-sphere colloidal system measured from capillary fluctuations. Phys Rev E. 2010;82:041603. doi: 10.1103/PhysRevE.82.041603. [DOI] [PubMed] [Google Scholar]
- 25.MacDonald C, Malvezzi A, Spaepen F. Picosecond time-resolved measurements of crystallization in noble metals. J Appl Phys. 1989;65:129–136. [Google Scholar]
- 26.Chan WL, Averback RS, Cahill DG, Ashkenazy Y. Solidification velocities in deeply undercooled silver. Phys Rev Lett. 2009;102:095701. doi: 10.1103/PhysRevLett.102.095701. [DOI] [PubMed] [Google Scholar]
- 27.Turnbull D. On the relation between crystallization rate and liquid structure. J Phys Chem. 1962;66:609–613. [Google Scholar]
- 28.Nguyen VD, Hu Z, Schall P. Single crystal growth and anisotropic crystal-fluid interfacial free energy in soft colloidal systems. Phys Rev E. 2011;84:011607. doi: 10.1103/PhysRevE.84.011607. [DOI] [PubMed] [Google Scholar]
- 29.Wilson HW. XX. On the velocity of solidification and viscosity of super-cooled liquids. Lond Edinb Dublin Philosophical Mag J Sci. 1900;50:238–250. [Google Scholar]
- 30.Frenkel J. Note on a relation between the speed of crystallization and viscosity. Phys Z Sowjetunion. 1932;1:498. [Google Scholar]
- 31.Aziz MJ, Nygren E, Hays JF, Turnbull D. Crystal growth kinetics of boron oxide under pressure. J Appl Phys. 1985;57:2233–2242. [Google Scholar]
- 32.Berg H. Random Walks in Biology. Vol 84. Princeton Univ Press; Princeton: 1993. p. 011607. [Google Scholar]
Associated Data
This section collects any data citations, data availability statements, or supplementary materials included in this article.


