Summary
Hematopoiesis is an essential process that evolved in multicellular animals. At the heart of this process are hematopoietic stem cells (HSCs), which are multipotent, self-renewing and generate the entire repertoire of blood and immune cells throughout an animal’s life1. While there are comprehensive studies on vertebrate HSC self-renewal, differentiation, physiological regulation and niche occupation, relatively little is known about their evolutionary origin and their niches. Here we study the hematopoietic system of Botryllus schlosseri, a colonial tunicate that has vasculature, circulating blood cells, and interesting stem cell biology and immunity characteristics2–8. Self-recognition between genetically compatible B. schlosseri colonies leads to the formation of natural parabionts with shared circulation, whereas incompatible colonies reject each other 3,4,7. Using flow-cytometry, whole-transcriptome sequencing of defined cell populations and diverse functional assays, we identified HSCs, progenitors, immune-effector cells, and an HSC niche, and demonstrated that self-recognition inhibits allospecific cytotoxic reactions. Our study reveals that HSC and myeloid lineage immune cells emerged in a common ancestor of tunicates and vertebrates, and these results also suggest that hematopoietic bone marrow and the B. schlosseri endostyle niche evolved from a common origin.
Charles Darwin recognized that the study of tunicates is critical to understand the evolution of vertebrates - tunicates were later discovered to be a sister group of vertebrates9–11. To gain insight into the evolution of the mammalian hematopoietic system we characterized the hematopoietic and immune system in the colonial tunicate Botryllus schlosseri.
B. schlosseri colonies produce genetically identical individuals (zooids) through stem cell mediated cyclical budding5 (Fig. 1a-b). Every week, developed buds replace their parent zooids which then undergo synchronized programmed cell death12 (Video S1). When colonies touch, their extracorporeal vasculature either fuse or reject2,3 (Fig. 1c; Video S2). This self-nonself recognition process is controlled by the highly polymorphic BHF gene and requires at least one shared BHF allele for fusion7. We adapted fluorescence-activated cell sorting13 (FACS) to separate B. schlosseri cells and isolated 34 cell populations using size, granularity, natural auto-fluorescence,and reagents such as antibodies that differentially bind to live cells (CD49d, CD57, BHF), Concanavalin-A, and alkaline phosphatase (AP) expression (Extended Data Fig. 1-2, Extended Data Tables 1, 2a). We sequenced the transcriptome of 23 sorted cell populations, the hierarchical endpoint populations of our FACS gating strategy (Extended Data Fig. 1c-d, Table S1), and found correlations between gene expression profiles, morphology, and marker expression (Extended Data Fig. 3). The cluster of cell populations CP25, 33 and 34, had 235 differentially upregulated genes known to be expressed in vertebrate blood and hematopoietic systems (External Data Fig 4a, Table S2)14. Analysis of this gene set by Gene Expression Commons15 against genes expression data from 39 distinct mouse hematopoietic stem, progenitor and differentiated cells revealed significant expression overlap between CP25, 33 and 34, and mammalian hematopoietic stem, progenitor and myeloid lineage cells (Fig. 2a, Tables S2, S3).
Figure 1. B. schlosseri Anatomy and Natural Transplantation Reactions.
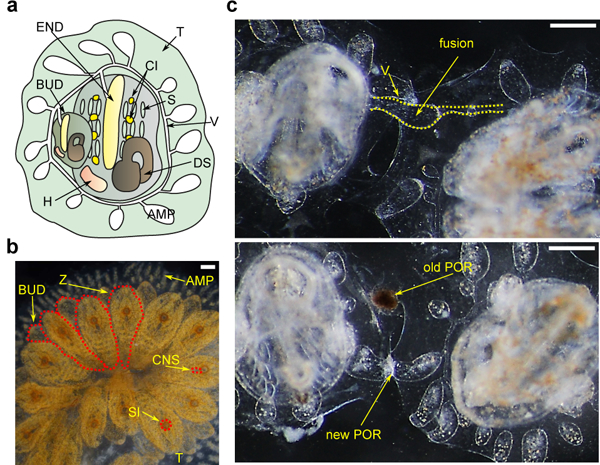
a, Diagram of a zooid (ventral view) and primary bud (BUD), embedded within a tunic (TUN), with vasculature (V) connected to the zooid and bud which terminates in ampullae (AMP), the zooid has a branchial sac consisting of the endostyle (END) and stigmata (S), cell islands (CI), digestive system (DS) and heart (H). b, Live imaging of a colony (dorsal view), developing buds (BUD) are connected to the parental zooids (Z), all are connected to blood vessels, zooid’s siphons (SI) and central nervous system (CNS) are observed c, Live imaging of colonies undergoing fusion (top) and rejection (bottom), arrows point to fused vasculature and points of rejection (POR). Scale bar 0.2 mm.
Figure 2. Multilineage Differentiation Capacity, Homing Sites of cHSC and their niches.
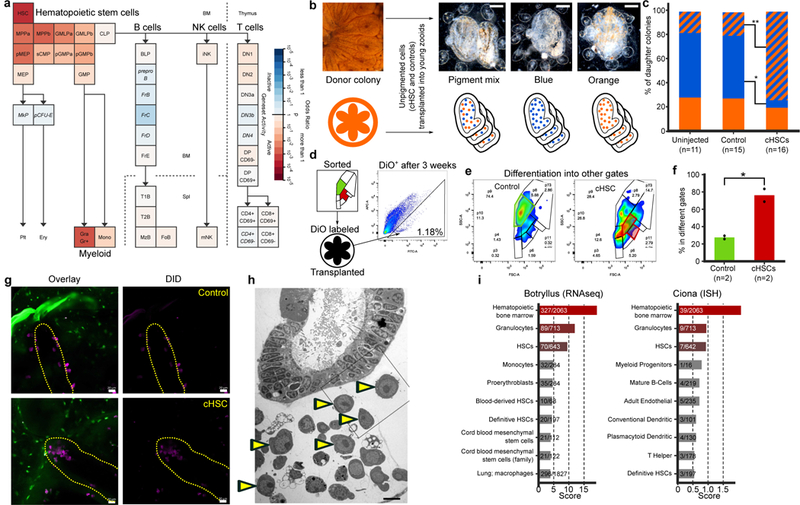
a, Geneset Activity Analysis genes upregulated (n=235) in candidate HSCs (CP25, 33, and 34) using the Gene Expression Commons tool on a mouse hematopoiesis model. The enriched populations are HSCs and the myeloid lineage. b, Candidate HSCs and a control cell population (CP18) from an orange pigmented donor colony were transplanted into compatible recipient colonies with blue, orange, or mixture of the two pigmented cells. Upper panel shows live imaging. Scale bar 0.2 mm. c, Significant reduction of the ratio of blue colonies and significant upregulation of the ratio of mixed pigmented colonies (Fisher’s exact test, two tailed, *P=0.006, **P=0.004), 20 days post-cHSC transplantation.d-f, cHSC and a control cell population (CP18) were labeled with DiO and transplanted into compatible colonies (d). Three weeks after transplantation DiO+ cells (d right panel) from the recipient colonies were analyzed by FACS. 24% of the cHSC transplanted cells were detected in their original gate (e right panel in red), the rest were detected in other gates. The majority of the transplanted cells from the control group were detected in the original gate (e left panel in green). Experiment was performed twice. f, percent of the cells from both cHSC and control populations detected in gates different from their original gate, three weeks following transplantation. Experiment was performed on two pools of 5 animals of each population, unpaired T-test, two-tailed, *P=0.024, means. g, cHSC and a control (CP3) were isolated, labeled with DiD (violet) and transplanted into CFSE (green) labeled compatible colonies. Five to ten days following transplantation, only the cHSC populations homed to the endo-niche (5/6) compared to control (0/4). P=0.048 Fisher’s exact test, two tailed, in yellow indicated endostyle, scale bar 20 μm. h, Electron microscopy section of the endostyle and subendostylar sinus (endo-niche). Yellow arrowheads indicate cells with hemoblast (cHSC) morphology. Performed three times. Scale bar 5 μm. i, Enriched blood-associated mammalian cell-types for highly expressed genes in the B. schlosseri endostyle (RNAseq) and the solitary tunicate Ciona robusta endostyle (ISH)21.
To measure the ability of these candidate HSC populations (cHSC) to differentiate into other cell types, cells were transplanted from orange donor colonies to compatible colonies (Fig. 2b). Twenty days following transplantation the unpigmented cHSC populations (CP25, 33, 34) from the orange donor colony differentiated into orange pigment cells within the recipient colonies, as evident by upregulation of the mixed pigmented colonies and reduction in pure blue colonies, a trend that was not observed in the control (CP18) and uninjected colonies (Fig. 2c). To test the multilineage differentiation capacity, the cHSC population and control population were isolated, labeled with a fluorescent membrane dye (DiO), and transplanted into compatible recipient colonies without cytoreductive treatments of the recipients. Three weeks following transplantation 76% of transplanted cHSCs were detected in a different FACS gate than the original versus less than 30% of the transplanted cells from the control group (Fig. 2d-f; Extended Data Fig. 5a).
To identify the cHSC niches, the cHSC population and a control population (CP3) were isolated, labeled with a lipophilic dye (DiD) and injected into labeled (CFSE) compatible colonies. 5–10 days after transplantation, DiD-labeled cHSC populations migrated in the recipient colony and aggregated in two known B. schlosseri stem cell niches, the endostyle and the cell islands. The endostyle niche, located at the anterior subendostylar sinus (endo-niche), has been identified as a somatic stem cell niche, and the cell islands niche is considered a germline stem cell niche6,16 (Fig 2g; Extended Data Fig. 5b). Ermak (1976), reported the presence of proliferating cells and hemoblasts near the endostyle and around the branchial sac’s stigmata in the juvenile Ciona intestinalis17. Indeed blood cells with a hemoblast (cHSC) morphology and proliferating cells are abundant in the B. schlosseri endo-niche6 (Fig. 2h, Extended Data Fig 5c-d). The control population (CP3) does not express a gene signature of the hematopoietic system, but does have a germline gene expression signature and is localized to a known germline stem cell niche16, the cell islands (Extended Data Fig. 4c and 5b). The B. schlosseri cHSCs localized towards known somatic stem cell niche (the endo-niche), similar to the homing process of mammalian HSC’s to the bone marrow18–20. The endostyle is a complex tissue with defined anatomical structures and molecular features6,16,21–24. We sequenced its transcriptome (n=10) and compared them to the transcriptome of whole colonies (n=34). Homologous genes that were significantly upregulated in the endostyle were analyzed by GeneAnalytics14, revealing a shared expression of 327 genes between the endostyle and human hematopoietic bone marrow (Fig. 2i left, Extended Data Fig 6a, Table S2, S4). This finding was further supported by Gene Expression Commons15,25 (Extended Data Fig. 6b). We queried previously obtained Ciona robusta in situ expression data21 for endostyle associated genes and found them to be similar (Fig. 2i right; Extended Data Fig. 6c).
In mammals, innate cellular immune responses are mediated in part by phagocytosis: the engulfment of target cells, and both adaptive immunity and innate immunity cytotoxicity: the direct killing of the target cells. We used diverse ex-vivo phagocytosis assays to identify phagocytic cells and track their cell population (Extended Data Fig 7). These assays revealed three major phagocytic populations which includes two previously described phagocytic cells: amoebocytes (within CP4 and 18), large phagocytes26,27 (within CP13) and a novel population, the candidate myeloid cell population (within CP7 and 10) (Extended Data Fig. 7). The myeloid cells were the main contributors to phagocytosis, as evidenced by >40% contribution to each of the phagocytosis assays, the large phagocytes contributed mainly to allogeneic phagocytosis (Extended Data Fig. 7a).
We did not find a cell population with a clear mammalian cytotoxic gene expression signature. Morula cells (MC), which contain phenoloxidase, accumulate in rejection points and have been proposed as cytotoxic cells that mediate rejection26,28,29. We detected MC in population CP18, but in lower levels than expected, prompting us to look for a candidate precursor cell. We studied the large granular lymphocyte-like (LGL) cells (enriched in CP31) as a potential candidate, since its morphology resembles Natural Killer (NK) cells, the innate immunity cytotoxic cells of mammals30. Ex-vivo experiments revealed a transition of purified LGL cells into MC after two days ex-vivo (Fig. 3a, labeled 1–4), suggesting that the LGL cells are the cytotoxic MC which become pigmented granular MC following activation.
Figure 3. Allorecognition is mediated by cytotoxic cells through BHF recognition.
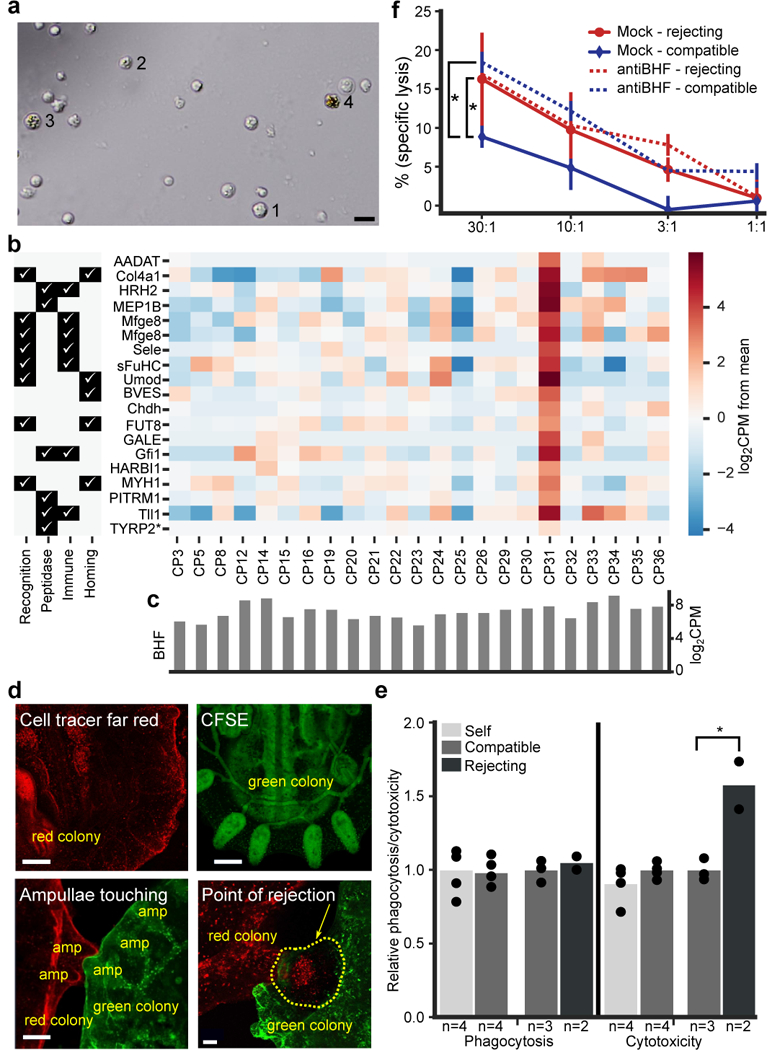
a, Observation of isolated large granular lymphocyte-like (LGL) cells after two days ex-vivo. 1- morphology of original isolated cells, 2–3- granular and light pigmented cells, and 4 - granular pigmented morula cell (MC). The experiment was performed three times. b, Representation of homolog annotated genes differentially upregulated by LGL enriched population CP31. *TYRP2 (homolog of Phenoloxidase) is not differentially expressed, but is 7-fold higher in CP31. Left side is a table indicating gene association with immunity functions. c, BHF expression levels in the cell populations. d, Colony labeled with cell tracker far red (top left), and with CFSE in green (top right). Ampullae touching (bottom left), and in points of rejection (bottom right), mixture of cells is observed in the area of the necrotic tissue (yellow dashed line), the experiment was repeated three times. Scale bar 0.2mm. e, Phagocytosis and cytotoxicity assays were set between compatible, incompatible, or self. Significantly upregulation of cytotoxicity between cells taken from incompatible colonies are observed. The experiment with 105: 105 cell ratio was performed twice with two to four samples in each treatment, and validated by additional experiments in different ratios. Unpaired T-test, two-tailed *P=0.023, mean. f, Blocking of BHF with anti BHF serum. Compatible colony target cells in blue and incompatible colony target cells in red. Mock serum-solid line and anti-BHF serum-dashed line. The blocking of BHF significantly upregulated the cytotoxicity of compatible targets compared to mock serum. The experiment was performed three times with duplicates or triplicates. ANOVA two-factor with replication, *P=0.0008, Mean, SD.
Cytotoxicity assays that compared the ability of morula and LGL cells to induce cytotoxicity revealed that isolated LGL cells had significantly higher cytotoxicity compared to isolated MC and control population (CP3; Extended Data Fig. 8a). Overnight incubations of isolated LGL cells in either a syngeneic (self) or an allogeneic (nonself) challenge led to a transition of 60% of the LGL cells that were incubated with allogeneic cells to MC. Only about 10% of the LGL cells that were incubated with syngeneic cells became MC (Extended Data Fig. 8b). Upon activation, LGL change their morphology, develop granularity and pigmentation, presumably due to phenoloxidase activation, and become MC (Fig 3a, Extended data Fig. 8b-c). This set of experiments demonstrates that the LGL cells are the cytotoxic cell population. The term “cytotoxic morula cell” will be used to describe the LGL cells.
Analysis of the genes that were differentially upregulated by the highly enriched cytotoxic morula cell population (CP31), revealed 52 unannotated genes with no human or mouse homologs. Among them, 21 genes carry domains that are associated with functions of cytotoxic cells like recognition or lysis and C-type lectin, a domain contained in human NK cell receptors (Table S5). Among the 18 differentially upregulated genes that do have sequence homology to genes in vertebrates, 14 are associated with at least one of the following functions: cellular recognition, cytotoxicity or peptidase activity, leukocyte homing and general immune response (Fig. 3b). CP31 also expresses tyrosinase, the vertebrate homolog gene to phenoloxidase which is one of the main enzymes found in MC28, 7-fold higher compared to the other cells. While we did not find a B. schlosseri cell population that had a significant lymphoid lineage signature, Geneset Activity Analysis suggests that the MC enriched CP19 has expression resemblance to mouse T-cells, B cells, and immature NK cells (Extended Data Fig. 4d). This list does not include any gene that is associated with known adaptive immunity function (Table S2).
To test whether allogeneic cells interact in-vivo during rejection whole colonies were differentially labeled, set near each other and monitored by live imaging (Fig. 3d, Video S3). Direct contact between allogeneic cells was detected during rejection within the points of rejection (POR; Fig. 3d, lower right). Next, we performed allogeneic phagocytosis and cytotoxicity assays. Assays were set between cells taken from compatible colonies (sharing one BHF allele), rejecting colonies (no shared BHF allele) or self (same colony) (Fig. 3e). Confocal microscopy was used to validate phagocytosis and in the cytotoxicity assays, specific lysis were validated by increasing ratios between effector to target cells (External Data Fig. 8d-e). The experiment was accomplished by differential labelling of cells originating from either the same colony, two different compatible or rejecting colonies. A significant increase of cellular cytotoxicity was detected between cells that were derived from rejecting colonies compared to cells derived from either compatible or the same colonies (Fig. 3e, External Data Fig. 8e). Since all the treatments led to similar levels of phagocytosis we concluded that cytotoxicity is the immune effector mechanism of the cellular allogeneic response.
In a third set of experiments, we tested whether blocking BHF would affect the cytotoxic reaction. Cytotoxicity assays between compatible and rejecting colonies revealed significantly higher cytotoxicity between rejecting colonies with mock serum (Fig. 3f). Blocking BHF with serum containing polyclonal anti-BHF antibodies which bind live B. schlosseri cells (Extended Data Fig. 2e, Extended Data Table 2a), enhanced cell lysis between compatible colonies to the level observed in rejecting colonies (Fig. 3f). This treatment did not affect the level of cell lysis observed in rejecting colonies (Fig. 3f). These results revealed that BHF is a major histocompatibility factor essential for self-recognition. Similar to NK inhibition by MHC, blocking BHF revealed that the self-BHF recognition is a major inhibitory mechanism of cytotoxicity. These results and the observation that fusion occurs when colonies share at least one BHF allele7, demonstrate that, as in NK recognition, the cellular cytotoxicity mechanism in B. schlosseri is based on ‘missing self’31.
The B. schlosseri hematopoietic and immune systems combine features of vertebrates and invertebrates (Fig. 4). B. schlosseri shares morphological and molecular characteristics with the vertebrate HSC and myeloid lineage including cells that take part in phagocytosis. It also has amoebocytes and large phagocytes with morphologies resembling invertebrate cell types32,33. The B. schlosseri cytotoxic morula cells carry imprints reminiscent of vertebrates’ lymphocytes, but mainly express tunicate-specific gene repertoire (Fig. 3b, Extended Data Fig. 4d, Table S2, S5). Several studies describe morula-like cells with phenoloxidase activity in other invertebrate species33,34. Studying novel gene sets that are expressed by the cytotoxic morula cells and finding the BHF inhibition pathway will most likely reveal novel mechanisms to delimit self from non-self and target pathogens.
Figure 4. Evolution of cellular immune system.
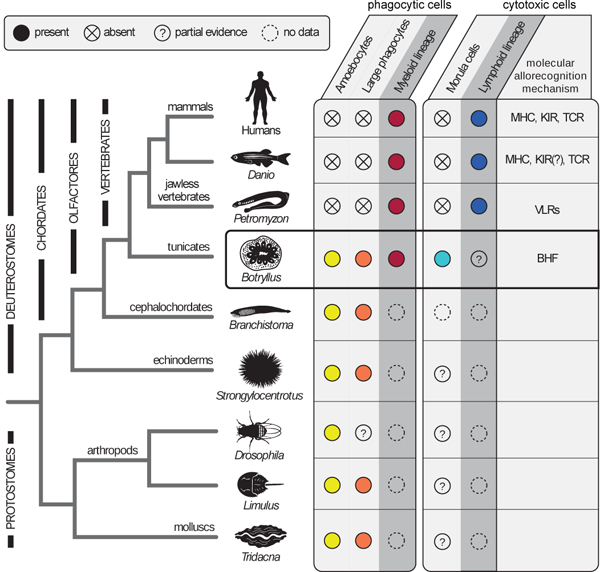
Invertebrate and vertebrate species, information regarding their cellular immune systems. The table to the right describes the type of immune associated cells found in each animal. Colonial tunicates contain immune system cells found in both invertebrate and vertebrate species. While amoebocytes and large phagocytes are found in B. schlosseri and other invertebrate species (yellow and orange), myeloid lineage phagocytic cells were so far found only in B. schlosseri and vertebrates (red). Cytotoxic morula cells were identified in B. schlosseri and most likely exist in a few other invertebrate species (turquoise), but were not identified in vertebrates. Although a classic lymphoid lineage was found only in vertebrates (blue), there is a cellular population and additional molecular analysis suggesting the existence of mainly undifferentiated lymphoid cells in B. schlosseri. The cellular allorecognition molecules identified in each species are stated in column six: Immunoglobulin superfamily MHC, KIRs and TCR, leucine rich repeats receptors of the VLRs, and the BHF. The symbol “?” – represents missing functional or molecular validation. Data source summarized in Extended Data Table 2b.
Methods
Colony development, labeling and allorecognition assays
The life cycle of B. schlosseri, includes both sexual and asexual reproduction pathways. Sexual reproduction starts with fertilization and progresses through classic embryonic stages into a tadpole larva featuring chordate characteristics such as tail, notochord, neural tube and striated musculature. Upon hatching, the motile tadpole settles on a substrate and metamorphoses into an oozoid, with a sessile body plan (Fig. 1a). The oozoid begins a cyclical budding process of asexual reproduction, forming a colony of genetically identical zooids and buds (Fig. 1b). The colonial individuals are united under a single gelatinous tunic by a network of blood vessels, which terminate in sausage shaped protrusions, ampullae (Fig. 1a-c). Throughout adult life, B. schlosseri generates its entire body every two weeks. This stem cell mediated cycle of development includes the formation of all body organs including the heart, respiratory system, digestive system, and neural complex. Sexual reproduction commences when the ovary and testis are formed.
Mariculture procedures have been described previously35. Briefly, B. schlosseri colonies were collected from the marina in Monterey, California. Individual colonies were tied to 3×5-cm glass slides and placed 5 cm opposite another glass slide in a slide rack. The slide rack was placed into an aquarium, and within a few days the sexually reproduced tadpoles hatched, swam to the settlement slide, and metamorphosed into the adult body plan. Single colonies were then transferred to individual slides and used in the diverse experiments.
When two genetically distinct colonies or individuals encounter one another, they can either fuse to form a chimera with a common vasculature, or reject one another2,3,7 (Fig. 1c; Video S2). This self-nonself recognition process is controlled by BHF, a single polymorphic histocompatibility gene7. Fusion requires at least one shared BHF allele: upon fusion, circulating somatic and germline stem cells from both colonies compete for dominance of the somatic and germline organs and also contribute to the formation of new buds4,5. Additionally, the buds in one of the chimeric partners often fail to develop8. This developmental failure is an immune-cell based rejection of bud cells that operate within a BHF histocompatible chimera. The process involves inflammation and recruitment of cytotoxic cells, and is thus comparable to mammalian chronic transplant rejection7.
Juvenile colonies were labeled with distinct fluorescent stains (CellTrace CFSE Green, Invitrogen #C34554; CellTrace FarRed, Invitrogen #C34572) and positioned in controlled fusion/ rejection reactions (Fig. 3d). For allorecognition assays, colonies were labeled using CFSE dye (5 mM stock solution) and Far Red dye (1 mM stock solution) in a dilution of 1 μl of dye to 1 ml of filtered seawater. Naive colonies were then bathed in this solution for 60 minutes, allowed to recover then washed and placed in μ-Dishes (ibidi μ-Dish 50mm-low uncoated) for observation. Images were obtained using a confocal fluorescence microscope (LSM700 Axio Observer.Z1, ZEISS).
FACS analysis
For cell isolation, colonies were starved for at least 24 hours prior to dissociation with a fine blade into cell suspensions. Cells were filtered through a 40 μm mesh using a sterile 1 ml syringe pump (a similar procedure to murine spleen dissociation), washed and collected in staining media: 3.3x PBS, 2% FCS and 10 mM Hepes. No enzymatic dissociation was used and the presence of FCS was enough to prevent cell aggregation. After gating on Propidium Iodide (PI), negative cells (using two dimensional plots due to natural fluorescence of B. schlosseri cells), were analyzed using size - forward scatter (FSC) and granularity - side scatter (SSC) panel on log scale using BD FACS Aria-II. We isolated 11 cell populations based on their size (FSC), granularity (SSC) and natural auto-fluorescence (Extended Data Fig. 1b). These purified populations were analyzed according to morphology by light microscopy and defined according to previous cellular work characterizing B. schlosseri cell populations3,26. We then screened a large assortment of antibodies and reagents using mass cytometry (CyTOF) and FACS, to identify cell surface markers that show differential binding to distinct cell populations (Extended Data Tables 1, 2a; Extended Data Fig. 2). The cluster analysis programs SPADE and viSNE were applied to create a differentiation panel of the resultant screened markers (Extended Data Fig. 1a). Using CD49d, CD57, BHF (a mouse anti-serum that was developed against the BHF protein), Concanavalin-A, and alkaline phosphatase (AP), together with size, granularity, and natural auto-fluorescence, we succeeded in defining a total of 34 cell populations - 24 of these are the hierarchical endpoint populations of our FACS gating strategy (Extended Data Fig. 1c-d). CP17 was composed of dead cells and cell debris, and was therefore excluded.
Thirty-four gated populations were analyzed following cell labeling. 5 million cells were suspended in 200μl of staining media prior to FACS analysis: Alkaline Phosphatase (AP) Live Stain (Life Technologies A14353) 1μl, CD49d PE-Cy7 (BioLegend 304313: Clone 9F10) 1μg, CD57 Pacific Blue (BioLegend 322316; clone HCD57) 0.25μg, Concanavalin-A (ConA) AlexaFluor-633 (Sigma) 2μg, mouse anti-BHF serum 1:100 and anti-mouse secondary Cy5-Cy7 (SantaCruz) (Extended Data Table 1-2a). The specific excitation laser and optical filter for emission measurements was as follows [excitation laser in nm and filters stated as long pass (LP) and band pass (BP)]: 488 nm(505LP 530/30BP)- AP, 488 nm(755LP 780/60BP)- CD49d, 405nm(450/50BP)- CD57, 633 nm(660/20BP)-ConA,633 nm(755LP 780/60BP)-BHF. Cells were sorted into 18 well flat μ-Slides coated with poly-L-Lysine (ibidi) for live imaging.
Anti-BHF serum
We created the mouse anti-BHF serum with Thermo Scientific Pierce Protein Biology. The nucleotide sequence that was used for the BHF (759 bp) alpha allele, a BHF allele that is common in our mariculture facility:
ATGGTGCACGATACCGAGCAATTGCTCGCCCAAGGTCACCACGAAGAGGAAACCGAATGTGGGAAATACGGAAAGCTGCCGGAGAAAGGCAGCGAATGCAAGAAACATGGCATATTTTGCCGAATCCTGACTGCGTTACATTTGAAGAAGAGGAGAACTGAACACGATCATCAAAAGTTACTGTCCGAGTCGCAAGAGCATCTCGACGCTTCGACAAAGAAGACCAAGAAAAAAGCCAAGAAGGACAAACGCAAAAACAAACCGCCCAAGAAAGATTCAGAAACTAGCAAGCCCGCTCAGACCACGATTTCAAGACTCCCATCAAACAGAAACAATAACAACGCAAACAGCTTCGCTACCACTTACGAAAAATTCGACAACGACTCACTGTGCTCTGTCGACTTAATACCGGTCGATATCGAATTTTGGGACATGGAGAACGAACCAGTCGACCAACTACCCCACGAAATCCTGGAATCTGTTCATATGTACGGCGACGATCGGTTCGGCGAACGCCTCATTGATAGAGCCCAAAATAAATACGCCCCGTTGGACGAAAAGCAACGGTCCGAGTCCCACGGCGCTGGGGAGTACTTAAAGCATCAGTGGAAGGGTCAGGGGGCCAAAAAAGCGCGCAAGAGAATTCGAACTGTGATGAAGGCTACTTGGCAATCTCTACAAGCGGGCGCTAGATCGCAAACAGCTTTTTTGAACCCTCAGGGTGCGGTGTCGGCGGCCCTTGTACAAAACAGGAGATAA
The BHF was cloned into pET23b vector including C-term His-Tag, and produced in DH5a cells. Validation of the mouse serum binding to BHF was done by Thermo Scientific Pierce Protein Biology using ELISA. We used FACS to validate that the anti-BHF mouse serum did bind to Botryllus live cells. Labeling of live cells (PI negative) by the anti-BHF serum demonstrate that BHF is presented on the membrane (External Data Fig. 2e). The localization of the BHF to the membrane has been previously described36. Our assumption is that if a serum can recognize BHF on the membrane it will be able to block its interaction with a recognition receptor.
CyTOF mass cytometry screening
CyTOF and its cluster analysis programs SPADE and viSNE were used to screen a large assortment of antibodies against human cell-surface antigens that would cross-react with B. schlosseri cells and could potentially differentiate cellular populations (Extended Data Table 1, Extended Data Fig. 2). The cluster analysis programs SPADE and viSNE that were developed to analyze CyTOF data37 were applied to create a differentiation panel of the resultant screened markers (Extended Data Fig. 1).
For the screen of 49 antibodies, live cells were labeled for 30 minutes on ice in staining media (3.3x PBS, 2% FCS and 10 mM Hepes) with different antibodies labeled with elemental isotopes (Extended Data Table 1), followed by two washes with staining media. After washing, cells were fixed in 4% PFA in 1x PBS, washed once with staining media and then incubated at room temperature for 20 min in an iridium-containing DNA intercalator (Fluidigm) in 1.5% paraformaldehyde in 1x PBS. Prior to measurement on a mass cytometer, cell samples were washed once with staining media and twice with water37 (Fluidigm). Analysis of the FCS files were done with Cytobank and FlowJo. Antibodies with positive signals were validated by FACS as summarized in Extended Data Table 1.
Tissue dissection, RNA extraction, purification, and transcriptome sequencing
FACS sorted cell population:
We used the protocol described in Koh et al. 2016 to extract RNA from FACS sorted cells (n=24)38. Twenty three endpoint populations were sequenced, in addition to CP2, which was composed of all live cells. CP17 was composed of dead cells and cell debris, and therefore was excluded in the population analysis. 20,000 cells of each sequenced population were sorted in 750 μl Trizol-LS (Invitrogen #10296010 ) using a 100 μm nozzle. Cells were vortexed and incubated for 10 minutes at room temperature prior to freezing in −80 C. After thawing, cells were washed with chloroform, and RNA was isolated according to the manufacturer’s directions, with minor modifications. Linear polyacrylamide (LPA) carrier (Sigma Aldrich # 56575–1ML) was added to enhance recovery of RNA, followed by DNase I treatment per manufacturer’s instructions (Qiagen RNeasy micro kit, # 74004).
Whole colony samples:
We used the protocol described in Voskoboynik et al 2013 to extract RNA from whole colonies (n=34)6.
The 34 whole colony samples include all tissues in the colonies.
Endostyle samples:
Insulin syringes were used to dissect endotyles (n=10). The endostyle is a long glandular groove extending medially at the ventral face of the zooids branchial sac along its anterior posterior axis23. The endostyle is immersed in blood cells flowing through the large subendostylar sinus and other sinuses and is innervated by the main and lateral subendostylar nerves39,40. The endostyle epithelium consists of eight distinct anatomical zones, each defined by a specific gene expression profile6,16,21,22. The 10 endostyle samples taken for RNAseq include the endostyle epithelial cells, cells circulating in the subendostylar sinuses and the main and lateral subendostylar nerves that are extending along the endostyle anterior posterior axis. Dissected endostyles samples were flash frozen in liquid nitrogen to minimize RNA degradation and stored at −80 C. Using a mechanized Konte tissue grinder and pestle, samples were homogenized in the presence of lysis buffer (Qiagen RNAeasy Microkit #74004), and total RNA was extracted following the manufacturer’s protocol. Resultant RNA was cleaned and concentrated (Zymo Research RNA Clean and Concentrator-5, R1015) and analyzed by an Agilent 2100 Bioanalyzer for quality analysis prior to library preparation. cDNA libraries were then prepared from high quality samples (RIN > 8) using Ovation RNA-seq v2(Nugen). Size selection was performed prior to barcoding using Zymo Research Select-a-Size DNA Clean and Concentrator Kit (D4080); Libraries were barcoded using NEBnext Ultra DNA Library Prep Kit Master for Illumina (New England Biolabs, E7370S) and NEBNext Multiplex Oligos for Illumina (New England Biolabs, E6609S). Barcoded library samples were then sequenced on an Illumina NextSeq 500 (2×150bp, producing an average of 15 million reads/cell population).
Cytotoxicity and phagocytosis assays.
Three different ex-vivo phagocytosis assays were used to identify the B. schlosseri myeloid lineage phagocytic cell populations: i) phagocytosis of fluorescent beads, ii) phagocytosis of a fluorescently labeled marine bacteria (Vibrio diazotrophicus) and iii) allogeneic phagocytosis, where we tested the capability of cells from different colonies to engulf allogeneic cells (Extended Data Fig. 7). FACS was used to identify the phagocytic cells in each of the ex-vivo assays and to track its cell population. Confocal microscopy and ImageStream analysis were used to confirm engulfment (Extended Data Fig. 7).
Bacteria and beads phagocytosis assays:
cells (105 cells/200 μl) were incubated overnight at 18°C in a 2:1 ratio of beads: cells using Fluoresbrite® YG Carboxylate Microspheres 1.00μm (Polysciences). To measure phagocytosis of bacteria, the marine bacteria Vibrio diazotrophicus was heat inactivated in 95° C for 5 minutes, and labeled with Alexa Fluor 647 (Invitrogen #A20006). The analysis of cells positive to beads or cells positive to bacteria was done by flow cytometry using two fluorescent channels - the green channel was used to detect beads and the far-red channel was used to detect bacteria (Extended Data Fig. 7). FlowJo V10 (FlowJo) was used to analyze the flow cytometry data.
Phagocytosis of allogeneic cells:
the labeling and incubation of cells were done as describe for the cytotoxicity assay bellow. Phagocytosis was measured as double positive cells in the FACS plots of the two labeling markers. Due to the natural fluorescence of B. schlosseri cells, the level of double positive cells in wells with separation of each one of the labels was reduced from the double positive in the experimental wells (about 5% background). To validate phagocytosis, cells were sorted and observed by confocal microscopy. To compare cytotoxicity to phagocytosis, the optimal ratio (1:1) for allogeneic phagocytosis was prepared and compared to cytotoxicity at the same ratio, using 105 cells of each labeled group per well.
FACS-based cytotoxicity assay8,41 to measure killing of cells in-vitro. Isolated B. schlosseri cells were labeled using CFSE (5uM; Life technologies) and Far Red dye (1uM; Life technologies) for 30 minutes at 18° C to distinguish effector and target cells and washed twice in staining media: 3.3x PBS, 2% FCS and 10 mM Hepes. Cells were incubated overnight in 96 well U shaped plates at 18oC at different effector: target ratios in staining media. After adding Propidium Iodide (PI) to wells to test cell viability, cells were analyzed by FACS. The target or the effector cells were gated on two dimensional analysis using the labeling dyes (CFSE and Far Red dye). Spontaneous lysis was measured as the percentage of PI positive cells in gated target cells in wells without effector cells, and sample lysis was quantified as the percentage of PI positive cells in gated target cells. Specific lysis was calculated as follows: Specific lysis %=100x((sample lysis-spontaneous lysis)/(100-spontaneous lysis)). The gating of FACS analysis was on two dimensional plots due to the natural fluorescence of B. schlosseri cells. For BHF blocking assays, anti-BHF polyclonal mouse serum was used 1:200, or mock serum as control. Colonies with known fusion/rejection outcomes from our mariculture facility were used to measure allogeneic cytotoxicity and phagocytosis. Cytotoxicity and phagocytosis assays were done in triplicates.
Cell Transplantation
B. schlosseri colonies have the ability to fuse spontaneously, thereby facilitating natural ‘transplantation’ or parabiosis assays between genetically compatible yet distinct colonies (those sharing a BHF allele) without requiring radiation-induced elimination of the host’s stem cells5,6,16. Furthermore, based on this feature cells can be sorted and transplanted between compatible B. schlosseri colonies. The differentiation potential of transplanted cells can be tested by a pigmentation-based assay, using distinctly pigmented donor and recipient colonies (e.g. blue vs orange)5,6. The colors of the pigment cells in B. schlosseri are genetically determined42,43. Pigment cells, identified as CP8, circulate in the vasculature and are linked to the hematopoietic lineages by gene expression (Extended Data Fig. 4b). Additionally, the transparent body allows for real time monitoring and tracing of labeled cells by time-lapse microscopy6. Using these methods and a FACS-based differentiation assay developed for this study we assayed the differentiation potential and homing sites of B. schlosseri candidate HSC (cHSC) populations. The experiment of rescuing lethally irradiated recipients was not performed since those experiments were not shown to work in the B. schlosseri model44.
Cell were sorted directly into staining media (3.3x PBS based; 75% of final volume) in order to minimize cellular stress using a 100 μm nozzle. Following sorting cells were labeled with DiD or DiO membrane dye (Life technologies) in order to visualize or identify the transplanted population, and suspended in a final concentration of 105 cells/μl. 105 cells were injected into recipient colonies near the zooid’s heart, using a microinjector (Narishige, Japan) as described in Voskoboynik et al. 20086.
Two transplantation assays were used to measure the ability of a specific cell population to differentiate into other cell types: i) a pigment cell based differentiation assay (donor chimerism) (Fig. 2b-c), and ii) a FACS analysis based differentiation assay (Fig. 2d-f).
The cHSC population transplanted includes CP25, CP33, CP34. As a control we used CP18 (includes CP19, 20, 21) which share molecular signature with the pigment cell population and is located close to the pigment cells populations on the FACS plots (Extended Data Fig. 1). The analysis of the pigment cell based differentiation experiment (Fig. 2b-c) was done in a single blind manner 20 days following transplantation, n=42 transplanted colonies; 16-cHSC, 15-control population, 11-uninjected.
In the FACS analysis based differentiation assay (Fig. 2d-f) the cHSC population (CP25, CP33, CP34) and the CP18 control population (CP19, 20, 21) were labeled by DiO and transplanted to compatible colonies. 3 weeks following transplantation, transplanted colonies were pooled for the analysis by FACS into two pools from each experimental group, having at least 5 transplanted colonies in each pool. Percentage of the cells remaining in each of the original gates on the FSC and SSC was measured, CP9 for CP18 (CP19, 20, 21) and CP10+7 for the cHSC population (CP25, 33, 34) based on the FACS gating hierarchies in Extended Data Figure 1d. In addition we estimated cell proliferation level by measuring levels of DiO fluorescence 3 weeks following transplantation of labeled cells (Extended Data Fig. 5a).
For localization assays two sets of experiments were performed: a total of 14 colonies labeled with CFSE on ibidi 50 mm uncoated μ-dishes, were transplanted with DiD labeled cells (Fig. 2g, Extended Data 5b). cHSC DiD labeled cells were transplanted to 6 colonies, 4 colonies were transplanted with DiD labeled CP3, and 4 colonies were not injected and used as a control for natural fluorescent background. Focusing on known B. schlosseri stem cells niches (the subendostylar sinus and the cell islands6,16), we tested the ability of transplanted cHSC’s and control cells (CP3) to migrate to these sites. An additional channel was used to validate auto-fluorescent cells. For the subendostylar sinus (the endo-niche) there were no transplanted cells detected for CP3 (0/4) or the un-injected colonies (0/4), whereas 5/6 colonies were positive to cHSC cells, showing significant localization of the cHSC to the subendostylar sinus; P=0.048 Fisher’s exact test, two tailed. However, in the cell islands although 4/4 were positive with CP3, 5/6 positive to cHSC, and 2/4 were positive in the un-injected colonies, there is a high concentration of auto-fluorescent cells in the CI.
Histology and Immunohistochemistry
Hematoxylin and Eosin (H&E) staining: cells were incubated overnight on glass slides coated with Poly-L-lysine (Sigma) and fixed by 4% PFA in 0.1M MOPS in 0.5M NaCl, pH 7.5 for 10 min and washed with PBS. The slides were stained with Harris Hematoxylin for 5 minutes and 2% Eosin Y for 1 minute (Extended Data Fig 1e).
Immunohistochemistry was based on Braden et al. 201445. The labeling was done using rabbit anti Phospho-Histone H3 (pHH3; Cell Signaling, 9701) at a concentration of 1:500 (Extended Data Fig. 5d).
Electron Microscopy
Colonies were fixed overnight in 1.5% glutaraldehyde buffered with 0.2 M sodium cacodylate, 1.6% NaCl, pH 7.4. After washing in buffer and post-fixation in 1% OsO4 in 0.2 M cacodylate buffer plus 1.6% NaCl, specimens were dehydrated and embedded in Araldite. Sections were counterstained with toluidine blue, and for EM sections were stained for contrast with uranyl acetate and lead citrate. Micrographs were taken with a FEI Tecnai G2 electron microscope (operating at 100 kV) (Extended Data Fig 5c).
Differential expression analysis
Determination of gene counts was performed using a Snakemake46 pipeline. An outline of the steps is as follows: i) low quality bases and adapter sequences were removed using Trimmomatic47 (version 0.32) ii) overlapping paired end reads were merged using FLASH48 (version 1.2.11) iii) reads were aligned to the UniVec Core database using Bowtie249 (version 2.2.4) to remove biological vector and control sequences, iv) reads were aligned to the Botryllus schlosseri transcriptome with BWA50 (“mem” algorithm, version 0.7.12), v) aligned reads were sorted and indexed using SAMtools, PCR duplicates removed using PICARD (“MarkDuplicates” tool, version 1.128) and then transcript level counts directly counted from the BAM file.
Differential expression was performed using edgeR51. In detail: the gene counts were compiled into a tabular format and loaded into R. Genes were retained with at least five counts per million in at least 80% of the smaller number of the compared samples. A simple model was used to compare the two sets of populations, with p-values adjusted using the Benjamini-Hochberg method to produce a false discovery rate (FDR). FDRs less than 0.05 were called as being differentially expressed. The comparisons between cell populations were performed in a one-vs-all approach, followed by selective aggregating of similar populations. Initially each population was compared to all others (except for CP2 which was an aggregate of all cells). Then all sets of two populations were compared to the remaining, with the best two being grouped together. The metric used is: if A is the set of genes found to be differentially expressed in population A vs all others, and n(A) is the number of genes in that set, then find the maximum of n(AB) - n(A or B). This attempts to find those populations that when grouped together are more distinct from all others compared to the populations individually. After this grouping was performed multiple times, the maximum was no longer above zero, and a new metric was used. This method was used to find the two groups of populations that maximized n(AB)2/(n(A or B) + 1). This aimed to find the populations that fractionally were the most similar. The mergings are as follows: CP33+CP34, CP3+CP23, CP8+CP20, CP21+CP22, CP24+CP26, CP25+CP33+CP34, CP12+CP14, CP5+CP32, CP29+CP36, CP19+CP31, CP15+CP16, CP30+CP35. The number of characteristic, highly expressed genes found per population(s) relative to the other populations varied from 0–2229 (mean 232), with only 23% possessing homology to mouse or human genes with the remaining 77% of these genes being mostly B. schlosseri or tunicate specific.
For visualization, the 250 genes with the largest weights in the first 11 principal components (explaining 90% of the variance in mean-adjusted log-transformed gene counts) were used to cluster the different cell populations in a heatmap (Extended Data Fig. 3a). Many of the populations have visually similar gene expression patterns (for example: CP3, 5 and 23; and CP25, 33 and 34), and in general, samples that were adjacent in FACS-space are also similar in expression-space (Extended Data Fig. 3b, 67% of neighbors in agreement) indicating a correlation between gene expression profile and morphology and marker expression.
Gene domain finding
The protein sequence of CP31 associated non-homologous genes (N=52) was saved to individual FASTA files. These were processed using the python-based RESTful client for InterPro5 (version 5.28–67.0) on ENSEMBLE’s website using the default options to search for annotated domains within ascidian-specific genes that dominate the Botryllus cytotoxic morula cells (Table S5). Unannotated genes domain revealed: transmembrane domains (n=7), cell interaction and sugar binding domains (n=4) and signal peptides (n=3). This analysis also revealed genes with toxin and peptidases domains (g6777, g43113), hydrolase (g61144) and complement and coagulation domains (g6900, g69753). Moreover, g15971 contains a C-type lectin domain, a domain contained in human NK cell receptors (Table S5).
Geneset Activity Analysis on Gene Expression Commons
Gene Expression Commons (https://gexc.riken.jp) provides gene expression dynamic-range and threshold to distinguish active expression from inactive expression for each gene by computing a massive amount of publicly available microarray data15. Once a user submits raw microarray data of a particular cell type, the Gene Expression Commons returns gene expression activity referred to the dynamic-range for each gene, and if expression level exceeds the threshold, the gene is labeled “active gene”. In the Weissman lab, we purified and generated microarray data for each step of adult mouse hematopoiesis as well as several stromal cell types. A gene expression profile of each cell type becomes public domain (or available to the public) through the Gene Expression Commons platform.
For this project, we developed a new function on the Gene Expression Commons platform entitled Geneset Activity Analysis. A user can create a Geneset, a set of genes of interest. Then the significance of the association between a given gene set and a set of active genes in the cell type is examined by Fisher’s exact test.
Extended Data
Extended Data Figure 1. B. schlosseri Cell Sorting Workflow.
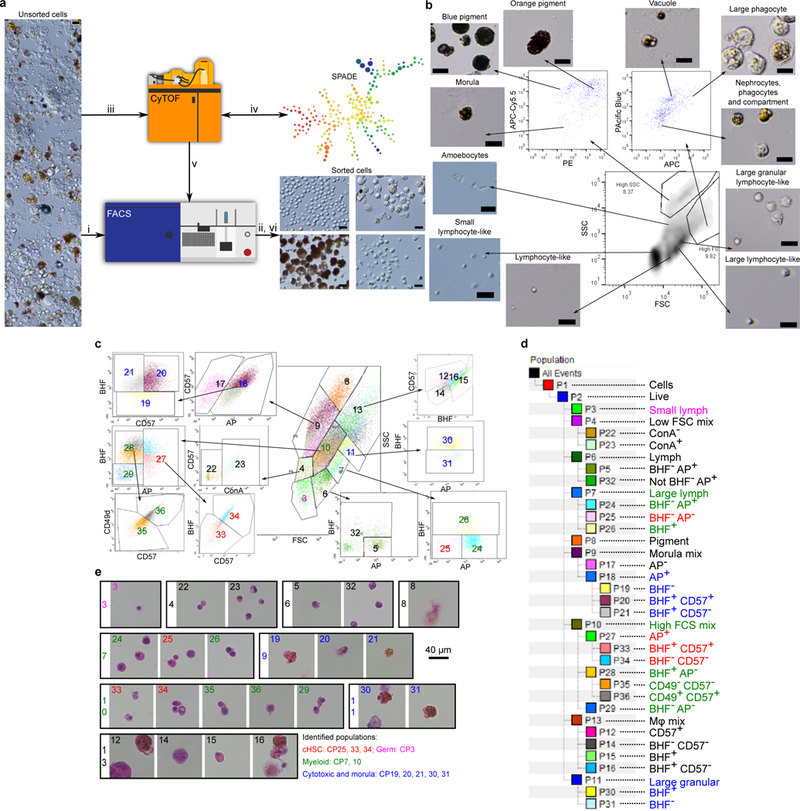
a, Outline of cell purification process. Unsorted cells (light microscopy) are loaded into a FACS (i) and sorted resulting in morphological observation (ii). Cells were labeled by diverse markers and screened by CyTOF (iii) for differential labeling. Based on SPADE cluster analysis (iv) markers were selected for FACS gating (v) before a final sort was performed (vi; c). b, Sorting based on FCS/SSC in the lower panel, and natural fluorescence in the upper panels. The analysis is after gating PI negative cells (live cells). The specific excitation laser and optical filter for emission measurements was as follows [excitation laser in nm and filters stated as long pass (LP) and band pass (BP)]: 488nm for FSC and SSC, 488nm(550LP 575/25BP)- PE, 405nm(450/50BP)-Pacific Blue, 633nm(660/20BP)-APC, 633nm(690LP 710/50BP)-APC-Cy5.5. Nomenclature based on 3,26. Experiment was performed three times. Scale bar 20 μm. c, Sorting panels of 34 cell populations using: FSC, SSC (central panel), CD49d, CD57, Concanavalin-A (ConA), BHF and AP, after gating PI negative cells (live cells). Central panel is FCS/SSC from which additional populations were differentiated. The specific excitation laser and optical filter for emission measurements was as follows [excitation laser in nm and filters stated as long pass (LP) and band pass (BP)]: 488nm(505LP 530/30BP)- AP, 488nm(755LP 780/60BP)- CD49d, 405nm(450/50BP)- CD57, 633nm(660/20BP)-ConA,633nm(755LP 780/60BP)-BHF.d, Hierarchy of sorted cell populations by main parameters of differentiation. For example, the control populations used in Fig. 2b-e, CP19, 20, 21 are all included in CP18. CP18 is derived from CP9.e, H&E staining of the end point cell populations isolated in a rectangle of original population by FSC/SSC. Live imaging was done three times, H&E one experiment with 3 replicates. Color key (reflected in subparts c-d) for different populations identified in this study and the figures that further describe them.
Extended Data Figure 2. Screen for differentiation markers of cell populations for FACS based sorting.
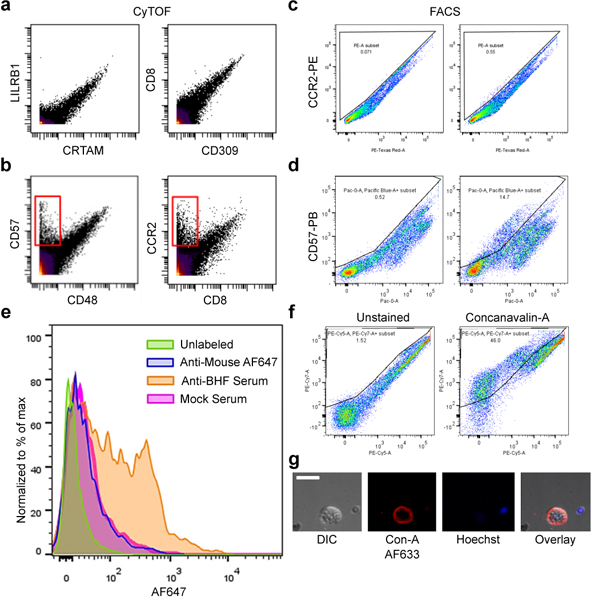
a-b, Examples of screened antibodies by CyTOF Mass cytometry with B. schlosseri cells analyzed by two dimensional mass spectrometry. CyTof Screen was performed once. a, Examples of antibodies considered as nonspecific binders due to the same binding patterns by different antibodies. b, Examples of antibodies considered as specific binders due to the cell population that is bound by one antibody but not the other (red rectangle). c-d, Examples of validation screen by flow cytometry of antibodies with specific binding by CyTOF, done in two dimensional fluorescence excited by the same laser due to autofluorescence. FACS validation for negative was done twice and positive three times. c, Negative validation of CCR2 labeled with PE. d, Positive validation of CD57 labeled with Pacific Blue. e, Flow cytometry of live B. schlosseri cells labeled with anti-BHF mouse serum. Each mouse serum independent serum collection was checked. Anti-mouse Alexa Fluor-647 was used as a secondary antibody. f, Example of positive differential labeling by the lectin Concanavalin-A in PE-Cy7 by FACS. Experiment was performed three times. g, Confocal imagery of membrane Concanavalin-A labeling in Alexa Fluor-633 in red and Hoechst DNA labeling in blue. Experiment was performed once. Scale bar 20 μm.
Extended Data Figure 3. B. schlosseri cell population clustering based on transcriptome analysis.
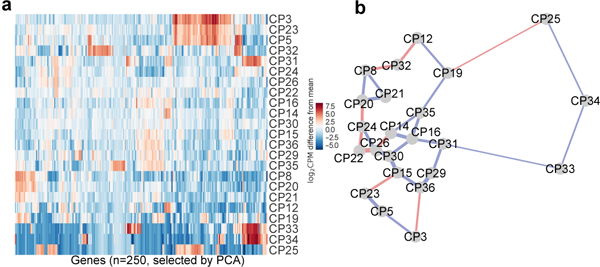
a, 250 genes with the largest weights in the first 11 principal components (explaining 90% of the variance in mean-adjusted log-transformed gene counts) were used to cluster the different cell populations in a heatmap. b, Transcriptome sequencing of B. schlosseri cell populations compared to FACS analysis. 2D projection of the distances between transcriptomes of cell populations based on all differential genes. Lines are drawn between the nearest two neighbors. Blue: corresponds to the FACS adjacency of the populations in the differentiation panel, in red: genetic level proximity that is not predicted by FACS panel adjacency. 20/30 genetic level cellular populations’ proximity were predicted by FACS. Width of lines is inversely proportional to the distances.
Extended Data Figure 4. Gene expression of B. schlosseri cell populations.
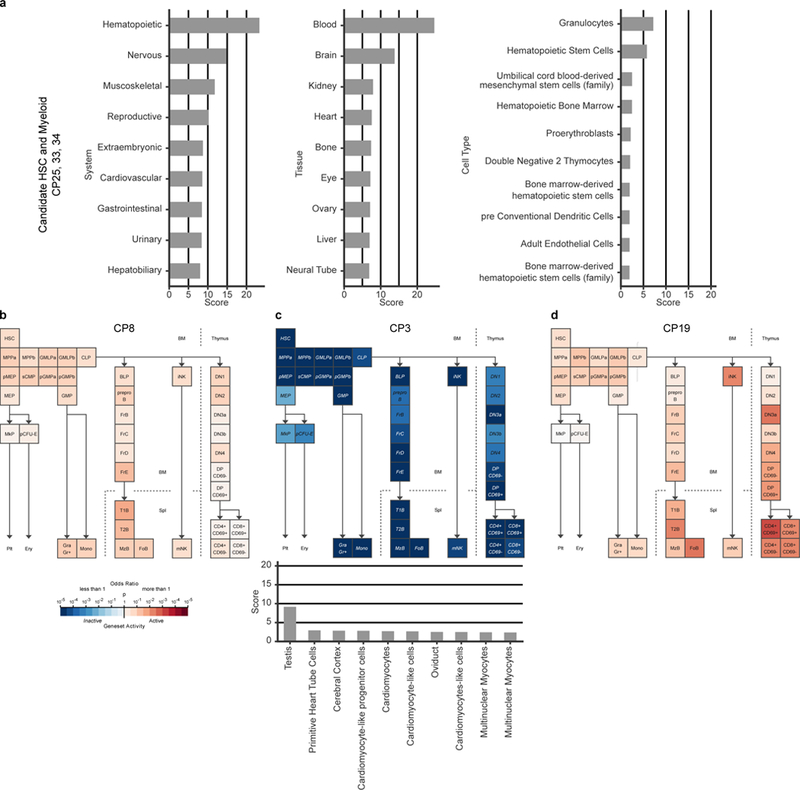
a, Enrichment scores of the top nine systems (left), nine tissues (center), and ten cell types (right) of annotated genes up-regulated in CP33, 34 and 25 using the GeneAnalytics tool compared to human. In systems the hematopoietic system is the highest score, in tissues the blood is the highest score, and within the cells, the granulocytes and HSC have the highest scores. b-d, Geneset Activity Analyses using the Gene Expression Commons tool on a mouse hematopoiesis model of different B. schlosseri cell populations. b, Analysis of CP8 (pigment cells) based on 12 significantly upregulated genes, showing that CP8 is part of the hematopoietic system with gene activity resembling known cell type. c, Analysis of CP3 (small cells) based on 235 significantly upregulated genes, showing that this population is significantly not part of the hematopoietic system. On the bottom: enrichment scores of the top ten tissues using CP3 genes by GeneAnalytics tool compared to human, the highest score is the testis suggesting this population is a gonadal population. d, Analysis of CP19 (enriched with morula cells) based on 96 upregulated genes (p<0.25), showing that CP19 has gene activity as cells in the lymphoid lineage using Geneset analysis.
Extended Data Figure 5. Subendostylar sinuses as an HSC niche.
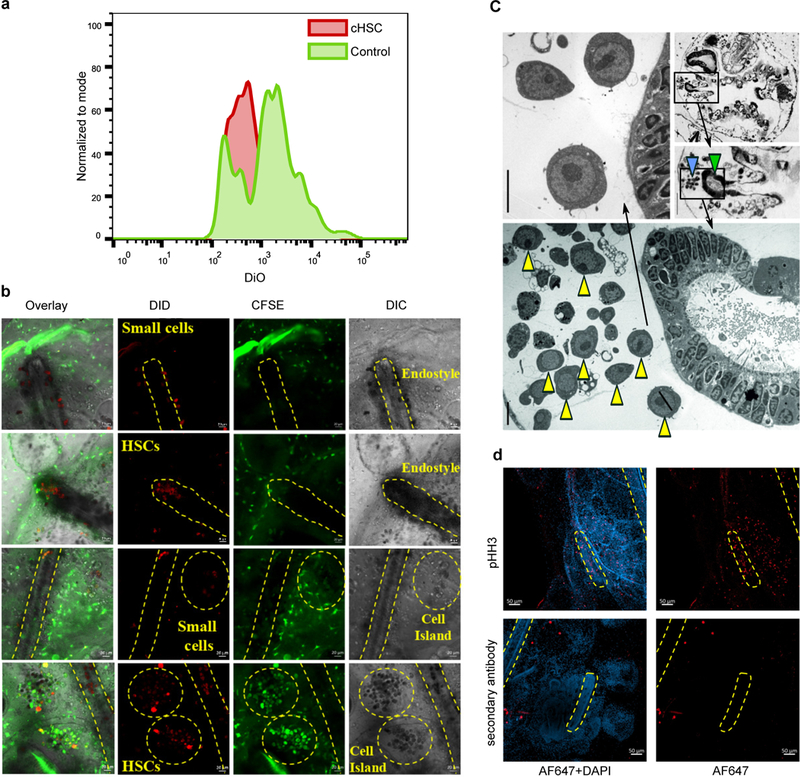
a, Reduction in DiO fluorescence suggesting cell proliferation, three weeks after transplantation. Experiment was performed once with two pools for each population from 5 animals each. b, Candidate HSC (cHSC) population and a control population (CP3) were isolated, labeled with DiD and transplanted into CFSE labeled compatible colonies, in-vivo tracing of transplanted cells migration was used to identify niches. There were no cells detected for CP3 (0/4) or the un-injected colonies (0/4) in the subendostylar sinus, whereas 5/6 colonies were positive to cHSC cells, showing significant localization of the cHSC to the subendostylar sinus;; P=0.048 Fisher’s exact test, two tailed. Although in the cell islands 4/4 were positive with CP3, 5/6 positive to cHSC, and 2/4 positive in the un-injected colonies, there are high levels of auto-fluorescent cells in the cell islands. Full images panels of figure 2g. c, Transverse sections of an adult zooid counterstained with toluidine blue (top two left) where endostyle (green arrow) and endo-niche (blue arrow) are enlarged (Scale bar: 30 μm). Electron microscopy section of the same animal endostyle and endo-niche (right and bottom enlarged). Yellow arrowheads indicate cells with hemoblast (HSC) morphology that are enriched within the endo-niche (Scale bar: 5 μm). Experiment was performed three times. Full images panels of figure 2b. d, Immunohistochemistry with antibodies to Phospho-Histone H3, suggesting mitotic cells in the endostyle region in the developing primary bud and also in the adult zooid endostyle.
Extended Data Figure 6. Gene expression of an HSC niche - the endostyle.
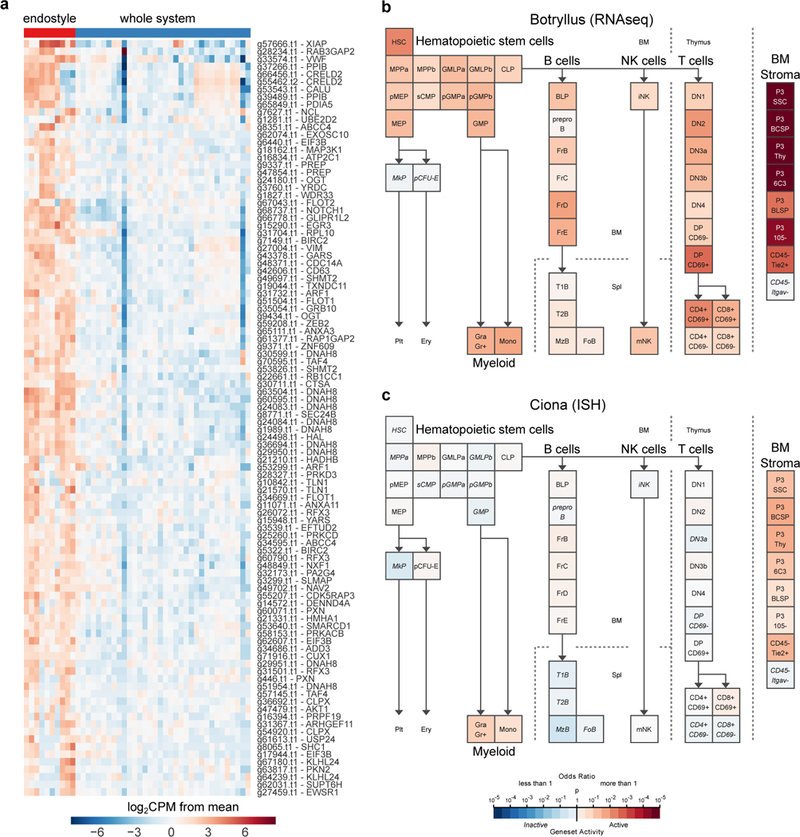
a, comparison between the transcriptome sequence data from ten samples of dissected endostyles and the transcriptome of 34 whole colonies revealed a list of 327 genes that were significantly upregulated in the endostyle with homology to genes expressed in human hematopoietic bone marrow, heatmap of the top 100 (by logFC) of the bone marrow-associated endostyle genes is presented. b, Geneset Activity Analysis of top 200 genes upregulated in the B. schlosseri endostyle associated with the blood system, found by RNAseq (this study) using the Gene Expression Commons tool on a mouse hematopoiesis model. The enriched populations are bone marrow stromal cells and HSCs c, Similar analysis, but for Ciona robusta based on previous in-situ work21 revealed enriched mouse bone marrow stromal cells as well, based on 188 genes that are expressed in C. robusta endostyle and are associate with the blood system.
Extended Data Figure 7. Discovery of a Myeloid Lineage Phagocytic Population.
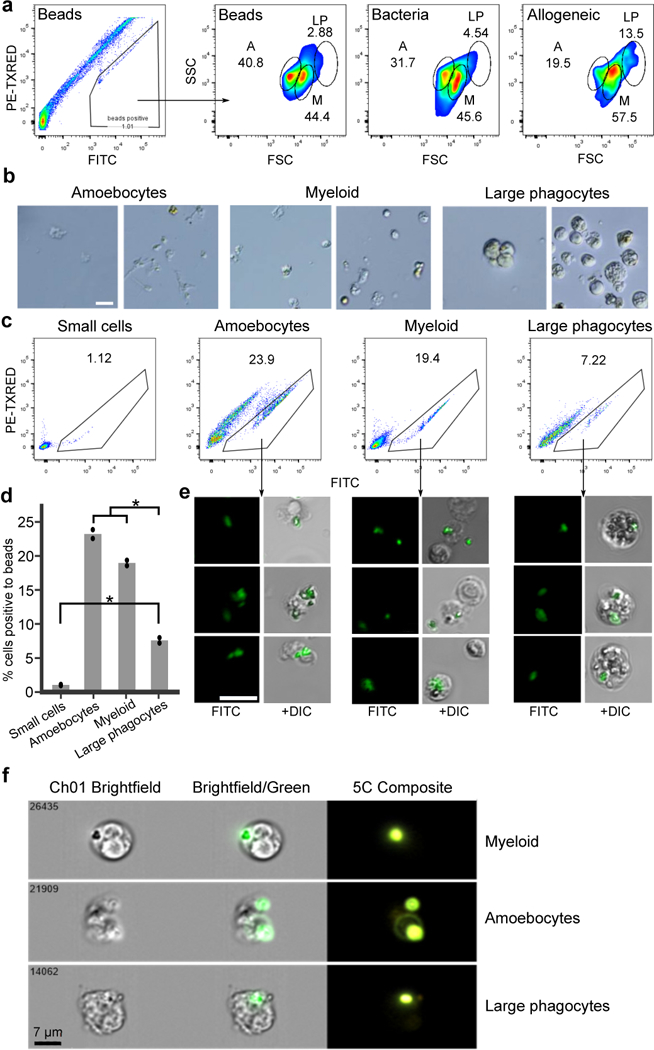
a, FACS analysis of B. schlosseri cells that are fluorescently positive in one of three phagocytosis assays performed: (first and second) phagocytosis of green fluorescent beads, (third) phagocytosis of Vibrio diazotrophicus labeled with AF647, and (fourth) allogeneic phagocytosis. Three phagocytic populations were identified: amoebocytes (A), myeloid cells (M), and large phagocytes (LP). Experiment was repeated twice. The myeloid cells were the main contributors to phagocytosis, as evident by >40% contribution to each of the phagocytosis assays. The large phagocytes contribute mainly to allogeneic phagocytosis compared to other assays. b, Live images of the three isolated phagocytic populations. Experiment was performed three times, scale bar 20 μm. c, We isolated the three main phagocytic populations and a small cell population (CP3) as a control, and incubated each one with fluorescent beads to validate engulfment capacity of each population. Experiment was repeated twice. FACS analysis of green fluorescent beads phagocytosis of sorted populations are shown. d, Amoebocytes, myeloid cells, and large phagocytes all had significantly higher engulfment rates than the small cell population. Moreover, amoebocytes, myeloid cells had significantly higher cell percentages than the large phagocyte population. Two samples of each sorted populations’ percentage analysis. Unpaired T-test, two-tailed *P<0.05, Mean. e, Representative confocal images of the three phagocytic populations after engulfment of beads. Scale bar 20 μm. f, ImageStream analysis confirmed that the three phagocytic populations assayed engulfed the beads. The positive cells have mainly morphology of: amoebocytes, myeloid cells, and large phagocytes. Experiment was performed once on ImageStream. Representative images of the three phagocytic populations after engulfment of beads. Scale bar 7 μm.
Extended Data Figure 8. Cytotoxicity and the two morphs of morula cells (MC) at point of rejection (POR).
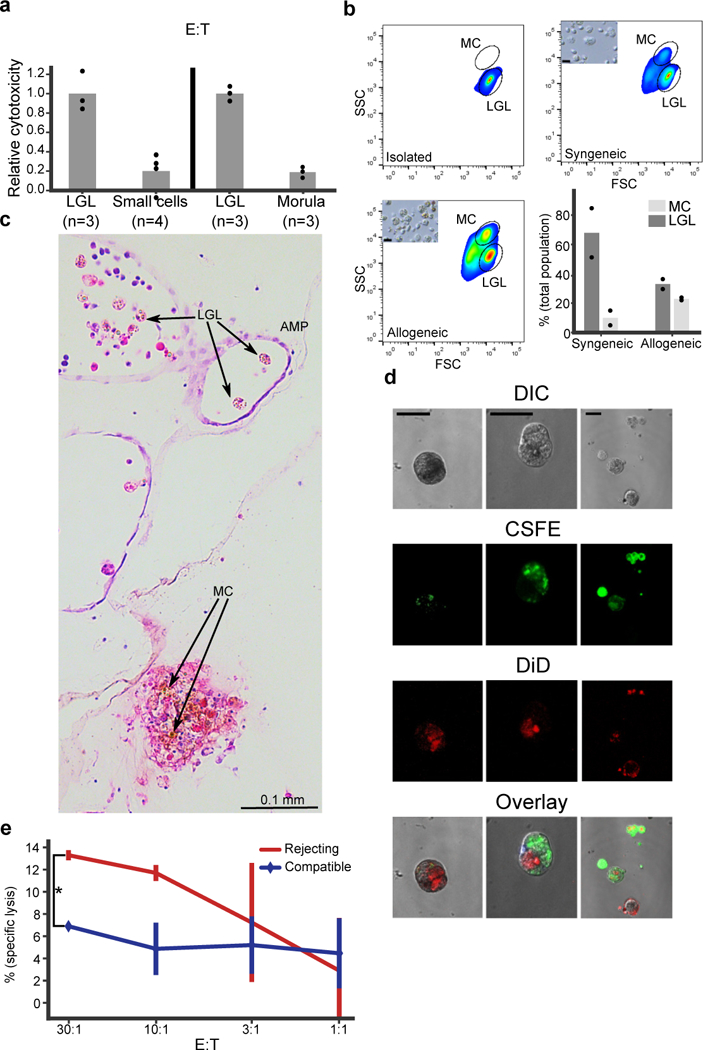
a, Cytotoxicity assays of isolated LGL cells compared to small cells, and to isolated MC. In both cases the LGL cells had significantly higher cytotoxicity compared to the other cell types. The experiment with isolated cells was performed twice with triplicates. Unpaired T-test, two-tailed *P=0.003, **P=0.0013, Mean. b, LGL cells were isolated (upper left) and incubated overnight either in syngeneic (upper right) or in allogeneic challenge (lower left). FSC/ SSC analysis of LGL cell (lower population) and MC (upper population). Small caption of light microscopy pictures of cells after the incubation. (Lower right) Analysis of LGL and morula cells in syngeneic compare to allogeneic challenge. Experiment was performed once with duplicates and validated by light microscopy. Mean. c, An H&E section of B. schlosseri colonies undergoing rejection. In the ampule (AMP) the inactivated form of cytotoxic MC/ large granular lymphocytes like cells (LGL) can be observed (left). On the other hand the activated form with the brown pigmentation of MC can be observed at POR (right). d, Confocal imagery of phagocytosis assays to validate the allogeneic engulfment. In the panels colony labeled with CFSE in green and colony labeled with DiD in red after allogeneic phagocytosis assay. Large phagocytic cells can be seen after engulfment of allogeneic cells or vesicles. Experiment of allogeneic phagocytosis validation by confocal imaging was performed twice. Scale bar 20 μm, e, Example of cytotoxicity assay in different Effector to Target ratios (E:T), where the targets are compatible or rejecting colony cells to the effector colony. In the rejecting colony, specific lysis is significantly higher. The experiment was performed three times with triplicates. ANOVA two-factor with replication, *P=0.0015, Mean, SD.
Extended data Table 1. Screened antibodies by CyTOF for binding of B. schlosseri cells.
A screen of 49 antibodies that would cross-react with B. schlosseri cells and could potentially differentiate cellular populations. Symbol: represents the element, mass: is the elemental isotope mass, antigen: is the human antigen against which the antibody was produced, antibody clone, and antibody supplier. CyTOF column represents whether the B. schlosseri cell population was positive or not, low means less than 1% of cells were positive. FACS column represents whether there was binding by the same antibody clone by flow cytometry.
| Symbol | Mass | Panel1 antigen |
Clone | Supplier | CyTOF | FACS | Panel2 antigen |
Clone | Supplier | CyTOF | FACS |
|---|---|---|---|---|---|---|---|---|---|---|---|
| Pd/Cd | 110–114 | CD3 | S4.1 | Invitrogen | Yes | No | |||||
| In | 113 | CD7 | M-T701 | BD | Yes | No | |||||
| In | 115 | CD45 | HI30 | Biolegend | Yes | No | |||||
| La | 139 | CD57 | HCD57 | Biolegend | Yes (low) | Yes (~14%) | CD2 | RPA-2.10 | Biolegend | Yes (low) | No |
| Pr | 141 | NKp46 | 195314 | R&D system | No | CD61 | VI-PL2 | Biolegend | No | ||
| Nd | 142 | CD48 | TU145 | BD | No | ||||||
| Nd | 144 | CCR5 | HEK/l/85a | Biolegend | Yes | N/A | CD94 | DX22 | Biolegend | Yes (low) | N/A |
| Nd | 145 | LILRB1 | 292319 | R&D | No | ||||||
| Nd | 146 | CD309 | 89106 | BD | No | ||||||
| Sm | 147 | CD8 | RPA-T8 | Biolegend | No | ||||||
| Nd | 148 | KIR3DL1 | DX9 | BD | No | CRTAM | Cr24.1 | Biolegend | No | ||
| Sm | 149 | DNAM1 | DX11 | BD | No | ||||||
| Eu | 151 | NKG2D | 1D11 | Biolegend | No | CD84 | CD84.1.21 | Biolegend | No | ||
| Sm | 152 | TNFR2 | 22235 | R&D | No | ||||||
| Eu | 153 | NKG2C | 134522 | R&D | Yes (low) | N/A | |||||
| Sm | 154 | NKp44 | P44–8 | Biolegend | No | Notchl | MHN1–519 | Biolegend | No | ||
| Gd | 155 | CRACC | 162.1 | Biolegend | No | ||||||
| Gd | 156 | KIR2DL3 | 180701 | R&D | No | ||||||
| Gd | 158 | CD161 | HP-3G10 | Biolegend | No | clecl2A | 50C1 | Biolegend | No | ||
| Tb | 159 | CDllc | Bul5 | Biolegend | No | ||||||
| Gd | 160 | NKp30 | 210845 | R&D | No | 2B4 | Cl.7 | Beckman | No | ||
| Dy | 161 | CD15 | W6D3 | Biolegend | No | CD4 | RPA-T4 | Biolegend | Yes | No | |
| Dy | 162 | CD49d | 9F10 | Biolegend | Yes | Yes (~28%) | |||||
| Dy | 163 | CD16 | 3G8 | Biolegend | No | KIR2DLS1 | EB6.B | Beckman | No | ||
| Er | 166 | TIGIT | M BSA43 | eBioscience | No | KIR3DL2 | DX31 | Gift from Dr. Lanier | No | ||
| Er | 167 | CD27 | 0323 | Biolegend | No | CCR7 | G043H7 | Biolegend | No | ||
| Er | 168 | KIR2DL1 | 143211 | R&D | No | CCR2 | 48607 | BD | Yes | No | |
| Er | 170 | CDlla | Hllll | Biolegend | No | CDllbact | CBRM1/5 | Biolegend | No | ||
| Yb | 172 | KIR2DL4 | 181703 | R&D | No | CD34 | 8G12 | BD | Yes (low) | N/A | |
| Yb | 173 | CD33 | WM53 | Biolegend | No | ||||||
| Yb | 174 | CD 144 | TEA1/31 | Beckman | No | NKG2A | Z199 | Beckman | No | ||
| Lu | 175 | KLRG1 | 13F12F2 | ThermoFisher | No | ||||||
| Yb | 176 | CD56 | NCAM16.2 | BD | Yes (low) | N/A | |||||
| Ir | 191/193 | DNA | Sigma | All cells | DNA | Sigma | All cells | ||||
| Pt | 195 | cisplatin | Sigma | No | Sigma |
Extended data Table 2. Flow cytometry binding of B. schlosseri cells, and references the phagocytic and cytotoxic cells in different organisms for Fig 4.
a, The column “% positive cells” is the percentage of the cells that were positively labeled by the marker. For Alkaline Phosphatase (AP), “high” _represents cells that labeled strongly and “mid”- cells that are positively labeled but not high. b, Rows contain references and any notes for each of the organisms reviewed in the production of Fig 4.
| a | ||
| Lectin | Fluorophore | % positive cells |
| ConA | AF-633 | 45% |
| PNA | PE-Cy7 | 16% |
| UEA | PE-Cy7 | 30% |
| Additional markers | ||
| Alkaline Phosphatase | Green | 9% high 25% mid |
| Anti-BHF polyclonal | AF-647 | 35% |
| b | ||
| Animal: | Phagocytic cells | Cytotoxic cells |
| Homo (human) | Myeloid lineage review52 | Review53 |
| Danio (zebrafish) | Myeloid lineage review54, phagocytosis55 | Recognition molecules56, cytotoxity55, cell types57 |
| Petromyzon (lamprey) | Myeloid lineage58 | Lymphoid lineage review59(cytotoxity was not shown) |
| Branchiostoma (lancelet) | Large phagocytes60, some suggestion of amoebocytes61 | |
| Strongylocentrotus (sea urchin) | Phagocytic cells review32 | Suggestion that colorless spherule cells are cytotoxic morula cells in review32 |
| Drosophila(fruit fly) | Amoebocytes62, plasmatocytes or pupal macrophage-like have resemblance to the large phagocytes63,64 | Crystal cells that contain the enzymes for melanization for cytotoxcity could resemble the morula cells at the enzymatc level63,64 |
| Limulus(horseshoe crab) | Amoebocytes and granular phagocytes in review33 | Cells with prophenoloxidase and melanization process in review3334 |
| Tridacna(clam) | Amoebocytes and eosinophilic granular hemocytes that resemble large phagocytes65 | Morulla cells65 |
Supplementary Material
Acknowledgments
The authors would like to thank Chris Lowe, Chiara Anselmi, Ivan Dimov, Seth Karten, Chris Patton, Judy Thompson, Patty Lovelace, Ronnie Voskoboynik, Nathaniel Fernhoff, Wan-Jin Lu, Pauline Chu, Kipp Weiskopf, Matan Oren, John Lee, Barbara Compton, Kevin Uhlinger, Tejaswitha Naik, and Terry Storm for invaluable technical advice and help. This study was supported by NIH grants R56AI089968, R01AG037968 and RO1GM100315 (to I.L.W., S.R.Q., and A.V.). The Virginia and D. K. Ludwig Fund for Cancer Research, a grant from the Siebel Stem Cell Institute and Stinehart-Reed grant (to I.L.W.). L.M. was supported by PRIN - Prot. 2015NSFHXF. B.R. was supported by the Postdoctoral Fellowship of the Human Frontier Science Program Organization LT000591/2014-L, the NIH Immunology training grant 5T32AI07290–28 and the NIH Hematology training grant T32 HL120824–03.
Footnotes
Sequencing Data
Sequencing data can be found on the NCBI Sequence Read Archive under accession PRJNA414486.
Data availability: Sequencing data can be found on the NCBI Sequence Read Archive under accession PRJNA414486. RPKM values of gene expression and differential expression analysis results are in Supplementary Table 1. All other relevant data are available in the manuscript.
Competing interests
The authors declare no competing interests.
References
- 1.Weissman IL Stem cells: units of development, units of regeneration, and units in evolution. Cell 100, 157–168 (2000). [DOI] [PubMed] [Google Scholar]
- 2.Sabbadin A Le basi genetiche della capacita di fusione fra colonies in Botryllus schlosseri (Ascidiacea). Rend Accad Naz Lincei Ser 8 32, 1031–1035 (1962). [Google Scholar]
- 3.Scofield VL, Schlumpberger JM, West LA & Weissman IL Protochordate allorecognition is controlled by a MHC-like gene system. Nature 295, 499–502 (1982). [DOI] [PubMed] [Google Scholar]
- 4.Stoner DS, Rinkevich B & Weissman IL Heritable germ and somatic cell lineage competitions in chimeric colonial protochordates. Proc Natl Acad Sci USA 96, 9148–9153 (1999). [DOI] [PMC free article] [PubMed] [Google Scholar]
- 5.Laird DJ, De Tomaso AW & Weissman IL Stem cells are units of natural selection in a colonial ascidian. Cell 123, 1351–1360 (2005). [DOI] [PubMed] [Google Scholar]
- 6.Voskoboynik A et al. Identification of the endostyle as a stem cell niche in a colonial chordate. Cell Stem Cell 3, 456–464 (2008). [DOI] [PMC free article] [PubMed] [Google Scholar]
- 7.Voskoboynik A et al. Identification of a colonial chordate histocompatibility gene. Science 341, 384–387 (2013). [DOI] [PMC free article] [PubMed] [Google Scholar]
- 8.Corey DM et al. Developmental cell death programs license cytotoxic cells to eliminate histocompatible partners. Proc Natl Acad Sci USA 113, 6520–6525 (2016). [DOI] [PMC free article] [PubMed] [Google Scholar]
- 9.Darwin C On the origin of the species by natural selection. (1859). [Google Scholar]
- 10.Delsuc F, Brinkmann H, Chourrout D & Philippe H Tunicates and not cephalochordates are the closest living relatives of vertebrates. Nature 439, 965–968 (2006). [DOI] [PubMed] [Google Scholar]
- 11.Voskoboynik A et al. The genome sequence of the colonial chordate, Botryllus schlosseri. elife 2, e00569 (2013). [DOI] [PMC free article] [PubMed] [Google Scholar]
- 12.Lauzon RJ, Patton CW & Weissman IL A morphological and immunohistochemical study of programmed cell death in Botryllus schlosseri (Tunicata, Ascidiacea). Cell Tissue Res. 272, 115–127 (1993). [DOI] [PubMed] [Google Scholar]
- 13.Hulett HR, Bonner WA, Barrett J & Herzenberg LA Cell sorting: automated separation of mammalian cells as a function of intracellular fluorescence. Science 166, 747–749 (1969). [DOI] [PubMed] [Google Scholar]
- 14.Ben-Ari Fuchs S et al. Geneanalytics: an integrative gene set analysis tool for next generation sequencing, rnaseq and microarray data. OMICS 20, 139–151 (2016). [DOI] [PMC free article] [PubMed] [Google Scholar]
- 15.Seita J et al. Gene Expression Commons: an open platform for absolute gene expression profiling. PLoS ONE 7, e40321 (2012). [DOI] [PMC free article] [PubMed] [Google Scholar]
- 16.Rinkevich Y et al. Repeated, long-term cycling of putative stem cells between niches in a basal chordate. Dev. Cell 24, 76–88 (2013). [DOI] [PMC free article] [PubMed] [Google Scholar]
- 17.Ermak TH The hematogenic tissues of tunicates. Phylogeny of thymus and bone marrow-bursa cells (1976). [Google Scholar]
- 18.Adams GB et al. Stem cell engraftment at the endosteal niche is specified by the calcium-sensing receptor. Nature 439, 599–603 (2006). [DOI] [PubMed] [Google Scholar]
- 19.Yusuf RZ & Scadden DT Homing of hematopoietic cells to the bone marrow. J. Vis. Exp. (2009). doi: 10.3791/1104 [DOI] [PMC free article] [PubMed] [Google Scholar]
- 20.Wright DE, Wagers AJ, Gulati AP, Johnson FL & Weissman IL Physiological migration of hematopoietic stem and progenitor cells. Science 294, 1933–1936 (2001). [DOI] [PubMed] [Google Scholar]
- 21.Ogasawara M et al. Gene expression profiles in young adult Ciona intestinalis. Dev. Genes Evol. 212, 173–185 (2002). [DOI] [PubMed] [Google Scholar]
- 22.Cañestro C, Bassham S & Postlethwait JH Evolution of the thyroid: anterior-posterior regionalization of the Oikopleura endostyle revealed by Otx, Pax2/5/8, and Hox1 expression. Dev. Dyn. 237, 1490–1499 (2008). [DOI] [PubMed] [Google Scholar]
- 23.Burighel P & Cloney RA in Microscopic anatomy of invertebrates (eds. Harrison FW & Ruppert EE) 221–347 (1997). [Google Scholar]
- 24.Ogasawara M, Lauro RD & Satoh N Ascidian homologs of mammalian thyroid transcription factor-1 gene are expressed in the endostyle. Zoological science (1999). [DOI] [PubMed] [Google Scholar]
- 25.Chen JY et al. Hoxb5 marks long-term haematopoietic stem cells and reveals a homogenous perivascular niche. Nature 530, 223–227 (2016). [DOI] [PMC free article] [PubMed] [Google Scholar]
- 26.Ballarin L & Cima F Cytochemical properties of Botryllus schlosseri haemocytes: indications for morpho-functional characterisation. European journal of histochemistry: EJH (2005). [PubMed] [Google Scholar]
- 27.Lauzon RJ, Brown C, Kerr L & Tiozzo S Phagocyte dynamics in a highly regenerative urochordate: insights into development and host defense. Dev. Biol. 374, 357–373 (2013). [DOI] [PubMed] [Google Scholar]
- 28.Franchi N & Ballarin L Immunity in protochordates: the tunicate perspective. Front. Immunol. 8, 674 (2017). [DOI] [PMC free article] [PubMed] [Google Scholar]
- 29.Oren M et al. Marine invertebrates cross phyla comparisons reveal highly conserved immune machinery. Immunobiology 218, 484–495 (2013). [DOI] [PubMed] [Google Scholar]
- 30.Timonen T, Ortaldo JR & Herberman RB Characteristics of human large granular lymphocytes and relationship to natural killer and K cells. J. Exp. Med. 153, 569–582 (1981). [DOI] [PMC free article] [PubMed] [Google Scholar]
- 31.Ljunggren HG & Kärre K In search of the “missing self”: MHC molecules and NK cell recognition. Immunol. Today 11, 237–244 (1990). [DOI] [PubMed] [Google Scholar]
- 32.Smith LC, Ghosh J, Buckley KM, Clow LA & et al. in Invertebrate Immunity (ed. Söderhäll K) 260–301 (Springer, 2010). [Google Scholar]
- 33.Kawabata S in Invertebrate Immunity (ed. Söderhäll K) 122–136 (Springer, 2010). [Google Scholar]
- 34.Ballarin L Ascidian cytotoxic cells: state of the art and research perspectives. Inv. Surv. J (2012). [Google Scholar]
Extended References
- 35.Boyd HC, Brown SK, Harp JA & et al. Growth and sexual maturation of laboratory-cultured Monterey Botryllus schlosseri. Biol Bull 170, 91–109 (1986). [Google Scholar]
- 36.Taketa DA & De Tomaso AW Botryllus schlosseri allorecognition: tackling the enigma. Dev. Comp. Immunol. 48, 254–265 (2015). [DOI] [PMC free article] [PubMed] [Google Scholar]
- 37.Bendall SC et al. Single-cell mass cytometry of differential immune and drug responses across a human hematopoietic continuum. Science 332, 687–696 (2011). [DOI] [PMC free article] [PubMed] [Google Scholar]
- 38.Koh PW et al. An atlas of transcriptional, chromatin accessibility, and surface marker changes in human mesoderm development. Sci. Data 3, 160109 (2016). [DOI] [PMC free article] [PubMed] [Google Scholar]
- 39.Burighel P & Brunetti R The circulatory system in the blastozooid of the colonial ascidian Botryllus schlosseri (Pallas). Italian Journal of Zoology (1971). [Google Scholar]
- 40.Zaniolo G, Lane NJ, Burighel P & Manni L Development of the motor nervous system in ascidians. J. Comp. Neurol. 443, 124–135 (2002). [DOI] [PubMed] [Google Scholar]
- 41.Edri-Brami M et al. Glycans in sera of amyotrophic lateral sclerosis patients and their role in killing neuronal cells. PLoS ONE 7, e35772 (2012). [DOI] [PMC free article] [PubMed] [Google Scholar]
- 42.Sabbadin A & Graziani G Microgeographical and ecological distribution of colour morphs of Botryllus schlosseri (Ascidiacea). Nature 213, 815–816 (1967).6031815 [Google Scholar]
- 43.Cima F et al. Life history and ecological genetics of the colonial ascidian Botryllus schlosseri. Zoologischer Anzeiger - A Journal of Comparative Zoology 257, 54–70 (2015). [Google Scholar]
- 44.Laird DJ & Weissman IL Continuous development precludes radioprotection in a colonial ascidian. Developmental & Comparative Immunology (2004). [DOI] [PubMed] [Google Scholar]
- 45.Braden BP et al. Vascular regeneration in a basal chordate is due to the presence of immobile, bi-functional cells. PLoS ONE 9, e95460 (2014). [DOI] [PMC free article] [PubMed] [Google Scholar]
- 46.Köster J & Rahmann S Snakemake--a scalable bioinformatics workflow engine. Bioinformatics 28, 2520–2522 (2012). [DOI] [PubMed] [Google Scholar]
- 47.Bolger AM, Lohse M & Usadel B Trimmomatic: a flexible trimmer for Illumina sequence data. Bioinformatics 30, 2114–2120 (2014). [DOI] [PMC free article] [PubMed] [Google Scholar]
- 48.Magoč T & Salzberg SL FLASH: fast length adjustment of short reads to improve genome assemblies. Bioinformatics 27, 2957–2963 (2011). [DOI] [PMC free article] [PubMed] [Google Scholar]
- 49.Langmead B & Salzberg SL Fast gapped-read alignment with Bowtie 2. Nat. Methods 9, 357–359 (2012). [DOI] [PMC free article] [PubMed] [Google Scholar]
- 50.Li H & Durbin R Fast and accurate long-read alignment with Burrows-Wheeler transform. Bioinformatics 26, 589–595 (2010). [DOI] [PMC free article] [PubMed] [Google Scholar]
- 51.Robinson MD, McCarthy DJ & Smyth GK edgeR: a Bioconductor package for differential expression analysis of digital gene expression data. Bioinformatics 26, 139–140 (2010). [DOI] [PMC free article] [PubMed] [Google Scholar]
- 52.Wolff L & Humeniuk R Concise review: erythroid versus myeloid lineage commitment: regulating the master regulators. Stem Cells 31, 1237–1244 (2013). [DOI] [PubMed] [Google Scholar]
- 53.Rosental B et al. The effect of chemotherapy/radiotherapy on cancerous pattern recognition by NK cells. Curr. Med. Chem. 19, 1780–1791 (2012). [DOI] [PubMed] [Google Scholar]
- 54.Potts KS & Bowman TV Modeling myeloid malignancies using zebrafish. Front. Oncol. 7, 297 (2017). [DOI] [PMC free article] [PubMed] [Google Scholar]
- 55.Moss LD et al. Identification of phagocytic cells, NK-like cytotoxic cell activity and the production of cellular exudates in the coelomic cavity of adult zebrafish. Dev. Comp. Immunol. 33, 1077–1087 (2009). [DOI] [PubMed] [Google Scholar]
- 56.Wei S et al. The zebrafish activating immune receptor Nitr9 signals via Dap12. Immunogenetics 59, 813–821 (2007). [DOI] [PMC free article] [PubMed] [Google Scholar]
- 57.Tang Q et al. Dissecting hematopoietic and renal cell heterogeneity in adult zebrafish at single-cell resolution using RNA sequencing. J. Exp. Med. 214, 2875–2887 (2017). [DOI] [PMC free article] [PubMed] [Google Scholar]
- 58.Han Q et al. Characterization of Lamprey IL-17 Family Members and Their Receptors. J. Immunol. 195, 5440–5451 (2015). [DOI] [PMC free article] [PubMed] [Google Scholar]
- 59.Hirano M, Das S, Guo P & Cooper MD 4 The Evolution of Adaptive Immunity in Vertebrates. Advances in immunology (2011). [DOI] [PubMed] [Google Scholar]
- 60.Han Y, Huang G, Zhang Q, Yuan S & Liu J The primitive immune system of amphioxus provides insights into the ancestral structure of the vertebrate immune system. Developmental & … (2010). [DOI] [PubMed] [Google Scholar]
- 61.Rhodes CP, Ratcliffe NA & Rowley AF Presence of coelomocytes in the primitive chordate amphioxus (Branchiostoma lanceolatum). Science 217, 263–265 (1982). [DOI] [PubMed] [Google Scholar]
- 62.Muñoz-Chápuli R, Carmona R, Guadix JA, Macías D & Pérez-Pomares JM The origin of the endothelial cells: an evo-devo approach for the invertebrate/vertebrate transition of the circulatory system. Evol. Dev. 7, 351–358 (2005). [DOI] [PubMed] [Google Scholar]
- 63.Lanot R, Zachary D, Holder F & Meister M Postembryonic hematopoiesis in Drosophila. Dev. Biol. 230, 243–257 (2001). [DOI] [PubMed] [Google Scholar]
- 64.Meister M & Lagueux M Drosophila blood cells. Cell. Microbiol. 5, 573–580 (2003). [DOI] [PubMed] [Google Scholar]
- 65.Nakayama K, Nomoto AM & Nishijima M Morphological and Functional Characterization of Hemocytes in the Giant ClamTridacna crocea. Journal of invertebrate … (1997). [DOI] [PubMed] [Google Scholar]
Associated Data
This section collects any data citations, data availability statements, or supplementary materials included in this article.


