

Abstract
Introduction
Malignant pleural mesothelioma is a disease primarily associated with exposure to the carcinogen asbestos. Whereas other carcinogen-related tumors are associated with a high tumor mutation burden, mesothelioma is not. We sought to resolve this discrepancy.
Material and Methods
We used mate-pair (n=22), RNA (n=28) and T cell receptor sequencing along with in silico predictions and immunologic assays to understand how structural variants of chromosomes affect the transcriptome.
Results
We observed that inter- or intra-chromosomal rearrangements were present in every specimen and were frequently in a pattern of chromoanagenesis such as chromoplexy or chromothripsis. Transcription of rearrangement-related junctions was predicted to result in many potential neoantigens, some of which were proven to bind patient-specific MHC molecules and to expand intratumoral T cell clones. T cells responsive to these predicted neoantigens were also present in a patient’s circulating T cell repertoire. Analysis of genomic array data from the mesothelioma cohort in The Cancer Genome Atlas suggested that multiple chromothriptic-like events negatively impact survival.
Discussion
Our findings represent the discovery of potential neoantigen expression driven by structural chromosomal rearrangements. These results may have implications for the development of novel immunotherapeutic strategies and the selection of patients to receive immunotherapies.
Introduction
Malignant pleural mesothelioma (MPM) is characterized by exposure to the carcinogen asbestos1, although some cases develop after therapeutic radiation or are inherited due to loss of function mutations in BRCA1 Associated Protein 1 (BAP1)2. Consistent with the carcinogenicity of asbestos, previous cytogenetic studies identified recurrent, structural chromosomal abnormalities in MPM3–5. More recent studies that used next-generation sequencing (NGS) to evaluate single nucleotide variation mutations in MPM reported a very low mutation burden overall6. This finding was unexpected because other tumors associated with carcinogenic exposure such as malignant melanoma and non-small cell lung cancer (NSCLC) typically have a high mutation burden from ultraviolet radiation and tobacco exposure respectively7. Since a high tumor mutation burden and an increase in predicted neoantigens has been linked to favorable responses to immune checkpoint inhibitors of programmed cell death 1 ligand 1 (PD-L1) or its receptor PD-1, and given that response rates are similar between patients with MPM or NSCLC in second or later lines of therapy treated with these inhibitors8–11, we hypothesized that chromosomal rearrangements that may not be detected by conventional exon-based paired-end sequencing techniques may result in expression of additional neoantigens in MPM.
Mate-pair sequencing (MPseq) differs from standard NGS approaches by tiling the whole genome with larger fragments (2–5kb) to reliably detect structural variants such as insertions, deletions and rearrangements12. We previously used MPseq to determine the lineage relationships of multifocal lung cancer13, to identify a chromoplectic ALK rearrangement in an inflammatory myofibroblastic tumor14, to discover recurrent t(6:7)(p25.3;q32.3) translocations in “ALK-negative” anaplastic large cell lymphomas15 and for other purposes16, 17. Recently, we have also integrated MPseq with RNA sequencing (RNAseq) to identify transcribed chromosomal rearrangements in peripheral T cell lymphomas18.
In order to resolve the reported discrepancy between the numerous chromosomal abnormalities detected by cytogenetics and the low mutation burden detected by standard exome sequencing in MPM we leveraged MPseq and RNAseq to detect transcribed structural variants. We hypothesized that this method would identify expression of rearrangement-related peptides with neoantigenic potential and define a novel mechanism of tumor immunogenicity that may not be detected with standard sequencing approaches.
Methods
Patients
Twenty-eight cases of frozen MPM specimens that were collected through the Mayo Clinic Thoracic Specimen Registry or routine clinical care were identified, retrieved and reviewed. These specimens were obtained prior to the administration of any systemic therapy. The diagnosis of MPM and the subtype of each case were verified by a pathologist (JCC or MCA). Patient characteristics are presented in Supplemental Table 1.
Tissue extraction and next generation sequencing
Tumor DNA and RNA were extracted independently from each fresh frozen clinical specimen using the DNeasy Blood and Tissue kit (Qiagen, CA, #69504) or RNeasy Plus Mini kit (Qiagen, CA, #74134), respectively, following established protocols. Total RNA and DNA yields and concentrations were determined by Qbit. Indexed libraries for MPseq (1µg DNA) and RNAseq (100ng total RNA) were generated using the Nextera Mate-Pair Kit (Illumina, CA, FC-132–1001) or the TruSeq RNA Access Library Prep Kit (Illumina, CA, RS-301–2001), as previously described, following the manufacturer’s instructions16. Libraries were sequenced on the Illumina HiSeq4000 platform at a depth of four or seven libraries per lane, respectively.
Bioinformatics
MPseq:
Data were processed using previously described binary indexing mapping algorithms developed in our group19. The read-to-reference-genome-mapping algorithm was modified to map both MP reads across the whole genome. Discordant mapping MP reads covered by at least five associates were identified for further analysis. Concordant mapping MP reads were used to determine frequency coverage levels across the genome19. We recently published (1) how MPseq provides comparable sensitivity to the state-of-the-art chromosomal microarray technology for the detection of copy number variations, with the benefit of improved breakpoint resolution20, (2) how use of an internal database of polymorphisms is used to mask germline events21, (3) and that display of MPseq results with a U plot which provides enhanced resolution of rearrangements and copy number variations than some other commonly used displays22. Germline events were filtered with this mask.
RNAseq:
Transcriptome analyses were performed in the R/Bioconductor environment (https://www.bioconductor.org/). Paired end sequence fragments were aligned by the tophat aligner using the latest genome reference file (hg38) and the ensemble annotation database. Sorted “sam” files were input to the htseq program to calculate expression levels of genes in each sample. Finally, the “.count” files from the previous step were used by the edgeR program to generate a normalized expression matrix for all 28 samples. The data presented are from the 22 specimens with accompanying MPseq data.
Validation of rearrangements and fusion transcripts
Primers spanning the detected fusion junctions were used in DNA and cDNA PCR validations (25 µl reaction volumes, 50 ng Template, 35 cycles) using EasyA high fidelity polymerase (Stratagene, #600404). DNA PCR validations were carried out on tumor DNA and a pooled human genomic DNA control (Promega, #G304A). 700ng of total RNA was reverse transcribed into cDNA using Random Hexamers (Invitrogen, #N8080127) and Superscript III (Invitrogen, #18080093). An unrelated case, ME025, was used as a negative control for RNA validations. BetaActin control PCRs were carried out using standard primers. Junctions were confirmed in both DNA and cDNA with Sanger Sequencing of PCR products. DNA/cDNA was electrophoresed on a 4% agarose gel and visualized with ethidium bromide.
HLA Typing
HLA typing was performed computationally directly from RNAseq sequencing data. An HLA-specific reference genome consisting of class I HLA sequences was created from the IPD-IMGT/HLA database (release 3.29.0). This reference file was used as input to a TopHat alignment of the RNAseq reads. All reads that aligned to the HLA sequences were taken and curated to remove all secondary alignments, low quality mapping reads, replicates, and reads that contained insertions or deletions. The remaining primary, high quality reads were used to create a sequence alignment for each position in the HLA being typed. Any position found to have <90% consensus for a particular nucleotide was considered a position of allelic variation. Using these positions of allelic variation, haplotype phasing was performed in order to produce consensus sequences for the two HLA alleles. Only positions with high read depth coverage (>1000) were used for final typing. The final typing results provided a full list of HLA sequences that matched the consensus sequence with 100% sequence identity.
MPseq-RNAseq-HLA matching-neo antigenicity
Potentially altered peptides that could include expressed neoantigens were first identified by integrating DNA junction data, derived from MPseq, with expression data, derived from RNAseq data. MPseq and RNAseq sequences were mapped by BIMA19 and mapped with svatools and junctions were identified from each case. An algorithm in R was developed to go through each junction and uncover pair-ends from the corresponding RNAseq data file that span the two regions. To accommodate for splicing the region windows were 1Mb. A lower threshold of at least two independent pair ends spanning the regions was required. The paired end sequences from RNAseq were aligned with each other to develop a consensus sequence, which then was translated to amino acid sequence. The aberrant part of that sequence was provided to the step below to predict the neoantigens.
Antigen Presentation Prediction Methods
Prospective neoantigens were identified through application of software tools that predict proteasome cleavage, TAP transport, binding of peptide in HLA molecules, and immunogenicity. For each peptide product inferred from an unambiguous reading frame, constitutive proteasome cleavage and TAP transport was predicted for each 9- to 11-mer using the 2013–02-22 version of the Immune Epitope Database (IEDB) MHC-I Processing Prediction tool23. Binding affinity of each peptide to the individual’s HLA molecules was predicted using NetMHC-4.024, 25 and relative binding affinity was assessed using the percentile rank measure. Binders were defined as having a binding rank in the 98th percentile, and strong binders in the 99.5th percentile. Immunogenic reactivity with T cell receptors was predicted using the class I Immunogenicity predictor hosted by the IEDB26, which compares the residues at key contact positions with those known to engage with T cell receptors in immunogenic epitopes.
Antigen Processing Pathway
Antigens presented in HLA class I molecules are derived from cytosolic proteins that are cleaved into short peptide sequences in the proteasome, and then loaded into the HLA molecules by tapasin binding protein (TAP). The sites at which proteasomes tend to cleave are relatively conserved, and multiple cleavage site prediction tools have been developed. The Immune Epitope Database (IEDB) hosts a MHC-I Processing Predictions tool that predicts proteasome cleavage sites and TAP binding affinity, which returns a Processing Score that estimates the relative quantity of peptide yielded by these processes (http://tools.iedb.org/processing/). It further incorporates HLA:peptide binding predictions, using a user-specified tool. The processing score for this analysis was done using NetMHC.
Immunogenicity
IEDB also hosts a tool that predicts the likelihood that an HLA:peptide complex will be recognized by a T cell receptor based on amino acid properties, position of the residue in the peptide, and HLA allele (http://tools.iedb.org/immunogenicity/). This was developed based on observations that larger and more aromatic residues tended to increase the likelihood of TCR interaction in a consistent manner, namely that particular features at different residue positions favored T cell interaction. Higher ratings indicate prediction of more TCR interaction, though the authors demonstrate that simply having a positive immunogenicity score is sufficient. The data set used to train this tool contained only 9mer peptides, although it extends its predictions to larger sizes as well.
Peptide synthesis
Peptides NYLETTSDF, NYLETTSDFHF and CYGETYQNI were synthesized by Fmoc solid phase methods on preloaded Wang resin (Anaspec, Inc.) by Mayo Clinic’s Medical Genome Facility’s Peptide Synthesis Services. Each peptide chain was assembled from Nα-Fmoc protected amino acids on a Liberty Blue Microwave-Assisted Peptide Synthesizer (CEM Corp.) according to the manufacturer’s coupling and deprotection protocols. After synthesis each peptide was deprotected and removed from its resin support by acidolysis with a solution of trifluoroacetic acid containing 2.5 % water (v/v) and 2.5% triisopropylsilane (v/v) and 2.5% 3,6, dioxa-1,8-octanedithiol (v/v) for 30min at 42C. The crude peptide was then purified by preparative RP-HPLC using an aqueous acetonitrile gradient containing 0.1 % TFA (v/v) on a reverse-phase C18 column (Phenomenex Jupiter 15µ; 250 × 21.2 mm). The mass weight was verified by LC-ESI mass spectrometry on an Agilent 6224 TOF LC/MS instrument. Peptide homogeneity was confirmed by analytical RP-HPLC and was 99.9%, 95.5%, and 98.2% for NYLETTSDF, NYLETTSDFHF and CYGETYQNI respectively.
MHC peptide binding assay
Peptides NYLETTSDF, NYLETTSDFHF and CYGETYQNI were assembled with allele HLA-A*24:02 and analyzed using an MHC-peptide binding assay (ProImmune REVEAL®, ProImmune Ltd. Oxford, United Kingdom) to determine their level of incorporation into MHC molecules. Binding to MHC molecules was compared to that of a known T-cell epitope, a positive control peptide, with very strong binding properties. A binding score for each MHC-peptide complex was calculated by comparison to the binding of the relevant positive control. Experimental standard error was obtained by triplicate positive control binding experiments.
TCRseq
T cell receptor profiling was performed per protocol with ImmunoSEQ (Adaptive Biotechnologies, hsTCRβ Kit) as we have done previously27. The number of productive T cell clones was used to determine Pielou’s Evenness Index (j’) in order to understand whether T cell clones were equally distributed amongst specimens28. This is defined as
| (1) |
Where H′ represents the Shannon Diversity Index29
| (2) |
and is the richness (number of unique, productive T cell clones). Productive Clonality is the inverse of Pielou’s Evenness Index and ranges from 0 to 1, where 0 represents an even distribution of clones and 1 represents an uneven distribution of clones (aka clonal expansion).
PBMC preparation and cryopreservation
PBMCs were isolated by Ficoll density gradient centrifugation. PBMCs were cryopreserved in liquid nitrogen at 10 million PBMCs/ml in RPMI containing 10% (vol/vol) DMSO, 110 mg/ml human serum albumin, and 2.7 mg/ml HEPEs.
Interferon-γ ELIspot
In 96-well plates, 2.5 × 10⁵ PBMCs per well plus different stimuli (media alone or media and one of the following peptides at 10mg/ml: irrelevant cyclin D1 peptide control, MELLLVNKLKWNLAA, LASELREGF, YSTARALYL, KSDPYSTARYH, TALLPPAAL, TARYHSTLL, KSDPYSTAL, FFSLASFKM, DPYSTARAL) were added in 200 µL media (5% human sera + RPMI) and incubated at 37ºC for 24 hours. Each sample was done in duplicate. ELIspot plates (Millipore, Billerica, MA) were coated with 10 µg/mL IFN-γ capture antibody (MabTech USA, Mariemont, OH) and incubated overnight. After 24 hours, the ELIspot plates were washed with PBS and blocked with media for 2 hours. The PBMCs and supernant were transferred from the 96-well plates to the ELIspot plates and incubated at 37ºC for 24 hours. After washing with PBS containing 0.05% Tween-20, 2 µg/mL of biotinylated secondary antibody for IFN-γ (MabTech USA, Mariemont, OH) was added and the plates were incubated for 2 hours at 37 ºC followed by another wash. Next, 1 µL of Streptavidin-horseradish peroxidase (BD Pharmingen, San Diego, CA) per mL of 10% FBS in phosphate-buffered saline (PBS) was added and the plates were incubated for 1 hour at room temperature. For the final wash, plates were first washed with PBS containing 0.05% Tween-20, followed by washing with PBS. Plates were developed by adding 20 µL of AEC (3-amino-9-ethyl-carbazole) chromogen per mL of AEC substrate (Sigma-Aldrich) and the reaction was stopped with water. After drying overnight, the plates were read on an AID EliSpot reader (San Diego, CA), which provides quantitative spot information based on the number of stimulated cells that secrete IFN-γ.
The Cancer Genome Atlas (TCGA)
We analyzed the mesothelioma cohort from TCGA with an algorithm (CTLPScanner) that uses a sliding window scan statistic to identify events consistent with CTLPs30, 31. Our cutoffs for CTLP of copy number variation ≥ 20 and a log10 likelihood ratio ≥ 8 were derived from a clinical training set previously described, and are the default values for CTLPScanner 30, 31. The “survival” package in R was used to create the Kaplan-Meier survival figure. Cox proportional hazards model was used to assess the effects of histology and CTLP on survival using JMP Pro 13.0.0 (SAS Institute Inc. Cary, N.C. U.S.A.). Fisher’s exact test with a two-tailed p-value was used to compare proportions of cases with CTLPs between histologists.
Immunohistochemistry for CD3
IHC for CD3 was performed as we have done previously27, 32–34. Blocks were sectioned at 5 microns. Deparaffinization and IHC staining were performed on-line. Staining for CD3 was performed on the Ventana Benchmark XT (Ventana Medical Systems, Tucson, Arizona). CD3, Mouse Monoclonal (Clone LN10, Leica, Buffalo, IL, #NCL-L-CD3–565) was diluted 1/250 and incubated for 15 minutes at 37°C. OptiView DAB (Ventana Medical Syst ems, Tucson, Arizona) was used for detection. Normal tonsil was used as positive control and normal tonsil without primary antibody was used as a negative control. The number of CD3+ tumor-infiltrating lymphocytes were counted and averaged over three high-powered fields.
Statistics and data presentation
To compare the frequency of chromosomal rearrangements, novel gene fusions or predicted neoantigens between epithelioid and biphasic or sarcomatoid subtypes of MPM we used the Mann-Whitney test. The correlation between PD-L1 expression (normalized expression determined by RNAseq) with genomic features and survival were determined with non-parametric Spearman correlation and were two-tailed. The numbers of spots detected by ELIspot were first compared with a one-way ANOVA. Because of the significant finding, multiple comparisons between the control and each peptide were made with Dunnett’s test. Multiplicity adjusted P values were used to determine significance. Survival was estimated with the Kaplan-Meier methods for the TCGA mesothelioma dataset. PRISM 7 for Windows (GraphPad La Jolla, CA) was used for all tests and their related graphs unless otherwise described.
Results
To evaluate whether chromosomal rearrangements result in expression of potential neoantigens in MPM, we analyzed twenty-eight frozen MPM specimens collected at Mayo Clinic by MPseq and RNAseq. Twenty-two of these specimens had sufficient DNA for analysis by MPseq and twenty-eight specimens had sufficient RNA for analysis by RNAseq. We identified numerous chromosomal rearrangements in the majority of specimens. Amongst these 22 specimens there were 1535 chromosomal rearrangements (median 41, range 3–298; Table 1), that resulted in junctions or novel fusions of non-coding DNA or genes. Six-hundred thirty-seven of these rearrangements (median 22, range 5–103 range) resulted in novel fusions of genes. Junction-guided analysis of RNAseq expression data predicted that these junctions could result in the expression of 179 novel amino acid sequences (median 5, range 0–51) that are potential neo-antigens (Figure 1). There were no significant differences in the frequency of chromosomal rearrangements (p=0.75), novel gene fusions (p=0.57) or predicted neoantigens (p=0.19) between epithelioid (n=11) and biphasic or sarcomatoid (n=10) subtypes of MPM. The predicted neoantigens were unique to each case. There was no correlation between PD-L1 (normalized expression determined by RNAseq) and chromosomal rearrangements (Spearman r=0.26, p=0.28), novel gene fusions (Spearman r=0.41, p=0.09) or predicted neoantigens (Spearman r=0.38, p=0.11). As expected, there was a negative correlation with PD-L1 expression and survival (Spearman r= −0.79, p<0.0001).
Table 1 –
Summary of patterns of chromoanagenesis
| Specimen # | Junctions | Chromothripsis | Chromoplexy |
|---|---|---|---|
| ME015 | 3 | 0 | 0 |
| ME016 | 4 | 0 | 0 |
| ME025 | 7 | 0 | 0 |
| ME017 | 11 | 0 | 0 |
| LU-3127 | 18 | 0 | 0 |
| LU-3396 | 22 | 0 | 0 |
| ME021 | 22 | 0 | 0 |
| ME027 | 30 | 0 | 0 |
| ME026 | 37 | 0 | 0 |
| LU-3023 | 38 | 2 | 0 |
| LU-2951 | 40 | 0 | 0 |
| LU-1304904895 | 40 | 0 | 1 |
| LU-2687 | 58 | 2 | 1 |
| LU-2578 | 74 | 0 | 1 |
| LU-1416305913 | 83 | 2 | 1 |
| ME018 | 103 | 2 | 0 |
| ME028 | 120 | 4 | 1 |
| ME020 | 125 | 2 | 1 |
| LU-0179 | 128 | 2 | 1 |
| ME022 | 136 | 2 | 1 |
| LU-2232 | 138 | 4 | 1 |
| LU-0727 | 298 | 1 | 0 |
Specimens are ordered by increasing number of junctions (genomic rearrangements) detected by MPseq and their associated patterns of chromoanagenesis if present.
Figure 1.
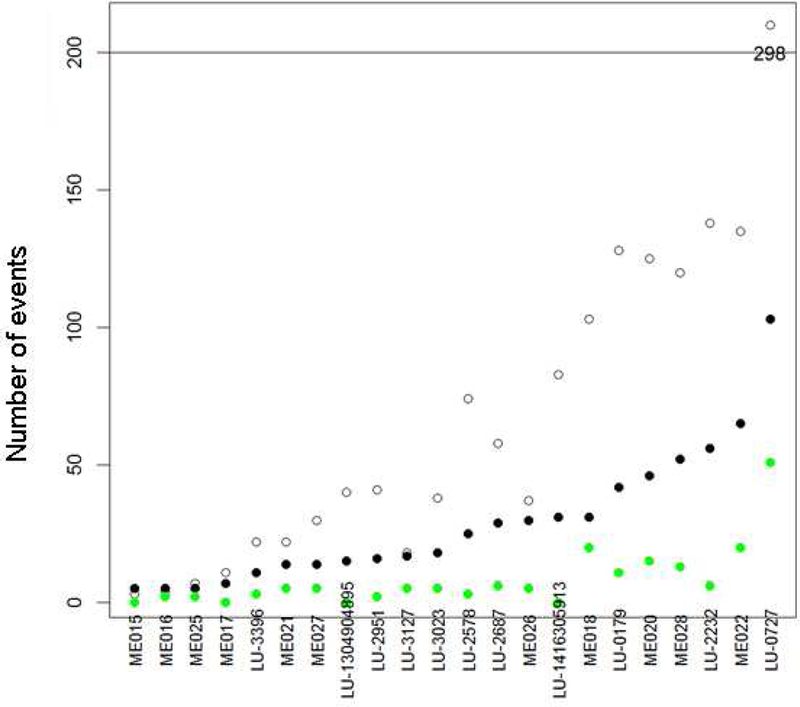
Genomic event summary
The unfilled circles represent the number of MPseq-detected junctions (rearrangements), the black circles represent the number rearrangements involving genes, and the green circles represent the number of peptides that are potential neoantigens.
We further characterized the abnormalities detected by MPseq and observed that many rearrangements were part of a pattern of chromoanagenesis35 consistent with chromothripsis (present in 10/22 specimens, 45%), chromoplexy (present in 9/22 specimens, 41%), or both (present in 7/22 specimens, 32%; Table 1). In nine out of ten cases with chromothripsis, there were multiple chromothriptic events. Twelve of the 22 (55%) specimens contained at least one chromoanagenic event with 0 to 4 events of chromothripsis (median = 0, mean = 1) and 0 to 1 (median 0, mean = 0.4) events of chromoplexy in each specimen. Chromothripsis most commonly involved chromosomes 2, 3, 6, 7 and 17 whereas chromoplexy involved multiple chromosomes including rearrangements between chromosomes 8 and 19, 2 and 9, or others (Supplemental Figure 1). In some cases, chromoplectic events were associated with chromothripsis (Figure 2, Supplemental Figures 2–23). These chromosomal rearrangements were associated with amplifications and deletions of many chromosomal segments, affecting genes such as CDKN2A and NF2 at similar rates as reported by others (Supplemental Table 2 and Figure 24). The genes most frequently involved with chromosomal rearrangements were RBFOX1, PARK2, PTPRD, CTNNA3 and ANKS1B (Table 2).
Figure 2.
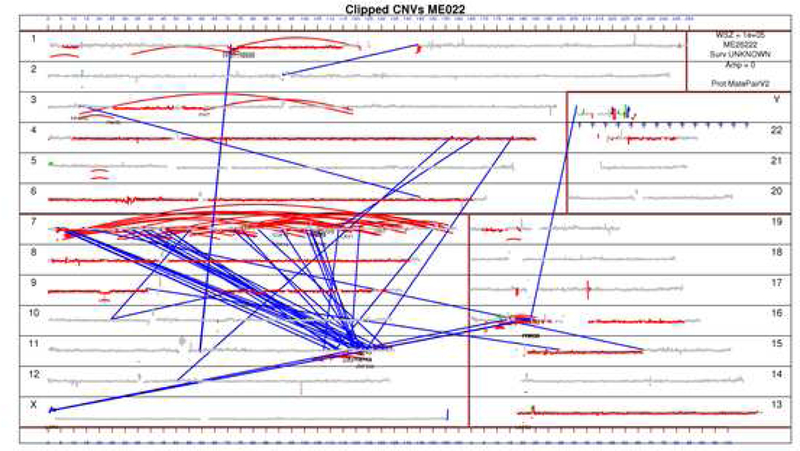
Genome plot for ME022
In this genome plot of specimen ME022 the chromosomes are plotted in order by size as numbered near the margins. Curved red lines represent intrachromosomal rearrangements whereas blue lines represent interchromosomal rearrangements. Accordingly, the multiple red lines on chromosome 7 represent chromothripsis and the blue lines between chromosome 7 and 11 represent chromoplexy.
Table 2:
Summary of genes most commonly involved with rearrangements
| Gene name | N (%) | chromosome |
|---|---|---|
| RBFOX1 | 11 (50) | 16 |
| PARK2 | 4 (18) | 6 |
| PTPRD | 4 (18) | 9 |
| CTNNA3 | 4 (18) | 10 |
| ANKS1B | 4 (18) | 12 |
| ABGL4 | 3 (14) | 1 |
| SMYD3 | 3 (14) | 1 |
| LRP1B | 3 (14) | 2 |
| FHIT | 3 (14) | 3 |
| PTPRG | 3 (14) | 3 |
| ANK2 | 3 (14) | 4 |
| MMS22L | 3 (14) | 6 |
| BBS9 | 3 (14) | 7 |
| AUTS2 | 3 (14) | 7 |
| SLC24A2 | 3 (14) | 9 |
| MLLT3 | 3 (14) | 9 |
| LINC01239 | 3 (14) | 9 |
| LINCO2 | 3 (14) | 9 |
| CDH13 | 3 (14) | 16 |
| MACROD2 | 3 (14) | 20 |
The genes most commonly involved with rearrangements in the 22 MPM specimens as determined by MPseq and their chromosomal locations are summarized.
To determine whether transcription of chromosomal rearrangement-related junctions have neoantigenic potential, we focused on case ME018 because of its intermediate number of rearrangements in relation to the other specimens. We used NetMHC-4.0 to predict whether any of the expressed junctions could encode peptides that could be presented by the patient’s HLA molecules. A total of 1146 9mer, 10mer, and 11mer peptides were identified from 6 protein products of expressed junctions with at least 10 RNAseq reads (Supplemental Table 3). Of these peptides, 75 were predicted to bind to ME018’s specific HLA molecules (HLA-A*02:05, HLA-A*24:02, HLA-B*15:01 and HLA-B*35:01) (Supplemental Figures 25–29), yielding 87 distinct epitopes. Seventeen of the epitopes had a predicted HLA-peptide binding affinity in the 99.5th percentile, indicating that these peptides were potentially strong binders. The predicted binders were primarily sourced from the NOD1, CREB5, and CADPS2 protein products, with 34, 16, and 15 binding peptides derived from each protein, respectively (Supplemental Figure 30). Nine peptides were predicted to form epitopes with multiple HLA molecules. The median proteasome and TAP processing score for these peptides was 1.48, which is significantly higher than the median of 0.82 for all 1146 peptides. The median immunogenicity score was 0.013, suggesting that prohibitively hydrophilic side chains at the contact residues are minimal. Given the significance of these predictions, we validated that CADPS2 was rearranged by PCR and Sanger sequencing using primers that spanned the fusion junctions in both DNA (Figure 3) and RNA (Supplemental Table 4).
Figure 3:
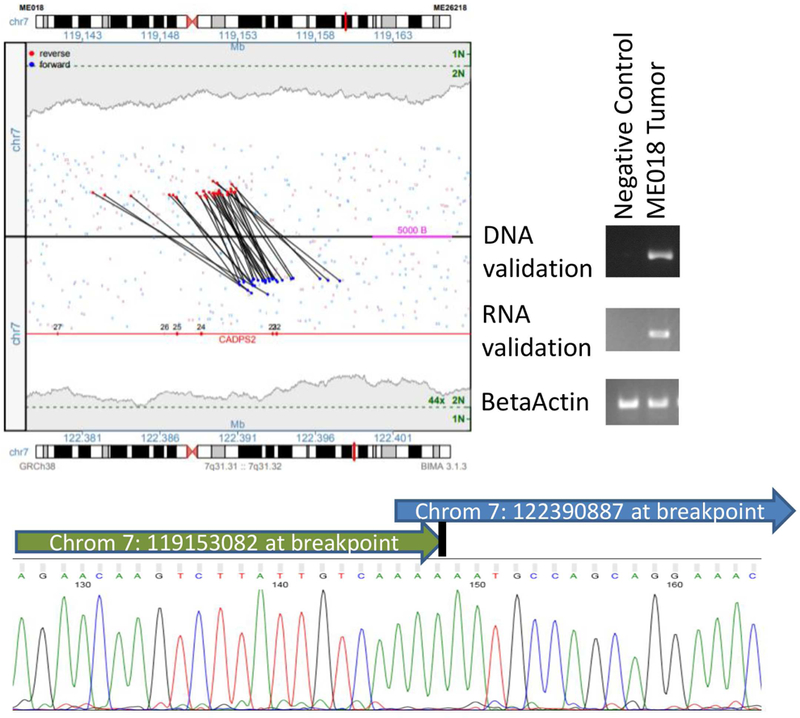
Validation of CADPS2 rearrangement in ME018
The junction plot in the top left presents the mate pair reads supporting the intra-chromosomal rearrangement between CADPS2 and a non-genic region on chromosome 7. Red and blue dots represent mate pair reads mapping to the positive or negative DNA strands, respectively, with coverage levels across each position presented in gray-shaded regions, with single (1N) and two-copy levels (2N) indicated (green). Gene regions are presented in red with exons numerated. On the top right of this figure, this rearrangement was confirmed by PCR with primers spanning the breakpoint in both DNA and RNA in ME018, but not in negative controls (pooled human genomic DNA for DNA validation, and case ME025 which lacked this rearrangement for RNA validation). In the bottom of this figure, this rearrangement was confirmed by Sanger sequencing of the DNA.
To evaluate whether the candidate rearrangement-related peptides with neoantigenic potential bind patient-specific HLA molecules, the 9mers of two candidate peptides (NYLETTSDF, CYGETYQNI) and the 11mer (NYLETTSDFHF) of one candidate peptide were selected based on their predicted immunogenicity. These candidate peptides resulted from the rearrangement of non-coding DNA with CADPS2 or non-coding DNA with NOD1 (Supplemental Tables 5–9). An MHC-peptide binding assay was performed and demonstrated that all three peptides bound HLA-A*24:02 very well or as well as that of a high affinity T cell epitope positive control (Supplemental Table 10).
To determine the effects of chromosomal rearrangements on tumor-infiltrating T cell clonality, we used T cell receptor sequencing (TCRseq). There was a correlation between the number of T cell clones and predicted neoantigens (r2=0.35, p=0.03) but not the number of chromosomal rearrangements (r2=0.26, p=0.08) or rearrangements involving genes (r2=0.27, p=0.07). For each specimen we also calculated a productive clonality score which represents the inverse of Pielou’s Evenness Index and provides a measurement of clonal distribution. There was a positive correlation between productive clonality with chromosomal rearrangements (r2=0.34, p=0.04), rearrangements involving genes (r2=0.37, p=0.03) and predicted neoantigens (r2=0.31, p=0.04). In other words, an increase in predicted neoantigens resulting from chromosomal rearrangements was correlated with clonal expansion of tumor infiltrating T cells.
We prospectively collected the peripheral blood mononuclear cells (PBMCs) and tumor from an additional patient treated at our institution. The tumor was analyzed as per the 22 cases above and 86 potential neoantigens were predicted. We then used eight of these peptides that correspond to 20 epitopes (cross-presented on 1–4 HLA alleles, with a median of 2 epitopes per peptide) with neoantigenic potential for an interferon-γ enzyme-linked immunospot (ELIspot) assay. This assay suggested that T cells responsive to these neoantigens were present in this patient’s PBMCs (Supplemental Figure 31, Supplemental Table 11).
Finally, we analyzed the copy number segmentation data of the mesothelioma cohort (n=87) in TCGA for chromothripsis using CTLPScanner 30, 31. This method was selected due to the lack of MPseq data available for TCGA. In brief, the CTLPScanner method identifies recurring patterns of copy number switching in the genome, termed Chromothripsis-like Patterns (CTLPs). In the mesothelioma cohort, we observed 27, 22, 15 and 23 patients with 0, 1, 2, and 3 or more CTLPs respectively. There were similar rates of any CTLPs in epithelioid (68%) and non-epithelioid (70%) cases (p=1.0), and similar rates of 3 or more CTLPs in epithelioid (25%) and non-epithelioid (30%) cases (p=0.62). Subjects with 3 or more CTLPs had a significantly worse prognosis than others (HR 2.002, p=0.006; Figure 4). We used a proportional hazards model to assess the effects of histology and CTLPs on survival from this dataset. Both CTLPs (HR 2.2, p=0.006) and histology (HR 1.9, p=0.013) had a significant effect on survival. Surprisingly, mesothelioma was 1 out of only 2 cancer subtypes of the 34 found in TCGA to have a hazard ratio (HR) > 2 (the other being Uterine Corpus Endometrial Carcinoma) with respect to CTLPs and poor survival, and 1 of 6 that had a statistically significant association (p < 0.05) between CTLPs and survival.
Figure 4:
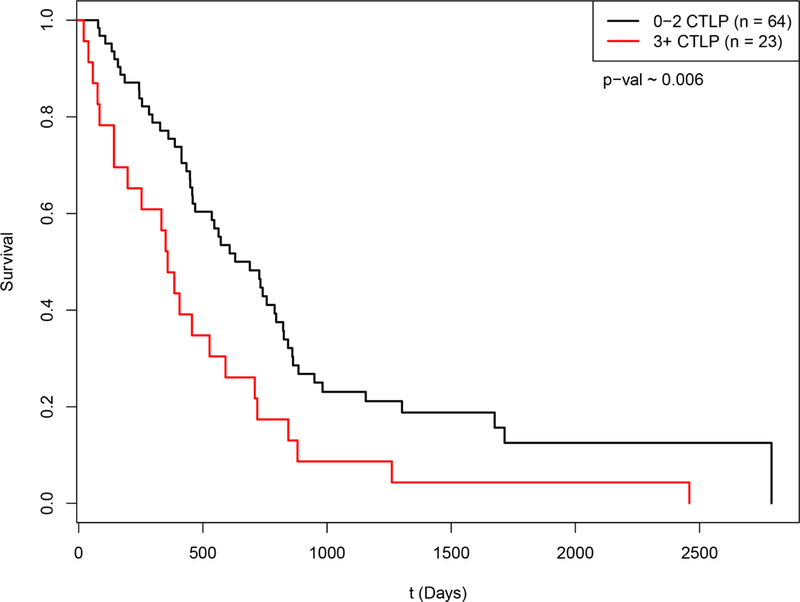
Kaplan-Meier survival curve for mesothelioma by CTLPs
Subjects were classified by the presence of 0–2 CTLPs (n=64), or 3 or more (3+ CTLPs; n=23). Survival was significantly worse for patients with 3+ CTLPs (HR 2.002, p=0.006).
Discussion
We used MPseq to identify that chromosomal rearrangements are common in MPM and frequently in a pattern of chromoanagenesis such as chromoplexy or chromothripsis. MPseq-guided analysis of RNAseq expression data revealed that these chromosomal rearrangements commonly result in the expression of junctions of genes and non-coding DNA with neo-antigenic potential. An increase in predicted neoantigens was correlated with clonal expansion of tumor infiltrating T cells. Some of these novel peptide sequences were predicted and proven to bind to patient-specific HLA molecules. Furthermore, T cells responsive to these predicted neoantigens were present in a patient’s circulating T cell repertoire. Finally, patients with multiple CTLPs had poor survival in the TCGA dataset. Overall, these data suggest that potential neoantigens may result from genomic rearrangements in addition to the more commonly described single nucleotide variants (SNVs)36, 37.
Previous studies identified recurrent karyotypic abnormalities in MPM involving chromosomal regions 1p and 9p3–5. More recent work has suggested that chromothripsis involves BAP1 in MPM38. Since BAP1 is commonly deleted in MPM but not always detected by exome based next-generation sequencing approaches39, 40, others interrogated chromosomal region 3p21 which harbors BAP1 using a high-density comparative genomic hybridization array (hd- aCGH)38. Multiple bilallelic deletions that alternated with copy number changes consistent with chromothripsis were identified. We also identified multiple events consistent with chromothripsis throughout MPM genomes that most frequently affected chromosomes 6, 7 and 17; however, we did not identify as many deletions specifically involving BAP1 possibly because hd-aCGH can potentially identify smaller deletions (<3 kb)38 than MPseq based on the design of the array and the library preparation for MPseq12–14. On the other hand, MPseq can profile the whole genome and identify other patterns of chromoanagenesis including chromoplexy. For illustration of the sensitivity of MPseq to identify rearrangements, a recent study only found 43 gene fusions in 22 specimens with RNAseq6 in comparison to the 1535 rearrangements and 637 gene fusions we identified in the same sample size. Our data also build upon recent findings that gene fusions may result in loss of copy or function of tumor suppressor genes such as BAP1, NF2 and others6. We most frequently identified involvement of RBFOX1 with chromosomal rearrangements. The significance of RBFOX1 remains uncertain in MPM, but it belongs to a family of proteins that regulate alternative mRNA splicing41 and its absence in the brain may increase susceptibility to seizures42.
Many immunotherapies are currently under investigation for MPM43. Case reports suggest that an active immune response may trigger spontaneous regression of MPM44, 45. Many therapeutic approaches are driven by the inhibition of immune checkpoints such as PD-L1 which is commonly expressed in MPM46 and may affect the tumor microenvironment47. Over the last few decades there have been many attempts to target non-mutant cancer-germline or cancer testis antigens such as NY-ESO-1 and MAGE-A3 in a variety of tumors48; however, the availability of affordable sequencing technologies has facilitated more recent efforts to identify and target tumor-specific neoantigens resulting from point mutations49. For example, targeting of a KRAS G12D mutation in a patient with metastatic colorectal cancer with adoptive T cell transfer resulted in a partial response50. Others have shown that responses to PD-1 or CTLA-4 inhibition are related to a high non-synonymous tumor mutation burden based on SNVs36, 37. Insertions and deletions (indels) that result from frameshifts have been shown to generate approximately three-times as many high-affinity neoantigens than nonsynonymous SNVs. These frameshifts were predictive of response to PD-1 inhibition in separate cohorts of patients with melanoma51. Although MPM has a relatively low nonsynonymous tumor mutation burden6, our finding of rearrangement-related peptides with neoantigenic potential may promote the immunogenicity of MPM in a similar fashion as frameshift indel high-affinity neoantigens. A weakness of the present work is the lack of sufficient tissue and germline DNA for accurate determination of tumor mutation burden for assessment of its relationship to chromoanagenesis in MPM. Also, although we have provided indirect evidence of these predicted neoantigens with the presence of T cells that recognize them in the ELIspot assay, direct evidence of computationally predicted neoantigens is an area of ongoing work of ours. Regardless, given the more recent efforts to develop personalized cancer immunotherapies49, 52, 53, rearrangement-related peptides with neoantigenic potential provide an opportunity for tumor-specific vaccination strategies in MPM and other malignancies.
In conclusion, our data suggest that neoantigen expression may be driven by structural chromosomal rearrangements in mesothelioma. These results may have implications for the development of novel immunotherapeutic strategies and the selection of patients to receive immunotherapies.
Supplementary Material
Acknowledgements
The authors are thankful for the patients who provided specimens for use in this work. The authors appreciate the assistance of Bobbi-Ann Jebens for her assistance submitting this manuscript.
Funding Statement: This work was supported by Leah and Richard Lommen, the National Institutes of Health [NIH K12 CA90628] and Mayo Clinic’s Center for Individualized Medicine’s Biomarker Discovery Group.
Footnotes
Publisher's Disclaimer: This is a PDF file of an unedited manuscript that has been accepted for publication. As a service to our customers we are providing this early version of the manuscript. The manuscript will undergo copyediting, typesetting, and review of the resulting proof before it is published in its final citable form. Please note that during the production process errors may be discovered which could affect the content, and all legal disclaimers that apply to the journal pertain.
Conflict of Interest Statement: The authors have no conflicts of interest relevant to this work to declare.
References
- 1.Robinson BW, Lake RA. Advances in malignant mesothelioma. N Engl J Med 2005;353:1591–1603. [DOI] [PubMed] [Google Scholar]
- 2.Testa JR, Cheung M, Pei J, et al. Germline BAP1 mutations predispose to malignant mesothelioma. Nature Genetics 2011;43:1022–1025. [DOI] [PMC free article] [PubMed] [Google Scholar]
- 3.Popescu NC, Chahinian AP, DiPaolo JA. Nonrandom chromosome alterations in human malignant mesothelioma. Cancer Res 1988;48:142–147. [PubMed] [Google Scholar]
- 4.Taguchi T, Jhanwar SC, Siegfried JM, et al. Recurrent deletions of specific chromosomal sites in 1p, 3p, 6q, and 9p in human malignant mesothelioma. Cancer research 1993. [PubMed]
- 5.Tiainen M, Tammilehto L, Rautonen J, et al. Chromosomal abnormalities and their correlations with asbestos exposure and survival in patients with mesothelioma. Br J Cancer 1989;60:618–626. [DOI] [PMC free article] [PubMed] [Google Scholar]
- 6.Bueno R, Stawiski EW, Goldstein LD, et al. Comprehensive genomic analysis of malignant pleural mesothelioma identifies recurrent mutations, gene fusions and splicing alterations. Nat Genet 2016;48:407–416. [DOI] [PubMed] [Google Scholar]
- 7.Alexandrov LB, Nik-Zainal S, Wedge DC, et al. Signatures of mutational processes in human cancer. Nature 2013;500:415–421. [DOI] [PMC free article] [PubMed] [Google Scholar]
- 8.Leventakos K, Mansfield AS. Reflections on immune checkpoint inhibition in non-small cell lung cancer. Transl Lung Cancer Res 2014;3:411–413. [DOI] [PMC free article] [PubMed] [Google Scholar]
- 9.Leventakos K, Mansfield AS. Advances in the Treatment of Non-small Cell Lung Cancer: Focus on Nivolumab, Pembrolizumab, and Atezolizumab. BioDrugs 2016;30:397–405 [DOI] [PubMed] [Google Scholar]
- 10.Mansfield AS. Immune checkpoint inhibition in malignant mesothelioma: Does it have a future? Lung Cancer 2017. [DOI] [PubMed]
- 11.Mansfield AS, Dong H. Implications of Programmed Cell Death 1 Ligand 1 Heterogeneity in the Selection of Patients With Non-Small Cell Lung Cancer to Receive Immunotherapy. Clin Pharmacol Ther 2016;100:220–222. [DOI] [PubMed] [Google Scholar]
- 12.Gao G, Smith DI. Mate-Pair Sequencing as a Powerful Clinical Tool for the Characterization of Cancers with a DNA Viral Etiology. Viruses 2015;7:4507–4528. [DOI] [PMC free article] [PubMed] [Google Scholar]
- 13.Murphy SJ, Aubry MC, Harris FR, et al. Identification of independent primary tumors and intrapulmonary metastases using DNA rearrangements in non-small-cell lung cancer. J Clin Oncol 2014;32:4050–4058. [DOI] [PMC free article] [PubMed] [Google Scholar]
- 14.Mansfield AS, Murphy SJ, Harris FR, et al. Chromoplectic TPM3-ALK rearrangement in a patient with inflammatory myofibroblastic tumor who responded to ceritinib after progression on crizotinib. Annals of oncology : official journal of the European Society for Medical Oncology 2016;27:2111–2117. [DOI] [PMC free article] [PubMed] [Google Scholar]
- 15.Feldman AL, Dogan A, Smith DI, et al. Discovery of recurrent t(6;7)(p25.3;q32.3) translocations in ALK-negative anaplastic large cell lymphomas by massively parallel genomic sequencing. Blood 2011;117:915–919. [DOI] [PMC free article] [PubMed] [Google Scholar]
- 16.Harris FR, Kovtun IV, Smadbeck J, et al. Quantification of Somatic Chromosomal Rearrangements in Circulating Cell-Free DNA from Ovarian Cancers. Sci Rep 2016;6:29831. [DOI] [PMC free article] [PubMed] [Google Scholar]
- 17.Murphy SJ, Cheville JC, Zarei S, et al. Mate pair sequencing of whole-genome-amplified DNA following laser capture microdissection of prostate cancer. DNA Res 2012;19:395–406. [DOI] [PMC free article] [PubMed] [Google Scholar]
- 18.Boddicker RL, Razidlo GL, Dasari S, et al. Integrated mate-pair and RNA sequencing identifies novel, targetable gene fusions in peripheral T-cell lymphoma. Blood 2016;128:1234–1245. [DOI] [PMC free article] [PubMed] [Google Scholar]
- 19.Drucker TM, Johnson SH, Murphy SJ, et al. BIMA V3: an aligner customized for mate pair library sequencing. Bioinformatics 2014;30:1627–1629. [DOI] [PubMed] [Google Scholar]
- 20.Smadbeck JB, Johnson SH, Smoley SA, et al. Copy number variant analysis using genome-wide mate-pair sequencing. Genes Chromosomes Cancer 2018;57:459–470. [DOI] [PMC free article] [PubMed] [Google Scholar]
- 21.Johnson SH, Smadbeck JB, Smoley SA, et al. SVAtools for junction detection of genome-wide chromosomal rearrangements by mate-pair sequencing (MPseq). Cancer Genet 2018;221:1–18. [DOI] [PubMed] [Google Scholar]
- 22.Gaitatzes A, Johnson SH, Smadbeck JB, et al. Genome U-Plot: a whole genome visualization. Bioinformatics 2018;34:1629–1634. [DOI] [PubMed] [Google Scholar]
- 23.Tenzer S, Peters B, Bulik S, et al. Modeling the MHC class I pathway by combining predictions of proteasomal cleavage, TAP transport and MHC class I binding. Cell Mol Life Sci 2005;62:1025–1037. [DOI] [PMC free article] [PubMed] [Google Scholar]
- 24.Andreatta M, Nielsen M. Gapped sequence alignment using artificial neural networks: application to the MHC class I system. Bioinformatics 2016;32:511–517. [DOI] [PMC free article] [PubMed] [Google Scholar]
- 25.Nielsen M, Lundegaard C, Worning P, et al. Reliable prediction of T-cell epitopes using neural networks with novel sequence representations. Protein Sci 2003;12:1007–1017. [DOI] [PMC free article] [PubMed] [Google Scholar]
- 26.Calis JJ, Maybeno M, Greenbaum JA, et al. Properties of MHC class I presented peptides that enhance immunogenicity. PLoS Comput Biol 2013;9:e1003266. [DOI] [PMC free article] [PubMed] [Google Scholar]
- 27.Mansfield AS, Ren H, Sutor S, et al. Contraction of T cell richness in lung cancer brain metastases. Sci Rep 2018;8:2171. [DOI] [PMC free article] [PubMed] [Google Scholar]
- 28.Pielou EC. Species-diversity and pattern-diversity in the study of ecological succession. J Theor Biol 1966;10:370–383. [DOI] [PubMed] [Google Scholar]
- 29.Shannon CE. A mathematical theory of communication. The Bell System Technical Journal 1948.
- 30.Cai H, Kumar N, Bagheri HC, et al. Chromothripsis-like patterns are recurring but heterogeneously distributed features in a survey of 22,347 cancer genome screens. BMC Genomics 2014;15:82. [DOI] [PMC free article] [PubMed] [Google Scholar]
- 31.Yang J, Liu J, Ouyang L, et al. CTLPScanner: a web server for chromothripsis-like pattern detection. Nucleic Acids Res 2016;44:W252–258. [DOI] [PMC free article] [PubMed] [Google Scholar]
- 32.Mansfield AS, Aubry MC, Moser JC, et al. Temporal and spatial discordance of programmed cell death-ligand 1 expression and lymphocyte tumor infiltration between paired primary lesions and brain metastases in lung cancer. Ann Oncol 2016;27:1953–1958. [DOI] [PMC free article] [PubMed] [Google Scholar]
- 33.Mansfield AS, Murphy SJ, Peikert T, et al. Heterogeneity of Programmed Cell Death Ligand 1 Expression in Multifocal Lung Cancer. Clin Cancer Res 2016;22:2177–2182. [DOI] [PMC free article] [PubMed] [Google Scholar]
- 34.Terra S, Mansfield AS, Dong H, et al. Temporal and spatial heterogeneity of programmed cell death 1-Ligand 1 expression in malignant mesothelioma. Oncoimmunology 2017;6:e1356146. [DOI] [PMC free article] [PubMed] [Google Scholar]
- 35.Holland AJ, Cleveland DW. Chromoanagenesis and cancer: mechanisms and consequences of localized, complex chromosomal rearrangements. Nat Med 2012;18:1630–1638. [DOI] [PMC free article] [PubMed] [Google Scholar]
- 36.McGranahan N, Furness AJ, Rosenthal R, et al. Clonal neoantigens elicit T cell immunoreactivity and sensitivity to immune checkpoint blockade. Science 2016;351:1463–1469. [DOI] [PMC free article] [PubMed] [Google Scholar]
- 37.Rizvi NA, Hellmann MD, Snyder A, et al. Cancer immunology. Mutational landscape determines sensitivity to PD-1 blockade in non-small cell lung cancer. Science 2015;348:124–128. [DOI] [PMC free article] [PubMed] [Google Scholar]
- 38.Yoshikawa Y, Emi M, Hashimoto-Tamaoki T, et al. High-density array-CGH with targeted NGS unmask multiple noncontiguous minute deletions on chromosome 3p21 in mesothelioma. Proceedings of the National Academy of Sciences of the United States of America 2016;113:13432–13437. [DOI] [PMC free article] [PubMed] [Google Scholar]
- 39.Nasu M, Emi M, Pastorino S, et al. High Incidence of Somatic BAP1 alterations in sporadic malignant mesothelioma. J Thorac Oncol 2015;10:565–576. [DOI] [PMC free article] [PubMed] [Google Scholar]
- 40.Yoshikawa Y, Sato A, Tsujimura T, et al. Frequent inactivation of the BAP1 gene in epithelioid-type malignant mesothelioma. Cancer Sci 2012;103:868–874. [DOI] [PMC free article] [PubMed] [Google Scholar]
- 41.Lovci MT, Ghanem D, Marr H, et al. Rbfox proteins regulate alternative mRNA splicing through evolutionarily conserved RNA bridges. Nat Struct Mol Biol 2013;20:1434–1442. [DOI] [PMC free article] [PubMed] [Google Scholar]
- 42.Gehman LT, Stoilov P, Maguire J, et al. The splicing regulator Rbfox1 (A2BP1) controls neuronal excitation in the mammalian brain. Nat Genet 2011;43:706–711. [DOI] [PMC free article] [PubMed] [Google Scholar]
- 43.Thomas A, Badrinath M, Hassan R. Immunotherapeutic Approaches to Mesothelioma. In: Testa JR, ed. Asbestos and Mesothelioma Cham: Springer International Publishing; 2017:347–357. [Google Scholar]
- 44.Moser JC, Peikert T, Roden AC, et al. Spontaneous Regression of Malignant Pleural Mesothelioma in a Patient with New-Onset Inflammatory Arthropathy. Ann Am Thorac Soc 2015;12:1416–1417. [DOI] [PubMed] [Google Scholar]
- 45.Robinson BW, Robinson C, Lake RA. Localised spontaneous regression in mesothelioma -- possible immunological mechanism. Lung Cancer 2001;32:197–201. [DOI] [PubMed] [Google Scholar]
- 46.Mansfield AS, Roden AC, Peikert T, et al. B7-H1 expression in malignant pleural mesothelioma is associated with sarcomatoid histology and poor prognosis. J Thorac Oncol 2014;9:1036–1040. [DOI] [PMC free article] [PubMed] [Google Scholar]
- 47.Awad MM, Jones RE, Liu H, et al. Cytotoxic T Cells in PD-L1-Positive Malignant Pleural Mesotheliomas Are Counterbalanced by Distinct Immunosuppressive Factors. Cancer Immunol Res 2016;4:1038–1048. [DOI] [PubMed] [Google Scholar]
- 48.Tran E, Robbins PF, Rosenberg SA. ‘Final common pathway’ of human cancer immunotherapy: targeting random somatic mutations. Nat Immunol 2017;18:255–262. [DOI] [PMC free article] [PubMed] [Google Scholar]
- 49.Gubin MM, Artyomov MN, Mardis ER, et al. Tumor neoantigens: building a framework for personalized cancer immunotherapy. J Clin Invest 2015;125:3413–3421. [DOI] [PMC free article] [PubMed] [Google Scholar]
- 50.Tran E, Robbins PF, Lu YC, et al. T-Cell Transfer Therapy Targeting Mutant KRAS in Cancer. N Engl J Med 2016;375:2255–2262. [DOI] [PMC free article] [PubMed] [Google Scholar]
- 51.Turajlic S, Litchfield K, Xu H, et al. Insertion-and-deletion-derived tumour-specific neoantigens and the immunogenic phenotype: a pan-cancer analysis. Lancet Oncol 2017;18:1009–1021. [DOI] [PubMed] [Google Scholar]
- 52.Chee J, Robinson BW, Holt RA, et al. Immunotherapy for Lung Malignancies: From Gene Sequencing to Novel Therapies. Chest 2017;151:891–897. [DOI] [PubMed] [Google Scholar]
- 53.Creaney J, Ma S, Sneddon SA, et al. Strong spontaneous tumor neoantigen responses induced by a natural human carcinogen. Oncoimmunology 2015;4:e1011492. [DOI] [PMC free article] [PubMed] [Google Scholar]
Associated Data
This section collects any data citations, data availability statements, or supplementary materials included in this article.