Abstract
Nonamnestic Alzheimer disease (AD) variants, including posterior cortical atrophy and the logopenic variant of primary progressive aphasia, differ from amnestic AD in distributions of tau aggregates and neurodegeneration. We evaluated whether 18F-flortaucipir (also called 18F-AV-1451) PET, targeting tau aggregates, detects these differences, and we compared the results with MRI measures of gray matter (GM) atrophy. Methods: Five subjects with posterior cortical atrophy, 4 subjects with the logopenic variant of primary progressive aphasia, 6 age-matched patients with AD, and 6 control subjects underwent 18F-flortaucipir PET and MRI. SUV ratios and GM volumes were compared using regional and voxel-based methods. Results: The subgroups showed the expected 18F-flortaucipir–binding patterns. Group effect sizes were generally stronger with 18F-flortaucipir PET than with MRI volumes. There were moderate-to-high correlations between regional GM atrophy and 18F-flortaucipir uptake. 18F-flortaucipir binding and GM atrophy correlated similarly to cognitive test performance. Conclusion: 18F-flortaucipir binding corresponds to the expected neurodegeneration patterns in nonamnestic AD, with potential for earlier detection of pathology than is possible with MRI atrophy measures.
Keywords: Alzheimer disease, 18F-flortaucipir PET, tau PET, structural MRI
Alzheimer disease (AD) typically manifests as early impairment of episodic memory. Nonamnestic presentations are well described, including the logopenic variant of primary progressive aphasia (lvPPA), associated with prominent language deficits (1,2), and posterior cortical atrophy (PCA), associated with visuospatial impairment (3–5). These variants are more common in early-onset AD (EOAD) and pose diagnostic challenges (1–3). MRI and 18F-FDG PET demonstrate left perisylvian–temporoparietal neurodegeneration in lvPPA (6–9) and parietal–occipital neurodegeneration in PCA (7,10,11); both show less hippocampal involvement than amnestic AD (9–11).
Both amnestic and nonamnestic presentations of AD are neuropathologically characterized by amyloid plaques and tau-based neurofibrillary tangles (NFTs). The distribution of amyloid deposition is similar between amnestic and nonamnestic AD (4,9,12,13). NFT distribution correlates with the pattern of neurodegeneration and clinical phenotype in both nonamnestic and amnestic syndromes (2,5,14,15). NFTs can induce neuronal damage (16), and tissue deposition of NFTs is therefore thought to drive subsequent neurodegeneration.
The novel PET radiotracer 18F-flortaucipir has specificity for cerebral tau aggregates of AD in preclinical and early clinical studies (17–19). More recently, studies of tau PET in lvPPA and PCA showed binding patterns matching known histopathologic distributions with inverse correlation to cerebral glucose metabolism (20,21) and, in a case series, to cortical thickness (22). Gray matter (GM) volumes measured by MRI are another important biomarker of AD neurodegeneration because of the selective regional distribution of atrophy. We hypothesized that 18F-flortaucipir can detect known syndrome-specific regional neurodegeneration of AD subtypes and that regional 18F-flortaucipir binding correlates with GM atrophy measured on MRI in a region-specific manner. By evaluating these hypotheses, we gain insight into the ability of 18F-flortaucipir PET to assist in syndromic classification of EOAD, into how closely NFT deposition detectable by 18F-flortaucipir PET is locally associated with downstream atrophy, and into the relative sensitivities of 18F-flortaucipir PET and structural MRI to the presence of neurodegeneration.
MATERIALS AND METHODS
Patient Selection
The University of Pennsylvania Institutional Review Board approved this Health Insurance Portability and Accountability Act–compliant study, and all participants provided written informed consent. Patients with onset of cognitive decline before age 65 y were prospectively recruited from the University of Pennsylvania Frontotemporal Degeneration Center and Penn Memory Center from January to December 2015 (Table 1). Using clinical diagnostic criteria, the patients were phenotypically classified as amnestic EOAD (n = 6) (23), lvPPA (n = 4) (24), or PCA (n = 5) (3,25); classification was masked to 18F-flortaucipir PET findings and quantitative GM atrophy. Cerebrospinal fluid (CSF) was available for 13 of 15 AD subjects (Supplemental Table 1; supplemental materials are available at http://jnm.snmjournals.org) and quantified using ADNI methodology (26). The ratio of total tau to β-amyloid1–42 in the CSF was higher than 0.34 in 12 subjects—a cutoff demonstrated to have greater than 95% accuracy for discriminating AD from other neurodegenerative diseases in a cross-validated autopsy series (26). One subject with a low ratio had a CSF β-amyloid1–42 level of 115 pg/mL, well below the standard cutoff of 192 pg/mL used to discriminate between AD patients and controls (27). Further, all AD subjects, including 2 amnestic EOAD subjects without available CSF, showed robust cortical binding of 18F-flortaucipir. Although not definitive given the need for further validation of the tracer, this finding supports the likelihood of underlying AD pathology based on prior studies showing weak or absent uptake in non-AD tauopathies (19). Four cognitively normal control subjects were scanned using the same protocol as for the AD groups. Data from 2 additional controls were provided by Avid Radiopharmaceuticals, imaged as part of a previously published study (28); these 2 subjects showed no significant differences in regional uptake from the other controls.
TABLE 1.
Demographic and Clinical Data by Group
| Parameter | EOAD | lvPPA | PCA | Controls |
| n | 6 | 4 | 5 | 6 |
| Mean age (y) | 60.2 (6.8) | 63.4 (5.7) | 57.8 (1.4) | 67.7 (5.6) |
| Female patients (%) | 50 | 75 | 60 | 50 |
| Mean disease duration (y) | 4.0 (0.76) | 5.2 (2.3) | 4.0 (1.6) | NA |
| Mini-mental status score (range) | 25 (21–28) | 21 (14–29) | 25 (22–27) | 29 (29–30) |
Data in parentheses are SD or range.
PET and MRI Acquisition
At 80–100 min after injection of 370 MBq (±10%) of 18F-flortaucipir (Avid Radiopharmaceuticals), brain PET was performed (4 frames of 5 min each) using a Philips Ingenuity TF scanner. PET images (2-mm isotropic) were generated by iterative reconstruction with CT attenuation correction. Volumetric 3-T T1-weighted MR images (1-mm isotropic) were available for all subjects; for AD subtypes, MRI and PET was performed within a mean ± SD of 40 ± 80 d.
Region-of-Interest (ROI) Definitions
Predefined hypothesis-driven ROIs were generated by voxel-weighted combination of Hammers N30R83 atlas-level ROIs defined in Montreal Neurologic Institute space (Supplemental Fig. 1) based on known syndromic differences in neurodegeneration (6,7,10,13). Because of the expected asymmetry in lvPPA, the right and left temporoparietal ROIs were separated. Right and left were combined for regions expected to show symmetry: lateral occipital lobes, medial parietal lobe and posterior cingulate gyrus, frontal lobes, and medial temporal lobes. These 6 ROIs were used for between-group comparisons; Supplemental Fig. 2 shows analyses without combining the right and left regions. Because we hypothesized that NFT deposition locally affects neurodegeneration, correlation between SUV ratio (SUVR) and atrophy was performed using the smaller N30R83 atlaslevel ROIs.
PET and MRI Quantification
Using PMOD (version 3.6, PMOD Technologies LLC), T1-weighted MR images were segmented to identify GM and spatially normalized to template space. Atlas GM ROIs were transferred to MR images in native space. PET images were rigidly matched to MR images in native space, and cortical GM ROIs were transferred. Mean uptake in each composite ROI was quantified without and with partial-volume correction (PVC); the results shown are without PVC unless otherwise noted. PVC was performed using the “geometric transfer matrix” method as implemented in PMOD, which takes into account PET scanner point-spread function to adjust ROI uptake values. SUVR were calculated by normalization to mean uptake in cerebellar GM, where NFTs are rare in AD (29). An asymmetry index was calculated as 200 × [(SUVRregionA − SUVRregionB)/(SUVRregionA + SUVRregionB)] (9). Comparisons were made between left and right temporoparietal ROIs for left-to-right asymmetry, expected to be highest for lvPPA, and between lateral occipital and medial temporal ROIs for posteroanterior asymmetry, expected to be highest for PCA. ROI volumes derived from MR images were normalized to intracranial volume (ICV).
Voxel-Based Morphometry (VBM)
VBM was performed for 18F-flortaucipir binding and for GM density (30). Preprocessing of T1-weighted MR images included skull stripping (31) and calculation of GM density maps (32). After motion correction, the PET image frames were summed. Individual SUV and GM density maps were registered to a common template (Jacob atlas) using deformable registration (33). PET signal was normalized to cerebellar GM uptake, whereas GM density maps were normalized to ICV. A smoothing kernel of 8 mm in full width at half maximum was applied to all images.
Cognitive Testing
Cognitive assessments were performed a mean of 8 d (range, 0–32 d) from 18F-flortaucipir PET. Episodic memory was measured by delayed recall, and recognition discrimination was measured by the Philadelphia Verbal Learning Test (34) and Rey Complex Figure delayed recall. Language was measured by a sentence repetition task, Boston Naming Test, semantic category fluency, repetition from the Mini-Mental Status Examination, and forward digit span. Visuospatial function was assessed by copying of the Rey Complex Figure (total correct) and the object decision test of the Visual Object and Space Perception battery (cognitive tests described by Strauss et al. (35)). Cognitive test results were converted to demographically adjusted z scores using published calculators (36) or cohorts from the University of Pennsylvania Integrative Neurodegenerative Disease Database (37). Individual test z scores were averaged within a domain to create composite language, memory, and visuospatial scores (Supplemental Table 1).
Statistics
For group differences in regional 18F-flortaucipir binding and cortical volume, ANOVA and the Welch t test were performed. The Bonferroni method with correction of the statistical P value was used to adjust for multiple comparisons; corrected P values (Pcorr) are shown, and a Pcorr of less than 0.05 was used as the statistical threshold. For asymmetry analysis, the paired Student t test was used. Correlation between 18F-flortaucipir binding and GM volume was evaluated in AD subtypes using Pearson r and rank sum correlation with a false-discovery rate–corrected statistical threshold of less than 0.05. Voxel-based analyses used varying statistical thresholds because of the sample size; excepting 18F-flortaucipir SUVR comparisons to controls, which used a false-discovery rate of less than 0.001, analyses used a liberal threshold (P < 0.05). Correlations between regional measures and cognitive test results were performed using Spearman rs.
RESULTS
18F-Flortaucipir Binding Compared with Controls
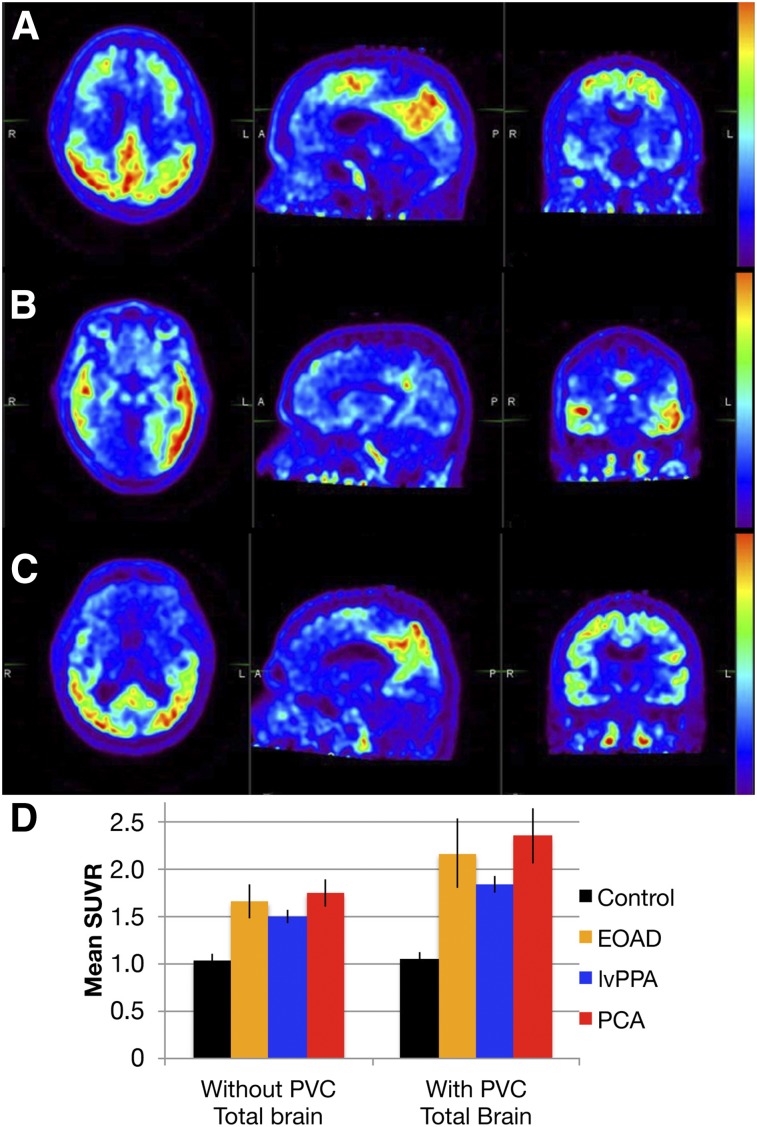
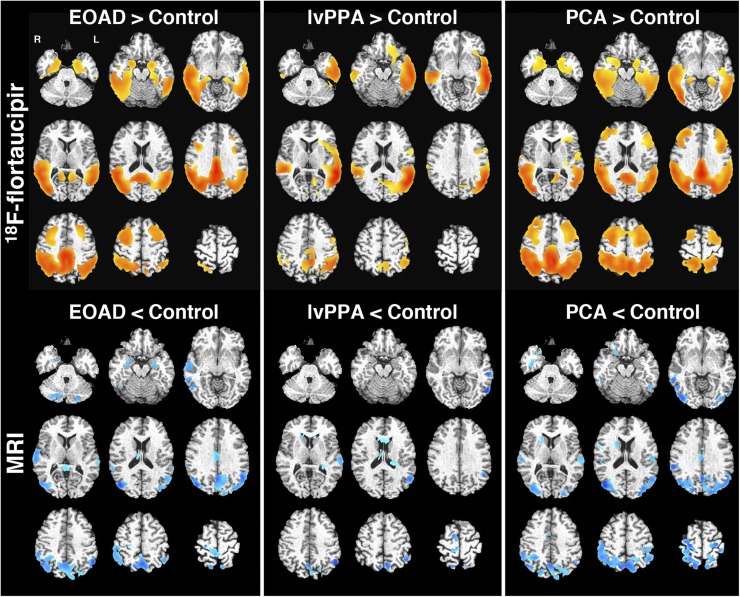
AD subgroups showed prominent binding of 18F-flortaucipir with varied regional distribution (Fig. 1). The VBM of 18F-flortaucipir binding demonstrated strong group differences from controls, with the expected left-predominant asymmetry in lvPPA (Fig. 2). EOAD and PCA had similar patterns of 18F-flortaucipir binding on VBM, although there was perhaps a greater extent of dorsal parietal–occipital uptake in PCA.
FIGURE 1.
(A–C) 18F-flortaucipir PET axial (left), sagittal (middle), and coronal (right) images of representative EOAD (A), lvPPA (B), and PCA (C) subjects. (D) Graph of mean SUVR ± SD without and with PVC for each subgroup. Total-brain 18F-flortaucipir binding is increased in AD subgroups compared with controls (Pcorr < 0.0001).
FIGURE 2.
Voxel-based analysis of 18F-flortaucipir PET and regional volume. Shown is SUVR (cerebellar reference, top) and GM density (ICV-corrected, bottom) in AD subgroups compared with controls (EOAD [left], lvPPA [middle], and PCA [right]). In top row, red–yellow regions show increased 18F-flortaucipir binding compared with controls at statistical threshold of false-discovery rate of 0.001. In bottom row, blue regions represent decreased GM density with uncorrected P < 0.01.
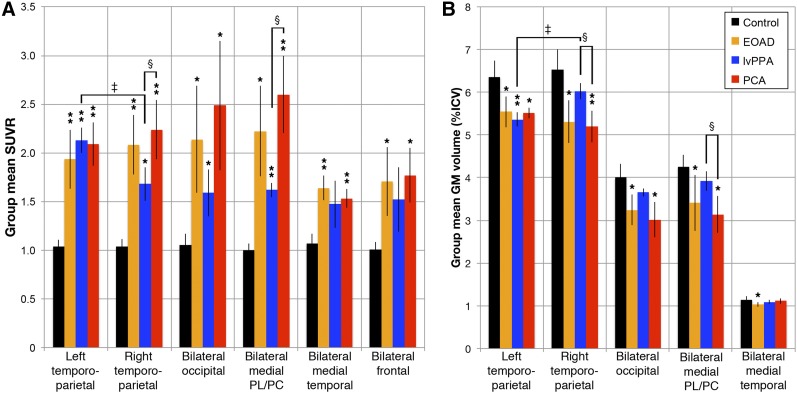
Patient subgroups showed significantly increased 18F-flortaucipir binding in nearly all prespecified ROIs compared with controls at a Pcorr of less than 0.05 (Fig. 3). EOAD had the highest effect sizes in the right and left temporoparietal and medial temporal ROIs (Pcorr ≤ 0.001; effect sizes, 4.1–5.1). The PCA group exhibited the highest binding in the medial parietal/posterior cingulate and lateral occipital lobe ROIs, with a Pcorr of 0.001 or less in the right and left temporoparietal, medial temporal, and medial parietal/posterior cingulate ROIs (effect sizes, 4.8–6.7). The lvPPA group had the highest binding in the left temporoparietal ROI and a Pcorr of 0.001 or less in the left temporoparietal and medial parietal/posterior cingulate ROIs (effect sizes, 11.5 and 8.8, respectively). These relationships were similar with PVC (data not shown).
FIGURE 3.
ROI quantification for 18F-flortaucipir SUVR (A) and GM volume (B). Shown is mean group SUVR across prespecified ROI (±SD). Mean regional uptake is significantly elevated for most ROIs across all groups vs. controls (*Pcorr < 0.05 or **Pcorr < 0.001). Much larger frontal lobe ROI is excluded from volume for scale but showed no significant between-group volume differences. Significantly higher binding and lower volumes were seen in right temporoparietal and medial parietal/posterior cingulate ROIs in PCA than in lvPPA, (§Pcorr < 0.05 compared with lvPPA). There was significantly increased binding and lower volumes in left lateral temporoparietal ROI within lvPPA group (‡Pcorr < 0.05, compared with right side). PL/PC = parietal lobe/posterior cingulate.
18F-Flortaucipir Binding Between AD Groups
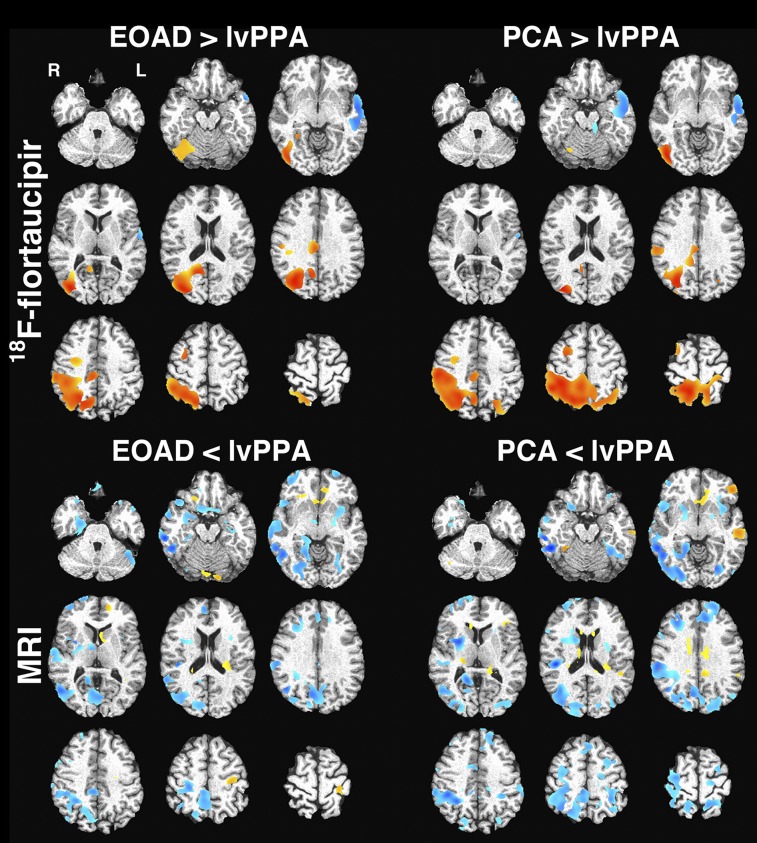
The PCA group showed a significantly higher mean 18F-flortaucipir SUVR than the lvPPA group in the medial parietal lobe/posterior cingulate ROI (2.60 ± 0.40 vs. 1.62 ± 0.073, Pcorr = 0.01; effect size, 3.2) and the right temporoparietal ROI (2.24 ± 0.30 vs. 1.68 ± 0.17, Pcorr = 0.03; effect size, 2.2) (Fig. 3). These findings persisted with PVC. We expected higher uptake in the lateral occipital lobes in PCA, and although mean uptake was elevated, both PCA and EOAD had high variability in uptake in this ROI (mean SUVR, 2.49 ± 0.66 in PCA vs. 2.13 ± 0.55 in EOAD vs. 1.58 ± 0.24 in lvPPA). VBM demonstrated trends toward the expected differences between EOAD and PCA and the lvPPA group, with relatively lower binding in the right parietal lobe and higher binding in the left lateral temporal lobe at a false-discovery rate of less than 0.01 (Fig. 4). Neither ROI analysis nor VBM demonstrated significant differences between EOAD and PCA.
FIGURE 4.
Voxel-based comparison of 18F-flortaucipir SUVR (top) and GM density (bottom). Regions with higher SUVR or GM density in EOAD/PCA vs. lvPPA are in red–yellow, whereas those higher in lvPPA are in blue. Images were thresholded at uncorrected P < 0.05. No significant difference was seen in comparing EOAD and PCA groups for either modality.
Only the lvPPA subjects showed significant asymmetry in 18F-flortaucipir binding in syndrome-specific ROI comparisons (Fig. 3 and Supplemental Fig. 2), with a significantly higher SUVR in the left than the right temporoparietal ROI (2.06 ± 0.19 vs. 1.68 ± 0.15, Pcorr = 0.008), which persisted with PVC. A significantly higher left–right asymmetry index was seen in lvPPA (23.8% ± 8.7%, Pcorr < 0.005) than in EOAD (−7.5% ± 9.2%) or PCA (−6.5% ± 7.1%). The posteroanterior asymmetry index between the lateral occipital and medial temporal ROIs showed higher posterior binding in PCA (43.8% ± 32.8%) than in EOAD (23.5% ± 30.3%) or lvPPA (7.5% ± 15.5%), but this difference was not significantly significant between groups.
GM Volume Differences
MRI demonstrated weaker effects of differences between AD groups and controls than did 18F-flortaucipir PET. The VBM of GM density showed trends toward the expected regional differences in the PCA and EOAD groups at a more lenient statistical threshold than used for 18F-flortaucipir PET (Fig. 2). VBM showed no convincing differences between lvPPA subjects and controls. ROI analyses produced more significant findings, largely matching disease phenotypes. EOAD showed a significantly decreased volume in all ROIs compared with controls, with the highest effect sizes being in the left and right temporoparietal ROIs (2.2–2.5, Pcorr ≤ 0.005). A significantly decreased volume in PCA subjects versus controls was seen in the left and right temporoparietal, medial parietal/posterior cingulate, and lateral occipital lobe ROIs (Pcorr < 0.002; effect sizes, 2.4–3.6). In lvPPA, there was a significantly decreased volume in the left temporoparietal ROI (Pcorr = 0.006; effect size, 3.8).
ROI-based volumetric comparison showed a significantly deceased volume in PCA versus lvPPA in the right temporoparietal ROI (5.2% ± 0.4% of ICV vs. 6.0% ± 0.2%, Pcorr = 0.01; effect size, 2.7) and the medial parietal/posterior cingulate ROI (3.1% ± 0.4% of ICV vs. 3.9% ± 0.2%, Pcorr = 0.04; effect size, 2.2). MRI volume measurements were significantly asymmetric only in lvPPA. The left temporoparietal region had a lower volume than the right (5.4% ± 0.16% of ICV vs. 6.0% ± 0.18% of ICV, Pcorr = 0.0008). The temporoparietal ROI asymmetry index in lvPPA (11.6% ± 2.1%) was significantly higher than in EOAD or PCA (Pcorr < 0.005). Other between-group ROI comparisons were not statistically significant, nor did VBM show convincing differences between AD subtypes. Except for weaker findings in VBM, volumetric analyses were overall similar to the results from 18F-flortaucipir PET.
18F-Flortaucipir SUVR and Volume Correlations
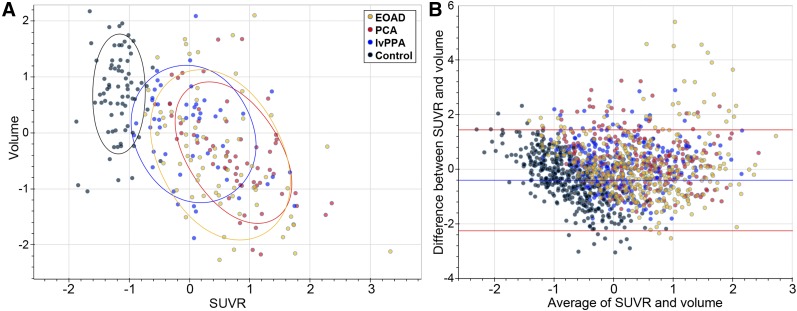
We hypothesized that NFT deposition would lead to a lower local cortical GM volume, so we investigated local correlations between 18F-flortaucipir SUVR and volume using the more granular N30R83 atlas–level ROIs (62 regions). Control subjects showed variability in ROI volume but little variation in 18F-flortaucipir binding by ROI, suggesting that volumetric differences are due to other sources unrelated to NFT accumulation (Fig. 5). Excluding these control subjects, analysis of atlas-level ROIs found significant correlations between 18F-flortaucipir binding and GM volume in 20 of the 62 ROIs (correlation coefficients between −0.6 and −0.97, false-discovery rate < 0.05); 16 of these 20 ROIs had a mean SUVR across the AD subgroups that was above the median, supporting the notion that 18F-flortaucipir–GM volume relationships are strongest in regions with significant tracer uptake. ROIs within the cingulate gyri and insula and several in the frontal lobes demonstrated poor correlations characterized by preserved volumes but increased 18F-flortaucipir binding; most outliers on Bland–Altman plots were from these regions (Fig. 5).
FIGURE 5.
Correlation between 18F-flortaucipir PET SUVR and GM volume. (A) Correlations between SUVR and volumes for all EOAD, PCA, lvPPA, and control subjects are shown as z score vs. group means for each region for each subject; data are plotted by lobe for simplicity. Control subjects are displayed but are not included in statistical analysis. (B) Bland–Altman plot of atlas-level ROIs demonstrates close agreement for most ROIs. Outliers with increased 18F-flortaucipir binding but preserved volumes are mainly from cingulate gyrus, insula, and frontal lobes.
Correlations with Cognitive Testing
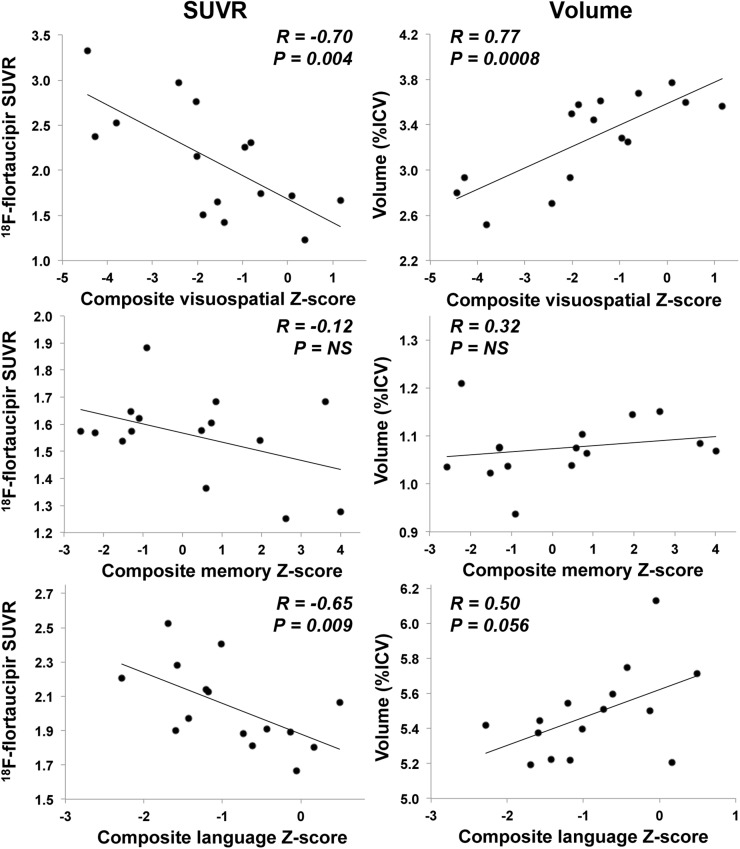
Dissociable anatomic regions support memory, language, and visuospatial performance, all variably affected in EOAD, lvPPA, and PCA. We explored the correlations between 18F-flortaucipir binding and composite-memory, visuospatial, and language measures across AD subgroups in ROIs relevant to these cognitive domains: the medial temporal, lateral occipital, and left temporoparietal ROIs, respectively (Fig. 6). We found comparable strong correlations between visuospatial composite score and the SUVR (rs = −0.70, P = 0.004) and volume (rs = 0.77, P = 0.0008) of the lateral occipital ROI. Multiple regression modeling showed that combining SUVR and volume showed no improvement over volume alone (R2 = 0.61 vs. 0.60; SUVR alone had an R2 of 0.49). The language composite score moderately correlated with left temporoparietal SUVR (rs = −0.65, P = 0.009) and volume (rs = 0.50, P = 0.056). The memory composite score exhibited a low and nonsignificant correlation to medial temporal SUVR (rs = −0.12, P = 0.68) and volume (rs = 0.32, P = 0.24). Multivariate regression models did not show a statistically significant improvement with the combination of SUVR and volume for language or memory.
FIGURE 6.
Correlations between composite cognitive scores and 18F-flortaucipir SUVR or ICV-normalized volume. Visuospatial score is correlated with measurements in lateral occipital ROI, memory score with medial temporal ROI measurements, and language score with left temporoparietal ROI measurements. NS = nonsignificant (P > 0.05).
DISCUSSION
Novel tau PET radiotracers uniquely allow evaluation of whole-brain distributions of NFTs in vivo. People with the lvPPA, PCA, and amnestic EOAD variants of AD, classified by clinical measures, have differing distributions of tau NFT in pathologic studies (2,5,14,15). These groups provide an ideal context to test whether 18F-flortaucipir can detect known regional differences and investigate associations between NFTs and other measures of neurodegeneration. Such cross-modal relationships with tau PET are just emerging in the literature, and the considerable regional variance of the current cohort is particularly suited to examining these local effects.
AD subgroups showed patterns of 18F-flortaucipir uptake matching known syndromic patterns of NFT accumulation. LvPPA had prominent left-sided asymmetry and the largest effect size in the left temporoparietal ROI. Both EOAD and PCA showed symmetric and broadly distributed uptake. EOAD had the highest effect sizes in the medial temporal and right temporoparietal ROIs, whereas PCA had the largest effect sizes in ROIs including posterior structures. Although these findings in PCA and EOAD are consistent with their phenotypic differences, we did not find statistically significant between-group differences in regional 18F-flortaucipir binding. This finding warrants further study; it is possible that imaging earlier in the course of disease might accentuate the differences between these groups.
Although tau deposition is generally conceptualized as preceding measurable atrophy (38), the in vivo sensitivity of 18F-flortaucipir to NFTs and the temporal relationship between tau deposition and onset of atrophy are uncertain. We found that 18F-flortaucipir PET and MRI volumetry showed qualitatively analogous patterns of imaging abnormality. Indeed, volumes of prespecified ROIs displayed effect sizes similar to those of 18F-flortaucipir PET in between-group comparisons, although voxelwise analyses displayed more convincing group differences for 18F-flortaucipir PET than for volumetry.
We also found moderate-to-high inverse correlations between regional 18F-flortaucipir and MRI volumes in 20 atlas-level ROIs comprising about 50% of cortical GM volume, with most correlations exceeding an R value of −0.6. These correlations are consistent with pathologic and 18F-flortaucipir imaging studies showing associations between regional NFT distribution and neurodegeneration (20–22). Xia et al. recently showed similar within-subject correlations between 18F-flortaucipir binding and cortical thickness in 6 mixed-phenotype AD patients (22). Areas with higher 18F-flortaucipir uptake tended to correlate most strongly with volumetric measures, suggesting that the presence of NFTs strongly affects neurodegeneration, whereas variation in atrophy in regions with lower uptake is more influenced by other factors. However, we did find weak correlations between binding and volumes in a few regions with higher levels of 18F-flortaucipir, including the posterior cingulate gyrus and several frontal lobe ROIs.
There are several possible reasons why focal regional 18F-flortaucipir SUVR and MRI volumes may have a weak correlation. First, as noted above, the contribution of NFTs to atrophy in regions with lower levels of NFTs may be weaker because of other factors driving differences in volume, including normal aging. Second, tau PET may detect pretangle tau aggregation or early NFT deposition preceding atrophy, possibly accounting for regions with moderate 18F-flortaucipir uptake but relatively preserved volumes, such as insulae and several frontal lobe ROIs. A few regions, most notably the posterior cingulate, showed relatively preserved volume despite high 18F-flortaucipir binding. Some brain regions may be more resilient to the presence of NFTs and thus relatively less likely to show volume changes. In the future, it will be important to investigate in a larger, longitudinal study whether 18F-flortaucipir PET detects NFT deposition before atrophy, whether this binding predicts future atrophy, and the degree to which these relationships are modulated by region.
The relative ability of tau PET, which aims to quantify a critical pathologic change in AD, versus regional atrophy, which measures neurodegeneration but integrates contributions from other comorbid pathologies, to predict cognitive decline is unclear. The regional correlations of 18F-flortaucipir SUVR and MRI-derived volume to cognitive test performance were similar. Both volume and SUVR in the lateral occipital lobes were strongly correlated with visuospatial task performance. MRI was more predictive, and adding 18F-flortaucipir SUVR to volume did not improve regression models. Language test performance was marginally more correlated with SUVR than volume in the left lateral temporoparietal region, although both correlations were moderate. Neither SUVR nor volumes of medial temporal ROIs showed a significant correlation with memory testing. Qualitatively, our correlations between visuospatial, memory, and language functions and regional 18F-flortaucipir binding were similar to the results of Ossenkoppele et al. (21), who used smaller ROIs defining regions more closely linked to each cognitive domain. Larger studies comparing the relationships of atrophy and NFT distribution will be important to determine whether tau PET has added value in predicting and tracking declines in cognitive function.
This study had several limitations. First, the number of subjects was small, limiting assessment of between-group differences. Voxelwise comparisons between AD groups were performed with relaxed statistical thresholds and will require further validation. Effect sizes were large in many regional comparisons, suggesting that a larger sample may show significant group differences. Second, we do not have pathologic confirmation of clinical diagnoses. Our classification was based on rigorous clinical criteria and supportive CSF findings in most cases. Further, the match between observed regional atrophy and known patterns in these syndromes further supports the clinical diagnoses. Incorrect classification related to phenotypic overlap between groups could reduce the power to detect group differences. Analysis of correlations between 18F-flortaucipir binding and volumes may be affected by the time between data acquisition, which varied across subjects. Although these syndromes are not typically characterized by rapid atrophy, shorter intervals between scans may yield more robust results. Lastly, we used large ROIs in exploratory investigations of regional correlations to cognitive test performance. These ROIs are related to known patterns of neurodegeneration in these syndromes but are not specifically targeted to the cognitive functions that were investigated.
CONCLUSION
This and other early studies of tau PET, using 18F-flortaucipir and other tracers, have shown promise for the evaluation of neuropathologic mechanisms and clinical detection of NFTs in living patients with AD pathology. With this and other recent studies showing strong correlations between tau PET and imaging measures of neurodegeneration, it will be critical to establish the role of tau PET with respect to other biomarkers of AD pathology, including amyloid and 18F-FDG PET, regional atrophy, and CSF β-amyloid and tau assays, in determining disease stage and future progression. Our observations of regional heterogeneity between phenotypically distinct groups with suspected AD pathology and large effect sizes suggest that tau PET may be useful for early detection of regional neurodegeneration. Further, as 18F-flortaucipir showed strong binding in AD variants and, by autoradiography, seems to have poor affinity for tau aggregates in non-AD neurodegeneration (19), this radiotracer may prove useful in distinguishing between these pathologies.
DISCLOSURE
Funding was provided by the University of Pennsylvania Institute on Aging. Avid Radiopharmaceuticals, Inc., provided 18F-flortaucipir radiotracer for the study but did not provide direct funding and did not participate in data analysis. No other potential conflict of interest relevant to this article was reported.
Supplementary Material
Acknowledgments
Jacob Dubroff, MD, PhD, participated in PET acquisition.
REFERENCES
- 1.Gorno-Tempini ML, Hillis AE, Weintraub S, et al. Classification of primary progressive aphasia and its variants. Neurology. 2011;76:1006–1014. [DOI] [PMC free article] [PubMed] [Google Scholar]
- 2.Mesulam M, Wicklund A, Johnson N, et al. Alzheimer and frontotemporal pathology in subsets of primary progressive aphasia. Ann Neurol. 2008;63:709–719. [DOI] [PMC free article] [PubMed] [Google Scholar]
- 3.Alladi S, Xuereb J, Bak T, et al. Focal cortical presentations of Alzheimer’s disease. Brain. 2007;130:2636–2645. [DOI] [PubMed] [Google Scholar]
- 4.de Souza LC, Corlier F, Habert MO, et al. Similar amyloid-beta burden in posterior cortical atrophy and Alzheimer’s disease. Brain. 2011;134:2036–2043. [DOI] [PubMed] [Google Scholar]
- 5.Tang-Wai DF, Graff-Radford NR, Boeve BF, et al. Clinical, genetic, and neuropathologic characteristics of posterior cortical atrophy. Neurology. 2004;63:1168–1174. [DOI] [PubMed] [Google Scholar]
- 6.Grossman M. Primary progressive aphasia: clinicopathological correlations. Nat Rev Neurol. 2010;6:88–97. [DOI] [PMC free article] [PubMed] [Google Scholar]
- 7.Migliaccio R, Agosta F, Rascovsky K, et al. Clinical syndromes associated with posterior atrophy: early age at onset AD spectrum. Neurology. 2009;73:1571–1578. [DOI] [PMC free article] [PubMed] [Google Scholar]
- 8.Murray ME, Graff-Radford NR, Ross OA, Petersen RC, Duara R, Dickson DW. Neuropathologically defined subtypes of Alzheimer’s disease with distinct clinical characteristics: a retrospective study. Lancet Neurol. 2011;10:785–796. [DOI] [PMC free article] [PubMed] [Google Scholar]
- 9.Rabinovici GD, Jagust WJ, Furst AJ, et al. Abeta amyloid and glucose metabolism in three variants of primary progressive aphasia. Ann Neurol. 2008;64:388–401. [DOI] [PMC free article] [PubMed] [Google Scholar]
- 10.Whitwell JL, Jack CR, Jr, Kantarci K, et al. Imaging correlates of posterior cortical atrophy. Neurobiol Aging. 2007;28:1051–1061. [DOI] [PMC free article] [PubMed] [Google Scholar]
- 11.Kas A, de Souza LC, Samri D, et al. Neural correlates of cognitive impairment in posterior cortical atrophy. Brain. 2011;134:1464–1478. [DOI] [PubMed] [Google Scholar]
- 12.Wolk DA, Price JC, Madeira C, et al. Amyloid imaging in dementias with atypical presentation. Alzheimers Dement. 2012;8:389–398. [DOI] [PMC free article] [PubMed] [Google Scholar]
- 13.Lehmann M, Ghosh PM, Madison C, et al. Diverging patterns of amyloid deposition and hypometabolism in clinical variants of probable Alzheimer’s disease. Brain. 2013;136:844–858. [DOI] [PMC free article] [PubMed] [Google Scholar]
- 14.Johnson JK, Head E, Kim R, Starr A, Cotman CW. Clinical and pathological evidence for a frontal variant of Alzheimer disease. Arch Neurol. 1999;56:1233–1239. [DOI] [PubMed] [Google Scholar]
- 15.Gefen T, Gasho K, Rademaker A, et al. Clinically concordant variations of Alzheimer pathology in aphasic versus amnestic dementia. Brain. 2012;135:1554–1565. [DOI] [PMC free article] [PubMed] [Google Scholar]
- 16.Spires-Jones TL, Hyman BT. The intersection of amyloid beta and tau at synapses in Alzheimer’s disease. Neuron. 2014;82:756–771. [DOI] [PMC free article] [PubMed] [Google Scholar]
- 17.Marquié M, Normandin MD, Vanderburg CR, et al. Validating novel tau positron emission tomography tracer [F-18]-AV-1451 (T807) on postmortem brain tissue. Ann Neurol. 2015;78:787–800. [DOI] [PMC free article] [PubMed] [Google Scholar]
- 18.Chien DT, Bahri S, Szardenings AK, et al. Early clinical PET imaging results with the novel PHF-tau radioligand [F-18]-T807. J Alzheimers Dis. 2013;34:457–468. [DOI] [PubMed] [Google Scholar]
- 19.Lowe VJ, Curran G, Fang P, et al. An autoradiographic evaluation of AV-1451 tau PET in dementia. Acta Neuropathol Commun. 2016;4:58. [DOI] [PMC free article] [PubMed] [Google Scholar]
- 20.Dronse J, Fliessbach K, Bischof GN, et al. In vivo patterns of tau pathology, amyloid-beta burden, and neuronal dysfunction in clinical variants of Alzheimer’s disease. J Alzheimers Dis. 2017;55:465–471. [DOI] [PubMed] [Google Scholar]
- 21.Ossenkoppele R, Schonhaut DR, Scholl M, et al. Tau PET patterns mirror clinical and neuroanatomical variability in Alzheimer’s disease. Brain. 2016;139:1551–1567. [DOI] [PMC free article] [PubMed] [Google Scholar]
- 22.Xia C, Makaretz SJ, Caso C, et al. Association of in vivo [18F]AV-1451 tau PET imaging results with cortical atrophy and symptoms in typical and atypical Alzheimer disease. JAMA Neurol. 2017;74:427–436. [DOI] [PMC free article] [PubMed] [Google Scholar]
- 23.McKhann GM, Knopman DS, Chertkow H, et al. The diagnosis of dementia due to Alzheimer’s disease: recommendations from the National Institute on Aging-Alzheimer’s Association workgroups on diagnostic guidelines for Alzheimer’s disease. Alzheimers Dement. 2011;7:263–269. [DOI] [PMC free article] [PubMed] [Google Scholar]
- 24.Gorno-Tempini ML, Dronkers NF, Rankin KP, et al. Cognition and anatomy in three variants of primary progressive aphasia. Ann Neurol. 2004;55:335–346. [DOI] [PMC free article] [PubMed] [Google Scholar]
- 25.McMonagle P, Deering F, Berliner Y, Kertesz A. The cognitive profile of posterior cortical atrophy. Neurology. 2006;66:331–338. [DOI] [PubMed] [Google Scholar]
- 26.Irwin DJ, McMillan CT, Toledo JB, et al. Comparison of cerebrospinal fluid levels of tau and Abeta1-42 in Alzheimer disease and frontotemporal degeneration using 2 analytical platforms. Arch Neurol. 2012;69:1018–1025. [DOI] [PMC free article] [PubMed] [Google Scholar]
- 27.Shaw LM, Vanderstichele H, Knapik-Czajka M, et al. Qualification of the analytical and clinical performance of CSF biomarker analyses in ADNI. Acta Neuropathol (Berl). 2011;121:597–609. [DOI] [PMC free article] [PubMed] [Google Scholar]
- 28.Shcherbinin S, Schwarz AJ, Joshi AD, et al. Kinetics of the tau PET tracer 18F-AV-1451 (T807) in subjects with normal cognitive function, mild cognitive impairment and Alzheimer’s disease. J Nucl Med. 2016;57:1535–1542. [DOI] [PubMed] [Google Scholar]
- 29.Larner AJ. The cerebellum in Alzheimer’s disease. Dement Geriatr Cogn Disord. 1997;8:203–209. [DOI] [PubMed] [Google Scholar]
- 30.Cox RW. AFNI: software for analysis and visualization of functional magnetic resonance neuroimages. Comput Biomed Res. 1996;29:162–173. [DOI] [PubMed] [Google Scholar]
- 31.Doshi J, Erus G, Ou Y, Gaonkar B, Davatzikos C. Multi-atlas skull-stripping. Acad Radiol. 2013;20:1566–1576. [DOI] [PMC free article] [PubMed] [Google Scholar]
- 32.Davatzikos C, Genc A, Xu D, Resnick SM. Voxel-based morphometry using the RAVENS maps: methods and validation using simulated longitudinal atrophy. Neuroimage. 2001;14:1361–1369. [DOI] [PubMed] [Google Scholar]
- 33.Ou Y, Sotiras A, Paragios N, Davatzikos C. DRAMMS: deformable registration via attribute matching and mutual-saliency weighting. Med Image Anal. 2011;15:622–639. [DOI] [PMC free article] [PubMed] [Google Scholar]
- 34.Libon DJ, Price CC, Giovannetti T, et al. Linking MRI hyperintensities with patterns of neuropsychological impairment: evidence for a threshold effect. Stroke. 2008;39:806–813. [DOI] [PubMed] [Google Scholar]
- 35.Strauss E, Sherman EMS, Spreen O, Spreen O. A Compendium of Neuropsychological Tests: Administration, Norms, and Commentary. 3rd ed New York, NY: Oxford University Press; 2006. [Google Scholar]
- 36.Shirk SD, Mitchell MB, Shaughnessy LW, et al. A web-based normative calculator for the uniform data set (UDS) neuropsychological test battery. Alzheimers Res Ther. 2011;3:32. [DOI] [PMC free article] [PubMed] [Google Scholar]
- 37.Toledo JB, Van Deerlin VM, Lee EB, et al. A platform for discovery: the University of Pennsylvania Integrated Neurodegenerative Disease Biobank. Alzheimers Dement. 2014;10:477–484. [DOI] [PMC free article] [PubMed] [Google Scholar]
- 38.Jack CR, Jr, Vemuri P, Wiste HJ, et al. Evidence for ordering of Alzheimer disease biomarkers. Arch Neurol. 2011;68:1526–1535. [DOI] [PMC free article] [PubMed] [Google Scholar]
Associated Data
This section collects any data citations, data availability statements, or supplementary materials included in this article.


