Abstract
Objective
In the field of cochlear implantation, the current trend toward patient-specific electrode selection and the achievement of optimal audiologic outcomes has resulted in implant manufacturers developing a large portfolio of electrodes. The aim of this study was to bridge the gap between the known variability of cochlea length and this electrode portfolio.
Design
Retrospective analysis on cochlear length and shape in micro–computed tomography and cone beam computed tomography data.
Setting
Tertiary care medical center.
Subjects and Methods
A simple 2-step approach was developed to accurately estimate the individual cochlear length as well as the projected length of an electrode array inside the cochlea. The method is capable of predicting the length of the cochlea and the inserted electrode length at any specific angle. Validation of the approach was performed with 20 scans of human temporal bones (micro–computed tomography) and 47 pre- and postoperative clinical scans (cone beam computed tomography).
Results
Mean ± SD absolute errors in cochlear length estimations were 0.12 ± 0.10 mm, 0.38 ± 0.26 mm, and 0.71 ± 0.43 mm for 1, 1.5, and 2 cochlea turns, respectively. Predicted insertion angles based on clinical cone beam computed tomography data showed absolute deviations of 27° ± 18° to the corresponding postoperative measurements.
Conclusion
With accuracy improvements of 80% to 90% in comparison with previously proposed approaches, the method is well suited for the use in individualized cochlear implantation.
Keywords: cochlear duct length, cochlear geometry, individualized cochlear implantation, cochlear implant outcome prediction
Within the field of cochlear implantation, there has been growing evidence that the one-size-fits-all philosophy regarding implanted electrode array length does not achieve the most optimal hearing perception outcomes: recent studies found a correlation between higher electrode insertion depth and improved audiologic outcomes among patients.1-4 The forces associated with deeper electrode insertion may entail a greater risk of trauma.2,5-7 Furthermore, the interindividual anatomic variation of the cochlea affects the size and length of the cochlea itself8,9 as well as the neural structures contained within,10 the latter of which are the target of electric stimulation with the cochlear implant. One specific electrode array may therefore achieve very diverse levels of insertion trauma and audiologic outcomes.
That is why cochlear implant manufacturers have introduced a range of electrode lengths and designs. The selection of the optimal electrode for each patient requires methods to preoperatively evaluate the patient’s cochlear length—known as the cochlear duct length (CDL)—and then project the length of each electrode onto the determined CDL. Ideally, one would directly measure the CDL from the patient’s preoperative radiologic images. However, a consistent direct measurement of cochlear length is limited by the quality of the current imaging devices and the small and complex anatomy of the cochlear turns. Since the first (or basal) turn of the cochlea is the most visible part of the cochlea in clinical computed tomography (CT) images (see Figure 1 ), spiral equations were developed that rely on the measurement of basal turn parameters.11
Figure 1.
Cross-sectional image of the same cochlea derived from (A) micro–computed tomography and (B) cone beam computed tomography data. The former image also shows a visualization of the cochlear lateral wall and the global cochlear dimensions A, B, and H.
Escudé et al12 defined the logarithmic equation CDL(θ) = 2.62 A ln(1 +Θ/235) to determine the CDL at the level of the lateral wall at each cochlear angle Θ, with a single linear measurement of basal turn diameter (the A value) in clinical CT images.11 Alexiades et al13 then used a slight modification of Escudé’s equation in combination with Hardy’s equation to estimate the CDL at the level of the organ of Corti, which is necessary for determining the tonotopic frequency distribution of the cochlea. One limitation of Escudé’s equation is that it does not account for the cochlear basal turn width B (which is orthogonal to A) but rather assumes a linear dependency of A and B: in a study of 310 normally developed cochleae, Meng et al8 demonstrated that the ratio of A and B is not consistent but may vary quite substantially from one cochlea to another. Hence, the main aim of this study was to develop a novel and simple approach to estimate the cochlear length with diameter A and width B of the cochlear basal turn.
Methods
Lateral Wall Reconstruction in Micro-CT and Cone Beam CT Data
Micro-CT Analysis
The custom research software tool Comet14 was used to trace the human cochlear lateral wall in 20 micro-CT imaging data sets (voxel size, 10 × 10 × 10 µm). This was done due to the high spatial accuracy in delineation of the lateral wall within the high-resolution micro-CT images, which makes these tracings very reliable and therefore suitable for reference data generation. With Comet, points were manually placed at the outer edge of the cochlea lumen from the center of the round window to the apex in angular steps of 22.5° to allow for accurate spiral shape reconstructions.15
Clinical Cone Beam CT Analysis
Due to technological limitations, micro-CT images are not available to surgeons or radiologists in their clinical practice. Instead, lower-resolution cone beam CT (CBCT) data must be used for anatomic analyses, which is why an additional 47 clinical anonymized CBCT data sets of actual cochlear implant patients were included into the study, each of which consisted of 1 pre- and 1 postoperative CT scan. These scans were conducted within the clinical routine at the Hannover Medical School independent of this study. The selection process of the patients to be included into the study was random in general, but malformed cochleae were excluded. The preoperative images were analyzed with Comet and the aforementioned protocol, while the corresponding postoperative data sets were used for validation of the derived electrode insertion angle prediction method. The registered ethics committee of the Hannover Medical School approved the retrospective analysis of the patient-related data.
Reconstruction of the Lateral Wall Contours
For the sake of consistency to our previous studies, reconstructions of the 47 CBCT and 20 micro-CT lateral wall contours were performed in Matlab (version R2015a; MathWorks Inc, Natick, Massachusetts) according to the same procedure described by Schurzig et al11: After reconstruction of each cochlear helix, the corresponding basal diameters A and B were extracted, since they serve as input parameters for subsequently derived and employed estimation methods.
Spiral Shape Analysis
Geometric data analysis of the 20 micro-CT cochlear spirals were performed in Python (version 3.5.3, 64 bit, Qt 4.8.7, PyQt4, API v2, 4.11.4 for Windows; Python Software Foundation, Wilmington, Delaware). All correlation analyses were performed only with micro-CT data to ensure that the derived values and their correlations are reliable. For each data set, the cochlear radius r(Θ) and length l(Θ) were computed over the entire range of each cochlear angle Θ. These data were then used to derive the proposed CDL approximation method (see Derivation of pBTL Values section) and to perform part of the subsequent validation study (see Validation of pBTL-Based CDL Estimation section and Validation of Combining ECA with pBTL-Based CDL Estimation section).
Novel CDL Estimation Approach
To allow for reliable estimations of the CDL based on simple linear measurements in clinical imaging data, a novel 2-step approach was developed that can compute CDL for any desired angular value Θ. These 2 steps are as follows: (1) computation of patient-specific basal turn length (BTL) and (2) multiplication of this value with a parameter that is dependent on the cochlear angle of interest Θ and transforms the BTL value into the CDL for this specific angle. Detailed descriptions of the 2 steps are given in the following.
Elliptic-Circular Approximation
Elliptic-circular approximation (ECA) is an algorithm for predicting the BTL of the cochlea based on patient-specific measurements A and B. The algorithm was named ECA because it approximates the length of the basal turn by a half ellipse and a half circle, the dimensions of which are adjusted to the individual values of A and B: as shown in Figure 2 , these values are applied to the half ellipse such that the semimajor and semiminor axes correspond to 1/2 A and 4/7 B, respectively, while the radius of the half circle is given by 3/7 B. The uneven distribution of B was chosen per the mean B ratio derived by Pietsch et al.16 The resulting equation can be stated as
Figure 2.
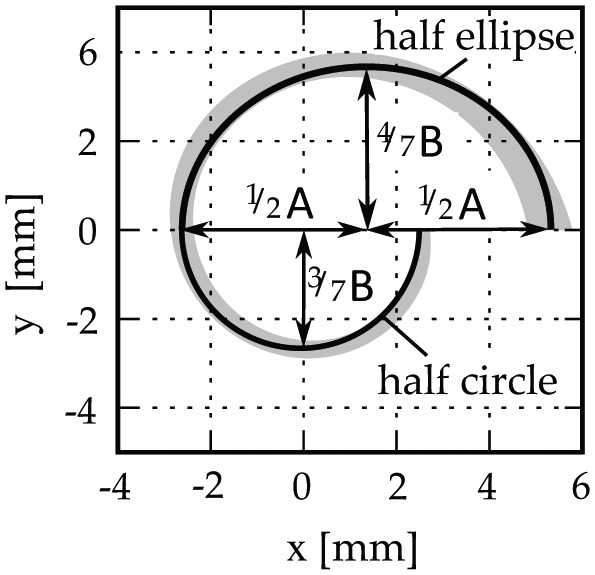
Elliptic-circular approximation of the basal turn length.
| (Equation 1) |
The computation of the patient-specific BTL based on the corresponding measurement values A and B represents the first step of the proposed CDL evaluation approach.
CDL as Percentage BTL
The second step of the proposed method is founded on the idea of expressing the length of the cochlea for any desired cochlear angle as percentage BTL (pBTL):
| (Equation 2) |
To make this approach applicable, one part of the micro-CT analysis (cf Lateral Wall Reconstruction section) consisted of the derivation of these pBTL values for each cochlea angle (0°-900° in 1° steps), the results of which are described in the Derivation of pBTL values section. The most trivial pBTL value is the one for θ = 360°, for which equation 2 can be restated as CDLLW (360°) = 100% BTLLW.
Step 2 of the proposed approach hence requires the multiplication of the individual BTL (equation 1) with the pBTL value of the angle of interest (equation 2).
Electrode Insertion Length Prediction
The 2-step approach (ECA combined with pBTL) was further employed for predicting the electrode insertion angles based on the individual anatomy and a specific cochlear implant electrode array: Alexiades et al13 proposed that the implantable length of the cochlea (ie, CDLi at the level of the electrode) for lateral wall electrodes can be predicted with an offset of 0.35 mm off the lateral wall toward the modiolus. The value of 0.35 mm herein is described as the average radius of a MED-EL FLEX electrode. We therefore used Escudé’s method and simply subtracted 0.7 mm (2 × 0.35 mm) from the basal diameter A to derive a formula for estimating the implantable length for specific cochleae:
| (Equation 3) |
The same can be done with the ECA approximations by subtracting 0.7 mm from A and B:
| (Equation 4) |
which can again be combined with the percentage-based approximation, resulting in
| (Equation 5) |
To evaluate the accuracy of these implantable length predictions, measurements within imaging data sets of the aforementioned cochlear implant electrode arrays were conducted with the clinically applicable software tool OsiriX MD (version 2.5.1, 64 bit; Pixmeo SARL, Bernex, Switzerland):
The basal cochlear diameters A and B 12 were measured within the preoperative CBCT scans ( Figure 3A ).
The length of the inserted electrode array (IEL) and the insertion angle IA were measured within the corresponding postoperative CBCT scans from the center of the round window to the most apical electrode contact (see Figure 3B and 3C).
With equations 4 and 5, the insertion angle was computed for which the predicted implantable length of the cochlea CDLi matches the actual IEL: first, the implantable BTLi was computed with the corresponding values A and B in equation 4. This was followed by calculating the pBTL value for CDLi = IEL of the cochlea according to equation 5:
Figure 3.
Visualization of (A) the basal turn diameter A and width B, (B) the length of the inserted electrode array (IEL), and (C) the insertion angle IA.
| (Equation 6) |
and then looking up what angle the computed pBTL value corresponds to.
4. Finally these predicted insertion angles were compared with the IA measurement values.
Results
Deviation of CBCT and Micro-CT Cochlea Spirals
The result of the reconstructions of the cochlea helices derived from CBCT and micro-CT data is shown in Figure 4A : the ranges of the helices are in agreement overall, but the CBCT spiral range moves toward the modiolus more quickly than the range of micro-CT spirals. Figure 4B shows the radius along the cochlear angle and depicts more clearly that this deviation of CBCT and micro-CT starts within the medial cochlear turn (Δrmean < 0.18 mm for Θ < 450°). Regarding the CDL (CDLLW) that was measured along the lateral wall within this study, the effects of this radial deviation become especially obvious after the first 2 cochlear turns (ΔCDLLW,mean < 0.73 mm for Θ < 720°; see Figure 4C ).
Figure 4.
Differences in mean (A) spiral profiles, (B) spiral radii, and (C) length of the lateral wall derived from cone beam computed tomography (CBCT) and micro–computed tomography (micro-CT) contour tracings. Shaded area: SD.
Derivation of pBTL Values
The second part of the spiral shape analysis of the micro-CT data sets (see Lateral Wall Reconstruction section) aimed at the derivation of the pBTL values described in the Novel CDL Estimation Approach section. The computation of these values was done by dividing each of the 20 length profiles CDLLW(Θ) by the BTLLW—that is, CDLLW (360°)—and averaging the 20 resulting individual pBTL profiles. Figure 5 shows a fairly low variability overall with a standard deviation <4% for Θ < 720°. To make this correlation of BTLLW and CDLLW(Θ) usable, a third-order polynomial fit of the mean curve was performed, yielding the following equation:
Figure 5.
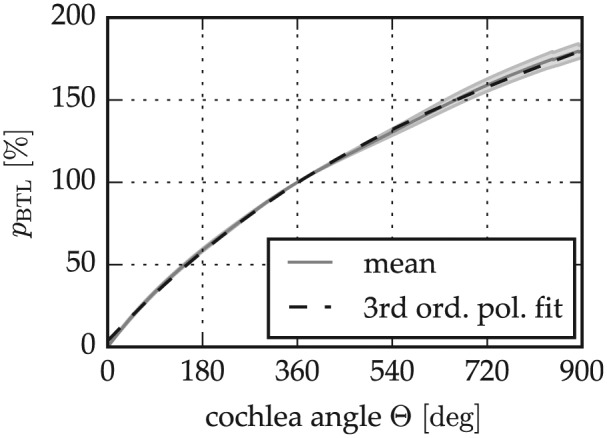
Expression of the cochlear duct length along the cochlear spiral as a percentage of the basal turn length (pBTL) derived from the micro–computed tomography analysis.
| (Equation 7) |
With these equations, the lateral wall length of a specific cochlea for a specific angle Θ can hence be approximated by (1) computing the corresponding BTLLW with equation 1 and (2) multiplying this value with the pBTL value for the cochlear angle of interest Θ. This pBTL value can be either extracted from Figure 5 or computed with equation 7.
Validation of pBTL-Based CDL Estimation
A leave-one-out cross-validation was performed with the 20 micro-CT data sets: pBTL values were computed by averaging 19 of the 20 micro-CT data sets and then applied to estimate the CDLLW of the 20th, which was repeated 20 times. To examine only the error introduced by the pBTL method, the BTLLW value of the cochlear spiral was used (cf equation 2). The results of this cross-validation are shown in Figure 6 . Mean absolute errors and standard deviations of the estimations were evaluated for different numbers of cochlear turns—from 0.5 turn lengths (TL) (0.14 ± 0.12 mm) to 1.5 TL (0.32 ± 0.25 mm), 2 TL (0.64 ± 0.43 mm), and 2.5 TL (0.73 ± 0.44 mm); that is, mean errors stay <1 mm at all times.
Figure 6.
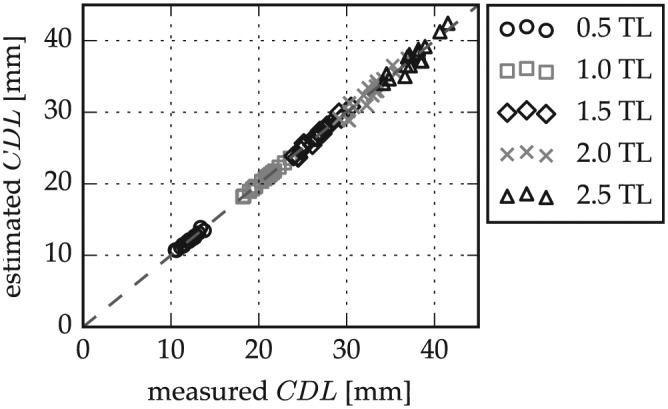
Cochlear duct length (CDL) estimation error in micro–computed tomography data according to basal turn length percentage-based approximation for different numbers of cochlear turns. TL, turn lengths.
Validation of Combining ECA with pBTL-Based CDL Estimation
The second step of the accuracy evaluation was a repetition of the previous cross-validation with ECA estimates of the BTLLW (equation 1). Furthermore, the benefit of this combination of ECA and pBTL in comparison with the previously proposed CDLLW estimation approach of Escudé,12 CDLLW = 2.62 A ln(1 + θ/235), was evaluated. Figure 7 shows the comparison of CDL estimations and measurements for different numbers of cochlear turns with Escudé’s method, Escudé’s method for the basal turn (BTLLW = 2.43A) in combination with the pBTL method, and the combination of ECA and pBTL. Figure 8 shows that the lowest mean errors and standard deviations were derived for the proposed combination of ECA and percentage-based CDL estimation, which performs equally well as the use of direct BTLLW measurement values in equation 2. With the proposed approach, deviations to the reference values could be reduced by 89% and 82% for 2 and 2.5 turns, respectively, in comparison with Escudé’s method.
Figure 7.
Comparison of cochlear duct length (CDL) estimations to the measurement values of (A) Escudé’s method, (B) Escudé’s method for the basal turn length combined with the pBTL-based estimation, and (C) the elliptic-circular approximation (ECA) method for basal turn length approximation combined with the pBTL method. pBTL, percentage basal turn length. TL, turn lengths.
Figure 8.
Absolute estimation errors and SD of the analyzed approaches. BT, basal turn; ECA, elliptic-circular approximation; pBTL, percentage basal turn length. TL, turn lengths.
Clinical Insertion Angle Prediction
Figure 9 presents a comparison of insertion angle predictions according to the Electrode Insertion Length Prediction section with the corresponding insertion angle measurements. A good correspondence of predictions and measurements was found overall, with mean absolute deviations 27° ± 22°.
Figure 9.
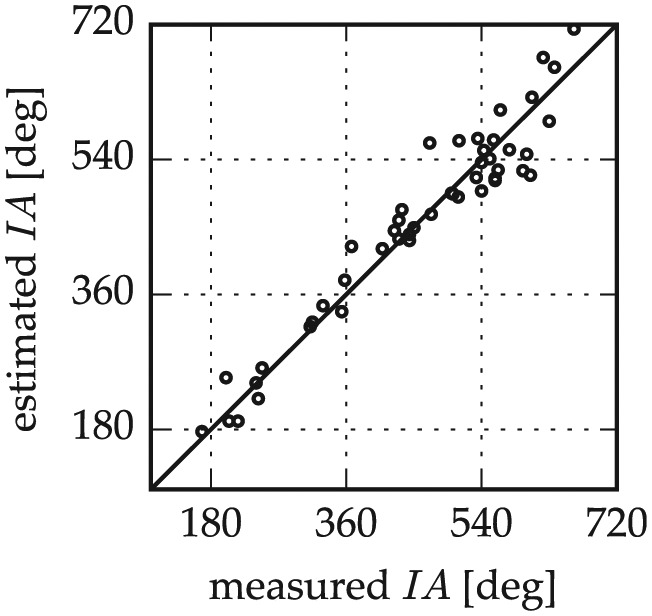
Insertion angle (IA) estimations with the proposed combination of elliptic-circular approximation and percentage basal turn length and a constant offset off the lateral wall.
Discussion
When tracing the lateral wall within clinical CT data, we experienced that identifying the lateral wall is fairly simple in the basal region but becomes more difficult in the middle and apical turn—which initially motivated the derivation of the proposed approach. A likely consequence of this difficulty is shown in Figure 4 , where the lateral wall ranges of CBCT and micro-CT start to deviate after the first cochlear turn, suggesting that the lateral wall contour in CBCT data is expected to be too far inward/toward the modiolus. Fortunately, the effect onto the corresponding CDLLW is not very noticeable within the first 2 cochlear turns ( Figure 4C ). Since cochlear implant electrode arrays reach beyond the first 2 turns in only rare cases, an influence of this deviation onto the selection of a patient-specific cochlear implant electrode array is therefore unlikely. The error can be considered clinically irrelevant. Nevertheless, the proposed 2-step approach is capable of overcoming this issue, and lateral wall tracings or measurements beyond the first cochlear turn become unnecessary.
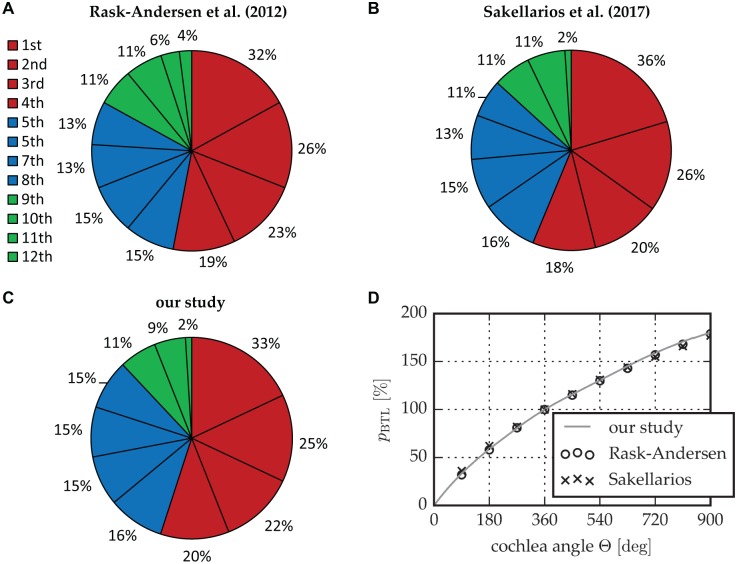
For the reliability of the proposed approach, it is essential that the micro-CT data on which the approach is founded are accurate: Figure 10 shows that the percentage length of each cochlear quadrant regarding the BTL in this study is in agreement with studies by Rask-Andersen et al on 73 corrosion cast samples17 and Sakellarios et al on cochlear micro-CT images.18 Figure 10D further depicts that the pBTL values that could be derived from the other 2 studies agree very well with the proposed ones. This agreement further verifies the reliability of the novel 2-step approach.
Figure 10.
Comparison of the relative length of the cochlear quadrants regarding the BTL proposed by (A) Rask-Andersen et al17 and (B) Sakellarios et al18 relative to (C) this study. (D) A comparison of the corresponding pBTL values. BTL, basal turn length; pBTL, percentage basal turn length.
A likely cause for the high accuracy of percentage-based length estimations (cf Figure 6 ) is that the relative contribution of specific cochlear regions to the overall length is very consistent, which was verified by the low standard deviation range shown in Figure 5 as well as the agreement to previously proposed results shown in Figure 10 . Furthermore, the percentage-based estimation does not imply any analytic interrelations but is purely founded on the actual cochlear shape; ECA estimations take into account that the basal turn diameters A and B are not linearly dependent.8,12 We must emphasize, however, that the approach is founded on and was validated for normal cochleae only. Hence, its application in case of malformations will most likely result in a noticeable accuracy decrease due to the different anatomic correlations.19
While this study focused on round window insertions, the approach is adaptable to cases where a cochleostomy must be performed: in these cases, the BTL equations for the lateral wall and insertion length (equations 1 and 4, respectively) can be used as well. The cochleostomy site must be taken into account only in the second estimation step (equations 2 and 5, respectively) since the parameter Θ therein describes the angle from the round window (with Θ = 0) toward the apex. In cochleostomy cases, the CDL fraction due to the angular offset from round window to the cochleostomy site ΘC must therefore be subtracted from the overall CDL. Hence, equation 2 would have to be restated as
| (Equation 8) |
A general problem with manual measurements of the basal turn parameters is the inter- and intra-user variability20,21: with the proposed approach, the user is still required to manually measure A and B. Rivas et al20 investigated the variability in manual A value assessments and found mean absolute deviations of 0.22 mm to an automated reference approach. In case of average values A = 9.04 mm and B = 6.33 mm,8 this mean variability would yield deviations of the BTL (according to equation 1) up to 0.7 mm. Hence, measurement inconsistencies must be expected, which are likely to increase with decreasing image resolution and user experience.
The proposed extension of the 2-step approach for insertion angle predictions was shown to be quite accurate as well. This is highly relevant if one wants to select an electrode array based on the individual cochlear anatomy: the proposed approach could be employed to select an electrode array that fully covers the cochlea of each patient for electric-only hearing. It can be combined with frequency maps of the cochlea22 and used in cases of combined electric-acoustic stimulation to cover only the frequency range of the cochlea with no functional residual hearing. However, this kind of application requires the consideration of other factors as well, such as the audiologic and medical history of the patient. Furthermore, it should be mentioned that although the insertion angle estimations with the proposed approach are quite accurate, the applied prediction formula assumes a perfect profile of the electrode array along the lateral wall, which might not be achievable in reality due to the bending of the array inside the cochlea. More detailed investigations of the location of cochlear implant electrode array inside the cochlea may therefore increase the reliability of these predictions.
Conclusion
The cochlear anatomy varies from one person to another, and this variation must be taken into account to optimize cochlear implant outcomes by individualized implant selection. The proposed and validated 2-step cochlear length evaluation approach was proven to be simple, accurate, and reliable, which makes it an attractive option for integrating preoperative length evaluations onto the clinical routine. The optional use for insertion angle predictions further enables the surgeon to select electrode arrays based on the frequency coverage needs of the individual patient.
Author Contributions
Daniel Schurzig, data analysis, manuscript composition, final approval, accountability agreement; Max Eike Timm, data acquisition, manuscript composition, final approval, accountability agreement; Cornelia Batsoulis, data analysis, manuscript revision, final approval, accountability agreement; Rolf Salcher, data acquisition, manuscript revision, final approval, accountability agreement; Daniel Sieber, data acquisition, manuscript revision, final approval, accountability agreement; Claude Jolly, data analysis, manuscript revision, final approval, accountability agreement; Thomas Lenarz, data analysis, manuscript revision, final approval, accountability agreement; Masoud Zoka-Assadi, data analysis, manuscript revision, final approval, accountability agreement.
Disclosures
Competing interests: Daniel Schurzig, MED-EL employee; Max Eike Timm, travel funds from MED-EL; Cornelia Batsoulis, MED-EL employee; Daniel Sieber, MED-EL employee; Claude Jolly, MED-EL employee; Thomas Lenarz, travel funds from MED-EL; Masoud Zoka-Assadi, MED-EL employee.
Sponsorships: None.
Funding source: Cluster of Excellence Hearing4all (German Research Council): partial funding of the ear, nose, and throat clinicians (Timm, Salcher, Lenarz) regarding the time that they spent on data collection, analysis, and interpretation.
Acknowledgments
We thank Mayra Windeler for her contribution and the effort that she put into the data acquisition.
Footnotes
Sponsorships or competing interests that may be relevant to content are disclosed at the end of this article.
References
- 1. O’Connell BP, Cakir A, Hunter JB, et al. Electrode location and angular insertion depth are predictors of audiologic outcomes in cochlear implantation. Otol Neurotol. 2016;37:1016-1023. [DOI] [PMC free article] [PubMed] [Google Scholar]
- 2. O’Connell BP, Hunter JB, Haynes DS, et al. Insertion depth impacts speech perception and hearing preservation for lateral wall electrodes. Laryngoscope. 2017;127:2352-2357. [DOI] [PMC free article] [PubMed] [Google Scholar]
- 3. Hochmair I, Arnold W, Nopp P, Jolly C, Mueller J, Roland PS. Deep electrode insertion in cochlear implants: apical morphology, electrodes and speech perception results. Acta Otolaryngol. 2003;123:612-617. [PubMed] [Google Scholar]
- 4. Buechner A, Illg A, Majdani O, Lenarz T. Investigation of the effect of cochlear implant electrode length on speech comprehension in quiet and noise compared with the results with users of electro-acoustic-stimulation, a retrospective analysis. PLoS One. 2017;12:e0174900. [DOI] [PMC free article] [PubMed] [Google Scholar]
- 5. Buchman CA, Dillon MT, King ER, Adunka MC, Adunka OF, Pillsbury HC. Influence of cochlear implant insertion depth on performance: a prospective randomized trial. Otol Neurotol. 2014;35:1773-1779. [DOI] [PubMed] [Google Scholar]
- 6. Adunka O, Kiefer J. Impact of electrode insertion depth on intracochlear trauma. Otolaryngol Head Neck Surg. 2006;135:374-382. [DOI] [PubMed] [Google Scholar]
- 7. Suhling MC, Majdani O, Salcher R, et al. The impact of electrode array length on hearing preservation in cochlear implantation. Otol Neurotol. 2016;37:1006-1015. [DOI] [PubMed] [Google Scholar]
- 8. Meng J, Li S, Zhang F, Li Q, Qin Z. Cochlear size and shape variability and implications in cochlear implantation surgery. Otol Neurotol. 2016;37:1307-1313. [DOI] [PubMed] [Google Scholar]
- 9. Wuerfel W, Lanfermann H, Lenarz T, Majdani O. Cochlear length determination using cone beam computed tomography in a clinical setting. Hear Res. 2014;316:65-72. [DOI] [PubMed] [Google Scholar]
- 10. Hardy M. The length of the organ of corti in man. Am J Anat. 1938;63:291-311. [Google Scholar]
- 11. Schurzig D, Timm ME, Lexow GJ, Majdani O, Lenarz T, Rau TS. Cochlea helix and duct length identification—evaluation of different curve fitting techniques. Cochlear Implants Int. 2018;19:268-283. [DOI] [PubMed] [Google Scholar]
- 12. Escudé B, James C, Deguine O, Cochard N, Eter E, Fraysse B. The size of the cochlea and predictions of insertion depth angles for cochlear implant electrodes. Audiol Neurotol. 2006;11:27-33. [DOI] [PubMed] [Google Scholar]
- 13. Alexiades G, Dhanasingh A, Jolly C. Method to estimate the complete and two-turn cochlear duct length. Otol Neurotol. 2014;36:904-907. [DOI] [PubMed] [Google Scholar]
- 14. Lexow GJ, Schurzig D, Gellich NC, Lenarz T, Majdani O, Rau TS. Visualization, measurement and modelling of the cochlea using rotating midmodiolar slice planes. Int J Comput Assist Radiol Surg. 2016;11:1885-1869. [DOI] [PubMed] [Google Scholar]
- 15. Schurzig D, Lexow GJ, Majdani O, Lenarz T, Rau TS. Three-dimensional modeling of the cochlea by use of an arc fitting approach. Comput Method Biomec. 2016;19:1785-1799. [DOI] [PubMed] [Google Scholar]
- 16. Pietsch M, Aguirre Dávila L, Erfurt P, Avci E, Lenarz T, Kral A. Spiral form of the human cochlea results from spatial constraints. Sci Rep. 2017;7:7500. [DOI] [PMC free article] [PubMed] [Google Scholar]
- 17. Rask-Andersen H, Liu W, Erixon E, et al. Human cochlea: anatomical characteristics and their relevance for cochlear implantation. Anat Rec. 2012;295:1791-1811. [DOI] [PubMed] [Google Scholar]
- 18. Sakellarios AI, Tachos NS, Rigas G, et al. A validated methodology for the 3D reconstruction of cochlea geometries using human microCT images. Meas Sci Technol. 2017;28:054001. [Google Scholar]
- 19. Liu YK, Qi CL, Tang J, et al. The diagnostic value of measurement of cochlear length and height in temporal bone CT multiplanar reconstruction of inner ear malformation. Acta Otolaryngol. 2017;137:119-126. [DOI] [PubMed] [Google Scholar]
- 20. Rivas A, Cakir A, Hunter JB, et al. Automatic cochlear duct length estimation for selection of cochlear implant electrode arrays. Otol Neurotol. 2017;38:339-346. [DOI] [PMC free article] [PubMed] [Google Scholar]
- 21. Lexow GJ, Kluge M, Gellrich NC, Lenarz T, Majdani O, Rau TS. On the accuracy of cochlear duct length measurement in computed tomographic images. Eur Arch Otorhinolaryngol. 2018;275:1077-1085. [DOI] [PubMed] [Google Scholar]
- 22. Greenwood DD. A cochlear frequency-position function for several species—29 years later. J Acoust Soc Am. 1990;87:2592-2605. [DOI] [PubMed] [Google Scholar]


