Abstract
Photoinactivation of bacteria with visible light has been reported in numerous studies. Radiation around 405 nm is absorbed by endogenous porphyrins and generates reactive oxygen species that destroy bacteria from within. Blue light in the spectral range of 450–470 nm also exhibits an antibacterial effect, but it is weaker than 405 nm radiation, and the photosensitizers involved have not been clarified yet, even though flavins and porphyrins are possible candidates.
There are significantly fewer photoinactivation studies on fungi. To test if visible light can inactivate fungi and to elucidate the mechanisms involved, the model organism Saccharomyces cerevisiae (DSM no. 70449) was irradiated with violet (405 nm) and blue (450 nm) light. The mean irradiation doses required for a one log reduction of colony forming units for this strain were 182 J/cm2 and 526 J/cm2 for 405 nm and 450 nm irradiation, respectively. To investigate the cell damaging mechanisms, trypan blue staining was performed. However, even strongly irradiated cultures hardly showed any stained S. cerevisiae cells, indicating an intact cell membrane and thus arguing against the previously suspected mechanism of cell membrane damage during photoinactivation with visible light at least for the investigated strain. The results are compatible with photoinactivated Saccharomyces cerevisiae cells being in a viable but nonculturable state.
To identify potential fungal photosensitizers, the absorption and fluorescence of Saccharomyces cerevisiae cell lysates were determined. The spectral absorption and fluorescence results are in favor of protoporphyrin IX as the most important photosensitizer at 405 nm radiation. For 450 nm irradiation, riboflavin and other flavins may be the main photosensitizer candidates, since porphyrins do not play a prominent role at this wavelength. No evidence of the involvement of other photosensitizers was found in the spectral data of this strain.
Keywords: Saccharomyces cerevisiae, photoinactivation, disinfection, porphyrin, flavin, 405 nm irradiation, 450 nm irradiation
Introduction
The photoinactivation properties of visible light were first observed in the 19th century by Downes and Blunt [1] but fell into oblivion in the face of the more effective ultraviolet (UV) radiation. In the last 15 years, however, visible light disinfection has come back into focus as it has the advantage of being less harmful to human cells and sensitive materials, while maintaining the capacity to inactivate important bacterial pathogens [2–4]. Violet light with a wavelength of about 405 nm is the most effective radiation in the visible range. This light is absorbed by endogenous porphyrins and, in the presence of oxygen, leads to the generation of reactive oxygen species (ROS) that destroy the cells from within [2, 4–6].
The blue wavelength region 450–470 nm also has the ability to reduce bacteria significantly, but the photoinactivation mechanism and the involved photosensitizer have not been elucidated yet. Flavins and porphyrins are obvious candidates [7–12], but the spectral dependence of the photoinactivation results does not agree very well with the published spectral absorption properties of flavins and porphyrins [13, 14].
Meanwhile successful photoinactivation of more than 50 bacterial species has been reported [13, 15], but the number of experiments on fungi is very sparse with less than 10 investigated species [15]. Surprisingly, there is only one published study on the photoinactivation of Saccharomyces cerevisiae. Murdoch et al. irradiated yeast cells with a wavelength of 405 nm under aerobic conditions and observed a 5 log reduction of colony forming units (CFUs) for an applied dose of 288 J/cm2 [16]. They were able to detect a porphyrin fluorescence emission peak at 611 nm and concluded that coproporphyrin may be the main responsible porphyrin. In their study, they hypothesize that either the plasma membrane or the mitochondria might be the point of attack of the generated ROS.
In this study, one Saccharomyces cerevisiae strain is irradiated at 405 and 450 nm to compare the photoinactivation sensitivities at different wavelengths and to search for clues whether riboflavin or other flavins like flavin adenine dinucleotide (FAD) or flavin mononucleotide (FMN) with their absorption peaks around 450 nm are the main responsible photosensitizer in the blue 450–470 nm range.
Materials and Methods
Microorganism and Medium
The yeast strain Saccharomyces cerevisiae (DSM no. 70449) was obtained from Deutsche Sammlung von Mikroorganismen und Zellkulturen GmbH (Braunschweig, Germany) and cultivated in a yeast extract–peptone–glucose (YEPG) medium. The medium consisted of 10 g yeast extract, 20 g peptone from casein, and 50 g glucose per liter. The pH was adjusted to 6.5. Prior to irradiation, S. cerevisiae was cultivated in this medium for 19.5 h at 30 °C on a rotary shaker at 170 rpm. In the next step, the medium was removed, and the resultant pellet was washed in phosphate-buffered saline (PBS). Resuspended yeast cells were diluted in PBS until a starting concentration of about 2 × 10⁶ CFU/mL was reached for experimental use.
Irradiation
Two high power light emitting diodes (LEDs) with emission peaks near the maximum absorption of protoporphyrin IX and riboflavin were selected. The violet LED LZ4-OUUB00.00U8 (LED Engin, San Jose, USA) exhibits a peak emission at 407 nm, and the blue LED LZ4-00B208 (LED Engin, San Jose, USA) has its emission peak at 453 nm (Figure 1). The spectral bandwidth of both LEDs is about 20 nm (full width half maximum). They were placed inside the top of a hollow truncated pyramid that was highly reflective on the inside [17, 18] and leads to a very homogenous illumination at the bottom of the pyramid with an irradiation intensity of 54 mW/cm2 for both wavelengths. Irradiation intensity was measured with an optical power meter OPM 150 (Qioptiq, Goettingen, Germany) and checked after sample drawing at each irradiation dose. Samples were placed below the pyramid in a 5 mL beaker glass and agitated with a magnetic stirrer. The applied irradiation doses were 0, 97.2, 194.4, 291.6, 486, and 583.2 J/cm2 for 405 and 450 nm, respectively. A surrounding water bath kept the temperature within the range of 27 to 30 °C. A separate beaker glass with an equivalent unirradiated sample was kept under the same conditions and served as control.
Figure 1.
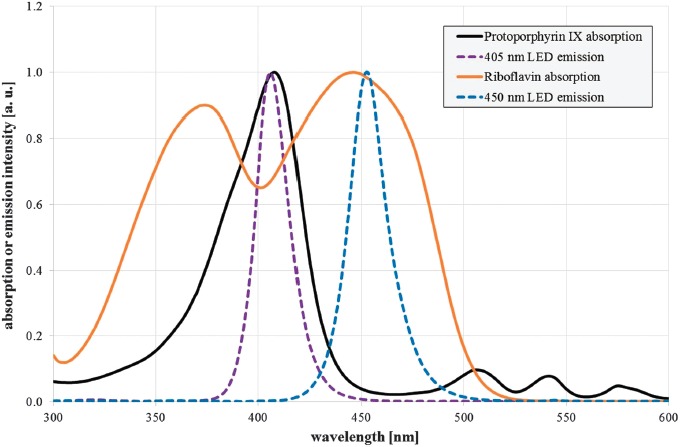
Normalized absorption spectra of protoporphyrin IX in dimethyl sulfoxide (black solid line) and riboflavin in aqueous solution with pH 7.0 (orange solid line), as well as normalized emission spectra of the selected violet and blue LED (violet and blue dotted line)
Colony Quantification
For the determination of the concentration of colony forming units (CFU) in irradiated and untreated control samples, a standard smear test method was employed. One-hundred microliters of samples in different dilution stages were cultured on YEPG agar plates. After incubation at 30 °C for 24 h, CFUs were enumerated manually. For each wavelength, the experiment was repeated three times, with 3 agar plates for each run and each dilution step. The CFU counts for the plates with irradiated samples were compared to the mean value of unirradiated samples at the beginning and the end of the experiments.
Trypan Blue Staining
Trypan blue is a dye that is often used to distinguish between live and dead cells, because only cells with damaged cell membrane are stained [19]. For staining control, some additional S. cerevisiae samples were heated to 100 °C for 7 min. This procedure is similar to the method described in [20]. There, the authors used the fluorophore propidium iodide (PI)—instead of trypan blue—to prove that ultraviolet C (UVC) damaged not only the DNA but also the cell membrane of S. cerevisiae. Here, trypan blue was used to test the hypothesis that photoinactivation with visible light damages S. cerevisiae's cell membrane as suspected in [16]. A staining solution of 0.5% trypan blue (Merck, Darmstadt, Germany) in PBS was prepared and 20 μL of this solution were mixed with 20 μL sample volume. The solutions with stained or unstained cells were examined within 4 min under a microscope in an improved Neubauer counting chamber.
Spectroscopic Measurements of Cell Lysate
S. cerevisiae was cultivated for 19.5 h in YEPG as described above. Afterwards, the cells were washed twice and resuspended in PBS. In the next step, the cells were homogenized 5 × 1 min in a vibrating tube mill (B. Braun Biotech, Melsungen, Germany) with a shaking frequency of 4,000 rpm and mill beads (Sartorius, Goettingen, Germany) with a diameter of 0.24 to 0.30 mm. To remove the cell debris, the resulting broth was centrifuged for about 6 h at 15,000 rpm and 4 °C until a clear, slightly yellow liquid was obtained. The absorption of this cell lysate was measured in a cuvette spectrometer Specord Plus (Analytik Jena, Jena, Germany). The lysate fluorescence was also measured. Excitation was performed either by a violet 405 nm Flexpoint laser (Laser Components, Olching, Germany) or a blue 465 nm laser type LDMC-470-2600 (Lasertack, Kassel, Germany). The laser radiation was coupled into a fluorescence light probe (Ocean Optics, Largo, USA), which's tip was placed inside the cuvette while the fluorescence was detected by a spectrometer (SensLine AvaSpec-2048 XL, Avantes, Appelsdorn, Netherlands).
Results and Discussion
Colony Quantification and Staining Results
The photoinactivation effect was measured by CFU determination after 24 h. The mean CFU ratio of unirradiated to irradiated samples for different doses is depicted as log reduction in Figures 2 and 3 for 405 nm and 450 nm irradiation, respectively. In these figures, exponential reductions with increasing irradiation doses are represented by a straight line. A linear regression provides the slope, which is the reciprocal of the necessary dose for a reduction of one log stage. With the additional assumption that a dose of 0 J/cm2 does not influence the S. cerevisiae concentration, the resulting slopes are 0.005519 cm2/J and 0.001897 cm2/J for 405 and 450 nm, respectively. Therefore, the necessary doses for one CFU log reduction are 181 J/cm2 for 405 nm and 527 J/cm2 for 450 nm.
Figure 2.
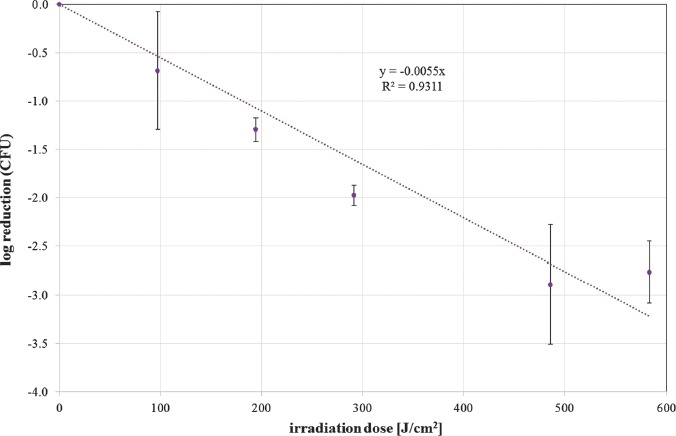
CFU log reduction for increasing doses of 405 nm irradiation for S. cerevisiae (DSM no. 70449). Values are depicted with standard deviation. The spotted curve illustrates the straight line that was fitted to the data. The line equation is given together with the coefficient of determination R2 (mean values and standard deviations out of at least 3 independent experiments with at least 3 evaluated samples for each run and each irradiation dose)
Figure 3.
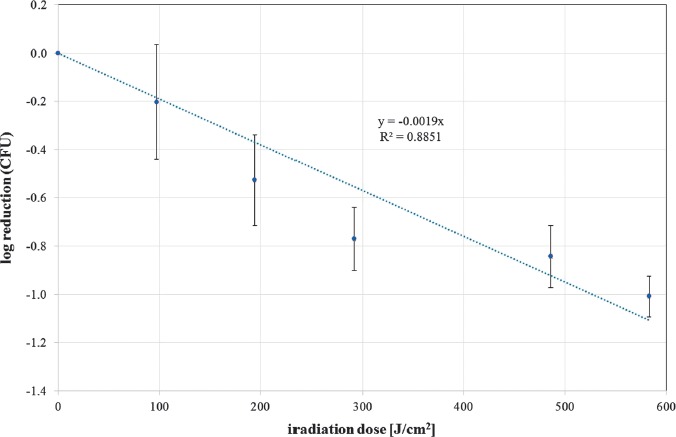
CFU log reduction for increasing doses of 450 nm irradiation for S. cerevisiae (DSM no. 70449). Values are depicted with standard deviation. The spotted curve illustrates the straight line that was fitted to the data. The line equation is given together with the coefficient of determination R2 (mean values and standard deviations out of at least 3 independent experiments with at least 3 evaluated samples for each run and each irradiation dose)
The 405 nm average CFU log reduction dose for S. cerevisiae of Murdoch et al. [16] is about three times lower with only 57.6 J/cm2, though the experimental setup seems to be similar with irradiation intensities of 40 to 63 mW/cm2 (here: 54 mW/cm2), cultivation temperatures of 30 °C to 37 °C (here: 27–30 °C), and sample stirring during irradiation. Nevertheless, there are some differences like another S. cerevisiae strain and different cultivation media. Similar data variations between different experiments have already been observed for the photoinactivation of bacteria [13], sometimes even for identical strains. One possible reason besides unnoticed experimental differences may be the variations in the biochemical composition of the sample cells, which may depend on cultivation media. Another potential reason is the different porphyrin production properties for different S. cerevisiae strains, as have been observed in [21]. Differences in the intracellular photosensitizer concentrations are hard to detect, but may have a large impact on the photoinactivation results. The variation between 57.6 and 181 J/cm2 for a log reduction with 405 nm irradiation seems to be even small compared to the published range of 2 to 1,000 J/cm2 for the yeast Candida albicans [15].
There has been no investigation on photoinactivation of S. cerevisiae besides the 405 nm irradiation results in [16]. Our investigation thus delivers the first results on photoinactivation with blue light at 450 nm and cannot be compared to the literature. The efficacy ratio between 405 nm and 450 nm irradiation is about 2.9, which is in good agreement with the bacterial results that exhibit an efficacy ratio between 2 and 5 between violet (405 nm) and blue (470 nm) radiation [13].
The results of the trypan blue staining are depicted in Figure 4. Figure 4a shows S. cerevisiae in an improved Neubauer counting chamber under a microscope. Most of the cells are unstained as expected for viable cells. Figure 4b illustrates cells that were irradiated at 405 nm with the highest dose of 583.2 J/cm2. According to the agar plate CFU results, all cells are expected to be dead or at least nonculturable. Nevertheless, more than 70% of the cells are unstained. The determined ratio of unstained cells to the total number of cells is 94.6, 91.3, 79.2, 76.0, 84.2, and 72.3% for irradiation doses of 0, 97.2, 194.4, 291.6, 486, and 583.2 J/cm2, respectively. For an easier comparison to Figure 2, these values are depicted as log reduction of unstained cells in Figure 5. As a positive control of the staining procedure in Figure 4c, cells that are visualized were heated to 100 °C for 7 min, resulting in almost 100% colored cells.
Figure 4.

S. cerevisiae (DSM no. 70449) after trypan blue staining in an improved Neubauer counting chamber: a) unirradiated, b) irradiated at 405 nm with a dose of 583.2 J/cm2, and c) unirradiated but heat treated cells (these images are representative pictures out of about 1,500 single photographs)
Figure 5.
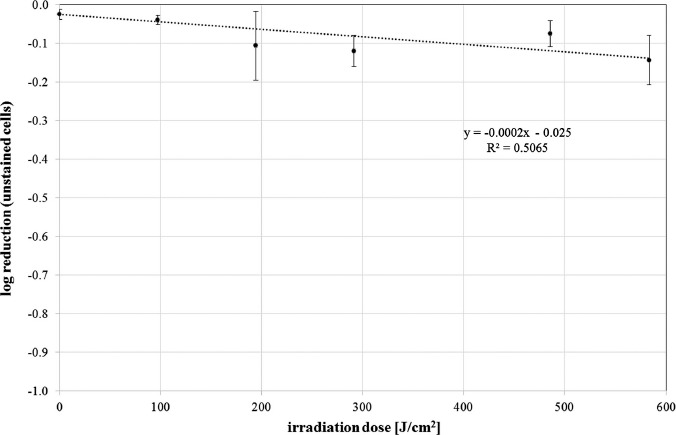
Log reduction of unstained cells for increasing doses of 405 nm irradiation for S. cerevisiae (DSM no. 70449). Values are depicted with standard deviation. The spotted curve illustrates the straight line that was fitted to the data. The line equation is given together with the coefficient of determination R2 (mean values and standard deviations out of 2 independent experiments with at least 3 evaluated samples and assessment of about 32 images for each of these samples)
The 405 nm staining results differ clearly from the 405 nm colony counting results depicted in Figure 2. A dose of 583.2 J/cm2 reduces the CFU concentration by 3 orders of magnitude, but according to the staining results, less than 30% of the cells exhibit a damaged membrane. Similar seemingly contradictory results have been observed by Kwolek-Mirek and Zadrag-Tecza, when comparing different live–dead detection techniques for S. cerevisiae after oxidative stress generated by H2O2 and other chemical reagents [22]. They arrived at the conclusion that staining tests determine the concentration of viable yeast cells, while colony quantification tests rely on the ability of vital cells to multiply. Both concentrations may differ considerably.
This assumption would be able to explain the results we obtained for irradiation at 405 nm. The dose of 583.2 J/cm2 reduces the S. cerevisiae CFU concentration by 3 orders of magnitude for this strain, while most of the cells may not be dead but in a viable but nonculturable state (VBNC).
The fact that more than 70% of the cells have an intact cell membrane—even after applying an irradiation dose of 583.2 J/cm2—also contradicts the hitherto widespread assumption that the plasma membrane is the main point of attack of the ROS generated by visible light.
Spectroscopic Results
The absorption spectrum of the S. saccharomyces cell lysate in Figure 6 (black solid line) shows an increasing absorption for lower wavelengths with a peak at 414 nm. The fluorescence spectrum exhibits emission peaks at about 523, 582, 623, and 682 nm for the 405 nm excitation (violet dotted line) and an emission peak at about 525 nm for the 465 nm excitation (blue spotted line).
Figure 6.
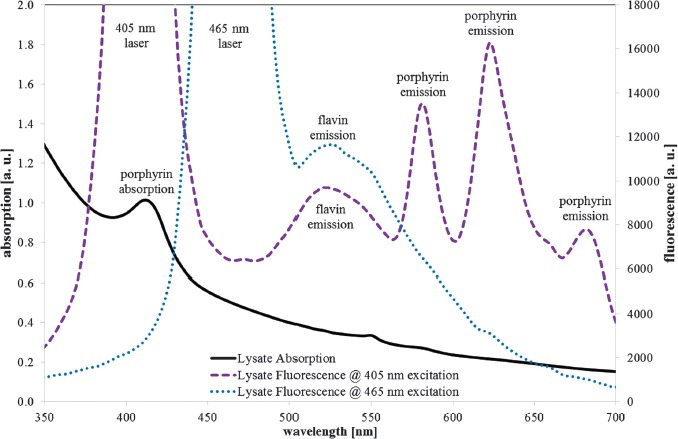
S. cerevisiae (DSM no. 70449) cell lysate absorption (black solid line), fluorescence emission at 405 nm (violet dotted line), 465 nm excitation (blue spotted line), and assumed peak origins
The broad fluorescence peaks around 525 nm can be assigned to the flavins, namely, riboflavin, FAD, and FMN, which all exhibit very similar absorption and emission spectra [23].
The identification of the three narrow emission peaks at longer wavelengths at 405 nm excitation is more difficult. The spectral range, the line width, and the absorption peak at 414 nm are in favor of porphyrins. Unfortunately, porphyrin absorption and emission peak wavelengths are not fixed but depend on pH and other environmental factors that can shift the peak wavelengths up to 10 nm [10, 21, 24].
In [16], a single fluorescence emission around 610 nm for S. cerevisiae was observed and compared to a coproporphyrin emission published in [21]. Therefore, the main porphyrin was assumed to be coproporphyrin.
The 405 nm fluorescence spectrum in Figure 6 is quite different and can hardly be explained just by coproporphyrin. Nevertheless, it may be that there is some coproporphyrin present, because the emission with the strong peak at 623 nm is very similar to the spectrum of a porphyrin mixture of about 30% coproporphyrin and 70% protoporphyrin IX in a Heliobacter pylori suspension published in [25]. For a pure protoporphyrin IX solution, the emission peaks would have been expected at about 630 nm and 690 nm, instead of the observed 623 nm and 682 nm according to [26]. The situation is unclear because there is other data with protoporphyrin IX emission peaks at about 620 nm and 680 nm [10, 24, 26] that would even support the assumption of a pure protoporphyrin IX fluorescence.
The 582 nm emission at 405 nm excitation neither belongs to protoporphyrin IX nor coproporphyrin, but could be caused by a metalloporphyrin like zinc protoporphyrin. S. cerevisiae has the capability of producing high concentrations of metalloporphyrins, especially zinc protoporphyrin [21, 27] with a high fluorescence quantum yield and a peak emission at about 588 nm [28–30].
The so far presented interpretation of fluorescence results at 405 nm excitation being mainly caused by protoporphyrin IX and zinc protoporphyrin is supported by the absorption peak at 414 nm. A coporporphyrin absorption peak would have been expected at about 400 nm, a pure protoporphyrin IX absorption peak at 405–410 nm, and a zinc protoporphyrin absorption peak at 415–420 nm [10, 24, 29–31]. So the observed absorption peak at 414 nm could be explained by the strong, overlapping absorption peaks of protoporphyrin IX and zinc protoporphyrin.
In contrast to porphyrins that show strong absorption only in the spectral region of 380–420 nm, riboflavin and other flavins offer obvious absorption from 340–480 nm and can therefore be excited either with 405 nm or 465 nm laser radiation, which is proven by the flavin emission peaks at about 525 nm for both excitation wavelengths. Further strong fluorescence peaks are not visible in Figure 6 for the 465 nm excitation. There may be very weak protoporphyrin IX fluorescence at about 620 nm, but its intensity is orders of magnitude below the porphyrin fluorescence intensity at 405 nm excitation.
The absence of porphyrin fluorescence at excitation with the blue 465 nm laser, where peak wavelength is near that of the blue LED (453 nm) that was employed for the photoinactivation experiments, suggests that no porphyrins are considerably involved in the 450 nm photoinactivation. The lack of other strong fluorescence peaks—besides the flavin emission—at 465 nm excitation is an indication that at least no other fluorescent photosensitizer is involved. Therefore, flavins are probably the main responsible photosensitizer for 450 nm photoinactivation of S. cerevisiae here.
Conclusion
The irradiation doses required for a one log reduction of colony forming units of this strain of S. cerevisiae are 182 J/cm2 and 526 J/cm2 for 405 nm and 450 nm, respectively. The trypan blue experiments show that only a minority of S. cerevisiae are stained, indicating an intact cell membrane and thus contradicting the previously suspected mechanism of membrane damage during photoinactivation with visible light. Photoinactivation of S. cerevisiae may lead to a viable but non-culturable (VBNC) state.
The results of the spectral analysis in our experiments are not consistent with the previously published hypothesis that coproporphyrin is the main photosensitizer for 405 nm photoinactivation. The absorption and emission spectra both indicate protoporphyrin IX and zinc protoporphyrin being probably the most important photosensitizers.
For 450 nm photoinactivation, however, we could not find any indication for the involvement of porphyrins or any further fluorescent photosensitizers. At this wavelength, flavins appear to be the relevant photosensitizers.
It had to be emphasized that all results and conclusions are based on a single S. cerevisiae strain and culture condition. It cannot be excluded that other strains and culture conditions would lead to different endogenous photosensitizer concentrations and therefore other results.
Footnotes
Funding Sources
No financial support was received for this study.
Authors' Contributions
K. Hoenes, M. Hess, P. Vatter, B. Spellerberg, and M. Hessling contributed on the study concept and design. K. Hoenes, M. Hess, P. Vatter, and M. Hessling performed the experiments. K. Hoenes, M. Hess, P. Vatter, B. Spellerberg, and M. Hessling analyzed and interpreted the data. All authors were involved in drafting, writing and reviewing the paper.
Conflicts of Interest
The authors declare no conflicts of interest.
References
- 1.Downes A, Blunt TP. Researches on the Effect of Light upon Bacteria and other Organisms. Proc R Soc London. 1877;26:488–500. doi: 10.1098/rspl.1877.0068. [Google Scholar]
- 2.Ashkenazi H, Malik Z, Harth Y, Nitzan Y. Eradication of Propionibacterium acnes by its endogenic porphyrins after illumination with high intensity blue light. FEMS Immunol Med Microbiol. 2003;35:17–24. doi: 10.1111/j.1574-695X.2003.tb00644.x. [DOI] [PubMed] [Google Scholar]
- 3.Guffey JS, Wilborn J. In vitro bactericidal effects of 405 nm and 470 nm blue light. Photomed Laser Surg. 2006;24:684–8. doi: 10.1089/pho.2006.24.684. [DOI] [PubMed] [Google Scholar]
- 4.Maclean M, MacGregor SJ, Anderson JG, Woolsey G. High-intensity narrow-spectrum light inactivation and wavelength sensitivity of Staphylococcus aureus. FEMS Microbiol Lett. 2008;285:227–32. doi: 10.1111/j.1574-6968.2008.01233.x. [DOI] [PubMed] [Google Scholar]
- 5.Feuerstein O, Ginsburg I, Dayan E, Veler D, Weiss EI. Mechanism of visible light phototoxicity on Porphyromonas gingivalis and Fusobacterium nucleatum. Photochem Photobiol. 2005;81:1186–9. doi: 10.1562/2005-04-06-RA-477. [DOI] [PubMed] [Google Scholar]
- 6.Maclean M, Macgregor SJ, Anderson JG, Woolsey GA. The role of oxygen in the visible-light inactivation of Staphylococcus aureus. J Photochem Photobiol B. 2008;92:180–4. doi: 10.1016/j.jphotobiol.2008.06.006. [DOI] [PubMed] [Google Scholar]
- 7.Bae S, Oh T. In vitro bactericidal activity of 465-470 nm blue light phototherapy and aminolevulinic acid on Staphylococcus pseudintermedius. Vet Dermatol. 2018. doi: 10.1111/vde.12651. [DOI] [PubMed] [Google Scholar]
- 8.Dai T. The antimicrobial effect of blue light: What are behind? Virulence. 2017;8:649–52. doi: 10.1080/21505594.2016.1276691. [DOI] [PMC free article] [PubMed] [Google Scholar]
- 9.Dai T, Hamblin MR. Visible Blue Light is Capable of Inactivating Candida albicans and Other Fungal Species. Photomed Laser Surg. 2017;35:345–6. doi: 10.1089/pho.2017.4318. [DOI] [PMC free article] [PubMed] [Google Scholar]
- 10.Plavskii VY, Mikulich AV, Tretyakova AI, Leusenka IA, Plavskaya LG, Kazyuchits OA, et al. Porphyrins and flavins as endogenous acceptors of optical radiation of blue spectral region determining photoinactivation of microbial cells. J Photochem Photobiol B. 2018;183:172–83. doi: 10.1016/j. jphotobiol.2018.04.021. [DOI] [PubMed] [Google Scholar]
- 11.Pummer A, Knüttel H, Hiller K-A, Buchalla W, Cieplik F, Maisch T. Antimicrobial efficacy of irradiation with visible light on oral bacteria in vitro: a systematic review. Future Med Chem. 2017;9:1557–74. doi: 10.4155/fmc-2017-0051. [DOI] [PubMed] [Google Scholar]
- 12.Wang Y, Wang Y, Wang Y, Murray CK, Hamblin MR, Hooper DC, Dai T. Antimicrobial blue light inactivation of pathogenic microbes: State of the art. Drug Resist Updat. 2017;33–35:1–22. doi: 10.1016/j.drup.2017.10.002. [DOI] [PMC free article] [PubMed] [Google Scholar]
- 13.Hessling M, Spellerberg B, Hoenes K. Photoinactivation of bacteria by endogenous photosensitizers and exposure to visible light of different wavelengths - A review on existing data. FEMS Microbiol Lett. 2016. doi: 10.1093/femsle/fnw270. [DOI] [PubMed] [Google Scholar]
- 14.Hoenes K, Wild K, Schmid J, Spellerberg B, Hessling M. Microbial photoinactivation by 470 nm radiation: an investigation into the underlying photobiological mechanism. Dai T, editor. Photonic Diagnosis and Treatment of Infections and Inflammatory Diseases; 1/27/2018–2/1/2018; San Photoinactivation of S. cerevisiae Francisco, United States. Bellingham, Washington, USA: SPIE; 2018. p. 20 doi: 10.1117/12.2289110. [Google Scholar]
- 15.Tomb RM, White TA, Coia JE, Anderson JG, MacGregor SJ, Maclean M. Review of the Comparative Susceptibility of Microbial Species to Photoinactivation Using 380-480 nm Violet-Blue Light. Photochem Photobiol. 2018;94:445–58. doi: 10.1111/php.12883. [DOI] [PubMed] [Google Scholar]
- 16.Murdoch LE, McKenzie K, Maclean M, Macgregor SJ, Anderson JG. Lethal effects of high-intensity violet 405 nm light on Saccharomyces cerevisiae, Candida albicans, and on dormant and germinating spores of Aspergillus niger. Fungal Biol. 2013;117:519–27. doi: 10.1016/j.funbio.2013.05.004. [DOI] [PubMed] [Google Scholar]
- 17.Hoenes K, Stangl F, Gross A, Hessling M. Improved contact lens disinfection by exposure to violet radiation. Technol Health Care. 2016;24:145–51. doi: 10.3233/THC-151104. [DOI] [PubMed] [Google Scholar]
- 18.Hoenes K, Stangl F, Sift M, Hessling M. Visible optical radiation generates bactericidal effect applicable for inactivation of health care associated germs demonstrated by inactivation of E. coli and B. subtilis using 405 nm and 460 nm light emitting diodes. Amelink A, Vitkin IA, editors; Sunday 21 June 2015; Munich, Germany: SPIE; 2015. p. 95400 doi: 10.1117/12.2183903. [Google Scholar]
- 19.Strober W. Trypan blue exclusion test of cell viability. Curr Protoc Immunol. 2001; Appendix 3:Appendix 3B. doi: 10.1002/0471142735.ima03bs21. [DOI] [PubMed] [Google Scholar]
- 20.Schenk M, Raffellini S, Guerrero S, Blanco GA, Alzamora SM. Inactivation of Escherichia coli, Listeria innocua and Saccharomyces cerevisiae by UV-C light: Study of cell injury by flow cytometry. LWT - Food Science and Technology. 2011;44:191–8. doi: 10.1016/j.lwt.2010.05.012. [Google Scholar]
- 21.Pretlow T, Sherman F. Porphyrins and zinc porphyrins in normal and mutant strains of yeast. Biochim Biophys Acta Gen Subj. 1967;148:629–44. doi: 10.1016/0304-4165(67)90036-0. [Google Scholar]
- 22.Kwolek-Mirek M, Zadrag-Tecza R. Comparison of methods used for assessing the viability and vitality of yeast cells. FEMS Yeast Res. 2014;14:1068–79. doi: 10.1111/1567-1364.12202. [DOI] [PubMed] [Google Scholar]
- 23.Benson RC, Meyer RA, Zaruba ME, McKhann GM. Cellular autofluorescence–is it due to flavins? J Histochem Cytochem. 1979;27:44–8. doi: 10.1177/27.1.438504. [DOI] [PubMed] [Google Scholar]
- 24.Battisti A, Morici P, Ghetti F, Sgarbossa A. Spectroscopic characterization and fluorescence imaging of Helicobacter pylori endogenous porphyrins. Biophys Chem. 2017;229:19–24. doi: 10.1016/j.bpc.2017.05.010. [DOI] [PubMed] [Google Scholar]
- 25.Hamblin MR, Viveiros J, Yang C, Ahmadi A, Ganz RA, Tolkoff MJ. Helicobacter pylori accumulates photoactive porphyrins and is killed by visible light. Antimicrob Agents Chemother. 2005;49:2822–7. doi: 10.1128/AAC.49.7.2822–2827.2005. [DOI] [PMC free article] [PubMed] [Google Scholar]
- 26.Miah MI. Fluorescence spectroscopy study of protoporphyrin IX metabolism level in cells. Biopolymers. 2001;62:237–40. doi: 10.1002/bip.1018. [DOI] [PubMed] [Google Scholar]
- 27.Grimal D, Labbe-Bois R. An enrichment method for heme-less mutants of Saccharomyces cerevisiae based on photodynamic properties of Zn-protoporphyrin. Mol Gen Genet. 1980;178:713–6. [DOI] [PubMed] [Google Scholar]
- 28.Hart D, Piomelli S. Simultaneous quantitation of zinc protoporphyrin and free protoporphyrin in erythrocytes by acetone extraction. Clin Chem. 1981;27:220–2. [PubMed] [Google Scholar]
- 29.Hu Y, Geissinger P, Woehl JC. Potential of protoporphyrin IX and metal derivatives for single molecule fluorescence studies. Journal of Luminescence. 2011;131:477–81. doi: 10.1016/j.jlumin.2010.12.012. [Google Scholar]
- 30.Zhou P-C, Huang W, Zhang R-B, Zou Z-X, Luo H-D, Falih AA, Li Y-Q. A simple and rapid fluorimetric method for simultaneous determination of protoporphyrin IX and zinc protoporphyrin IX in whole blood. Appl Spectrosc. 2008;62:1268–73. doi: 10.1366/000370208786401536. [DOI] [PubMed] [Google Scholar]
- 31.Huang W, Liu Q, Zhu E-Y, Shindi AAF, Li Y-Q. Rapid simultaneous determination of protoporphyrin IX, uroporphyrin III and coproporphyrin III in human whole blood by non-linear variable-angle synchronous fluorescence technique coupled with partial least squares. Talanta. 2010;82:1516–20. doi: 10.1016/j.talanta.2010.07.034. [DOI] [PubMed] [Google Scholar]


