

Abstract
Cannabis is widely used among adolescents and adults. In the U.S., marijuana laws have been changing, and Americans increasingly favor legalizing cannabis for medical and recreational uses. While some can use cannabis without harm, others experience adverse consequences. The objective of this review is to summarize information on the legal status of cannabis, perceptions regarding cannabis, prevalence and time trends in use and related adverse consequences, and evidence on the relationship of state medical (MML) and recreational (RML) marijuana laws to use and attitudes. Twenty-nine states now have MMLs, and eight of these have RMLs. Since the early 2000s, adult and adolescent perception of cannabis use as risky has decreased. Over the same time, the prevalence of adolescent cannabis use has changed little. However, adult cannabis use, disorders, and related consequences have increased. Multiple nationally representative studies indicate that MMLs have had little effect on cannabis use among adolescents. However, while MML effects have been less studied in adults, available evidence suggests that MMLs increase use and cannabis use disorders in adults. While data are not yet available to evaluate the effect of RMLs, they are likely to lower price, increase availability, and thereby increase cannabis use. More permissive marijuana laws may accomplish social justice aims (e.g., reduce racial disparities in law enforcement) and generate tax revenues. However, such laws may increase cannabis-related adverse health and psychosocial consequences by increasing the population of users. Dissemination of balanced information about the potential health harms of cannabis use is needed.
Keywords: Marijuana, Cannabis, Epidemiology, Medical marijuana, National surveys
1. Introduction
Cannabis (widely called marijuana in the United States) is the most commonly used psychoactive substance in the U.S. aside from alcohol and cigarettes. While some individuals can use cannabis without harm (Fergusson et al., 2015), potential adverse consequences are numerous (Hasin et al., 2016). For example, a withdrawal syndrome (see Supplemental Table 1 for symptoms) can occur after regular heavy use is stopped or decreased (Budney et al., 2004; Haney et al., 2008; Hasin et al., 2008). Cannabis users can also develop cannabis use disorder (CUD), whose criteria, defined in DSM-5 (American Psychiatric Association, 2013), are supported by extensive research in adolescents and adults in clinical and general population settings (Hasin et al., 2013). (see Supplemental Table 2 for list of criteria). Other potential harms from cannabis use include acute psychomotor impairments, which can lead to accidents and fatalities when driving (Desrosiers et al., 2015), with further contributions to fatalities from failure to wear seatbelts and violation of traffic laws (Liu et al., 2016). Many studies show that cannabis use is associated with work problems, loss of a job, and low income [e.g., (Cerdá et al., 2016; Compton et al., 2014; Danielsson et al., 2015; Fergusson and Boden, 2008; Hasin et al., 2016; Henkel, 2011)]. Cannabis use may be especially harmful during certain developmental stages, for example use during pregnancy may harm the fetus (Calvigioni et al., 2014). When used regularly and heavily by adolescents, cannabis may lead to long-term neuropsychological decline and impaired intellectual functioning (Meier et al., 2012), perhaps because brain development is incomplete before early adulthood and cannabis may affect normative neuromaturation occurring in adolescence (Lubman et al., 2015). In addition, cannabis use is related to use of other substances, other substance use disorders, and psychiatric comorbidity (Hasin et al., 2016; Stinson et al., 2006). For these reasons, public health monitoring of cannabis use is important.
The societal and legal landscape regarding cannabis has changed considerably over the last two decades, and continuing change seems likely. The objective of this review is to summarize the current legal status of cannabis; attitudes and perceptions regarding cannabis; the epidemiology of cannabis use and some of its adverse consequences; and the evidence on the relationship of changing state medical marijuana laws (MML) and recreational marijuana laws (RML) to cannabis use and attitudes. We use the formal term “cannabis” throughout except when referring to laws, which are commonly referred to as marijuana laws in the U.S. We begin with a brief history of the legal status of cannabis cultivation, distribution, and use in the U.S. Next, using large nationally representative studies, we review the changing perceptions of cannabis use and its riskiness. We then describe evidence for the effects ofMMLs on changes in prevalence of use and disorder among both adolescents and adults. Finally, we conclude with a summary of current evidence and recommendations for public health practitioners, researchers, policy makers, and voters.
2. Methods
Information about the historical legal status of cannabis and attitudes towards use come from public records and from scholarly presentations of historical materials. More recent data regarding legalization and attitudes come from the public record as well as nationally representative datasets described below. The review of data we present is based on the availability of nationally representative estimates of the prevalence of cannabis use, starting in 1976 for 12th graders, 1991 for other adolescents and adults, and continuing up to the present for all of these age groups (Table 1).
Table 1:
Sources of national data on time trends in cannabis use and cannabis use disorders.
| Survey frequency |
Years of comparable data |
Ages | Sample sizes |
Data collection setting |
Data collection mode | Funders | Substance coverage | Other coverage |
|---|---|---|---|---|---|---|---|---|
| Monitoring the Future (MTF) | ||||||||
| Annual surveys | 1991-Present | 8th graders |
~ 18,000/year |
Schoold | Confidential self-administered |
NIDAa | Substance use | Questions on mood, anxiety, conduct problems, attitudes and |
| 1991-Present | 10th graders |
~ 17,000/year |
Schoold | questionnaires | perceptions | |||
| 1976-Present | 12th graders |
~ 16,000/year |
Schoold | |||||
| National Survey on Drug Use and Health (NSDUH) | ||||||||
| Annual surveys | 2002–2015 | 12–17 18 and older |
~ 23,000/year ~ 47,000/year |
Home | Confidential interviewer & self-administered interview | SAMHSAb | Substance use, current DSM-IV substance disorders | Scales on major depression, attitudes and perceptions |
| National Epidemiologic Surveys on Alcohol and Related Conditions (NESARC) | ||||||||
| Three surveys, | 1991–1992 | 18 and | 42,862 | Home | Confidential | NIAAA,c | Substance use, current, | Current, past, lifetime DSM-IV |
| one with | (NLAES) | older | interviewer-administered | NIDAb | past, lifetime DSM-lVe | (NESARC) and DSM-5 (NESARC-III) | ||
| 3-year | 2001 −2002 | 18 and | 43,093 | interview | co-funding | and (NESARC-III) DSM-5f | psychiatric disorders, trauma, | |
| follow-up | (NESARC | older | substance disorders | family history, discrimination | ||||
| (NESARC | Wave 1) | |||||||
| Wave 2) | 2004–2005 (NESARC Wave 2) 2012–2013 (NESARC-III) |
20 and older 18 and older |
36,653 36,309 |
|||||
National Institute on Drug Abuse, National Institutes of Health.
Substance Abuse and Mental Health Services Administration.
National Institute on Alcohol Abuse and Alcoholism, National Institutes of Health.
Questionnaires distributed and collected by survey personnel and not available to teachers or school staff.
Diagnostic and Statistical Manual, American Psychiatric Association, fourth edition (1994).
Diagnostic and Statistical Manual, American Psychiatric Association, fifth edition (2013).
2.1. Major sources of information on U.S. national time trends
Three series of large national surveys contribute important information about time trends in cannabis use in the general population. First, Monitoring The Future (MTF) (Survey Research Center, 2016) consists of annual surveys of 8th-, 10th, and 12th-grade students. Second, the National Survey on Drug Use and Health (NSDUH) (Substance Abuse and Mental Health Services Administration, 2014), are annual surveys of household residents age 12 and older. Third, the National Institute on Alcohol Abuse and Alcoholism (NIAAA) has conducted surveys of adult household residents age 18 and older (National Institute on Alcohol Abuse and Alcoholism). The NIAAA surveys include the National Longitudinal Alcohol Epidemiology Survey (NLAES, 1991–1992); the 2001–2002 NESARC; a Wave 2 three-year follow up of the NESARC sample (2004–2005); and the NESARC-III (2012 — 2013), a survey of a new sample of participants. Collectively, these three national data sources all cover drug and alcohol use, attitudes and risk perceptions associated with different drugs, and substance use disorders as defined by DSM- IV and DSM-5. Additional (Grant et al., 2015; Hasin et al., 2015a) detail about these surveys is summarized in Table 1. While the specific survey questions about perceptions of cannabis, respondent use of cannabis, and diagnostic criteria for CUD vary somewhat, as noted in tables, figures, and text, all surveys use the same DSM-IV diagnostic criteria for CUD for adolescents and adults because psychometric studies show that the structure and functioning of symptoms are similar in both groups, even though mean rates of symptoms are lower in adolescents (Hasin et al., 2013).
3. Results
3.1. Marijuana legalization
3.1.1. Federal position
During the 1800s and the early 1900s, U.S. physicians and pharmacists dispensed cannabis for various medical purposes. In 1937, the Federal Marijuana Tax Act was passed, consistent with the prohibitionist times (McKenna, 2014). This act did not legally prohibit medical distribution of cannabis, but made physician reporting requirements so burdensome that they effectively discouraged this practice. In the Federal Controlled Substance Act of 1970 (Pacula et al., 2002), the Federal Drug Enforcement Agency defined cannabis as a “Schedule 1” substance, i.e., no accepted medical use and high risk of addiction. This law made medical and recreational cannabis use illegal. Despite the Federal stance against medical marijuana, Americans have long favored its use for medical purposes (Eddy, 2010).
3.1.2. State medical marijuana laws
Since California passed the first state law permitting cannabis use for medical purposes in 1996 (ProCon.org, 2016), an increasing number of states have laws in conflict with the Federal position. At present, 28 additional states have passed MML, albeit with considerable state-to-state variation in the specific provisions of the laws (Pacula et al., 2015). In 2009, the US Attorney General announced new guidelines for federal prosecutors in MML states (the “Ogden memo”), instructing them not to prosecute individuals fully compliant with state MML (Ogden, 2009). The Ogden memo gave states flexibility in their implementation of MML, leading to increased dispensaries and registered users, particularly in Colorado (Davis et al., 2016; Hasin et al., 2017d; Salomonsen-Sautel et al., 2014; Schuermeyer et al., 2014) and California (Hasin et al., 2017d).
3.1.3. State recreational marijuana laws
Since the 1970s, states have varied in their penalties for recreational marijuana. The effects of these state laws are unclear, with most adults not knowing the provisions of their own state law (MacCoun et al., 2009). What is clearer is that laws criminalizing marijuana have been widely applied to low-level possession charges, with sharply disproportionate arrest rates among Blacks and other minorities (King and Mauer, 2006). A major shift in state law occurred in 2012, when Colorado and Washington State passed laws permitting adult recreational cannabis use (i.e., recreational marijuana laws, or RML). Since then, six additional states and the District of Columbia have passed RML. As more states consider legalizing medical or recreational use, understanding the relationship between marijuana laws, cannabis use, and associated consequences is of interest to epidemiologists, addiction researchers, policymakers, and voters.
3.2. Attitudes towards cannabis: acceptability and perceptions of harmfulness
3.2.1. Earlier cultural attitudes as reflected in historical sources, the media and laws
During the early 1900s, when prohibitionist attitudes towards substances gained ascendance, cannabis came to be seen as a highly dangerous drug, typified by the 1930s movie entitled, “Reefer Madness” (Schlosser, 1994) and an article in the 1936 American Journal of Nursing characterizing those intoxicated with cannabis as individuals who “would suddenly turn with murderous violence upon whomever is nearest...run amuck with knife, axe, gun, or anything else...” (Musto, 1991). In the 1960s and 1970s, cannabis use became more acceptable among young White adults, who overwhelmed the legal system as arrestees in the late 1960s and 1970s until marijuana felony penalties were relaxed (Aldrich and Mikuriya, 1988; Brownell, 1988). A reaction against widespread use was typified in the 1980s by First Lady Nancy Reagan’s “Just Say No” public campaign (Bellum, 2011).
Since then, U.S. attitudes towards cannabis have become more accepting. Beginning in the early 1970s, when polling first tracked national opinion about cannabis, the percent of U.S. adults favoring legal recreational use has steadily increased, reaching a majority in 2011 and now at 60% (Gallup, 2016). If medical marijuana laws reflect general attitudes towards cannabis, then these laws also represent increasingly permissive attitudes, as do the eight state legalizations of recreational marijuana use since 2012.
3.2.2. Information on public attitudes from U.S. national surveys
Perceptions of cannabis use are measured in U.S. national surveys (e.g., MTF, NSDUH). In NSDUH, perceived harmfulness of regular cannabis use is measured with the question: “How much do people risk harming themselves physically and in other ways when they smoke marijuana once or twice a week?” Response options included ‘no risk’, ‘slight risk’, ‘moderate risk’, and ‘great risk’. In MTF, perceived harmfulness of regular cannabis use is measured with the question: “How much do you think people risk harming themselves (physically or in other ways), if they smoke marijuana regularly?” Response options similarly included ‘no risk’, ‘slight risk’, ‘moderate risk’, and ‘great risk’, and ‘can’t say, drug unfamiliar’.
Data from these surveys clearly indicate that among adolescents, perceptions of cannabis use in the U.S. are becoming more positive (Fig. 1). Among MTF participants, adolescents seeing moderate or great risk in occasional use decreased substantially between 1991 and 2015, from 84.0% to 53.8% (Keyes et al., 2016). Similar trends were found in the NSDUH surveys. Since 2002, perceived harmfulness ofcan-nabis use declined among those aged 12–17 (Azofeifa et al., 2016; Pacek et al., 2015), and by 2014, more than half of all 12th graders perceived no or slight harm in using cannabis once or twice a week (Sarvet et al., 2017). An exception to these trends is the finding that perceived harmfulness of cannabis use increased among 8th graders in states with medical marijuana laws after passage of MML, compared to 8th graders in states without marijuana laws (Keyes et al., 2016).
Fig. 1.
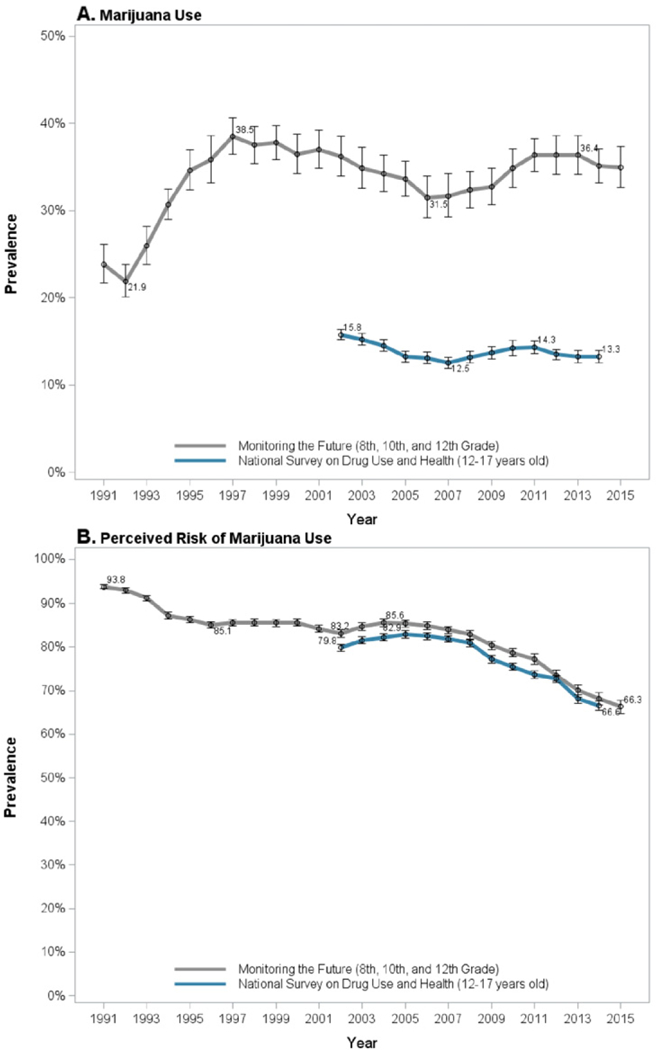
Trends in adolescent past-year marijuana use and marijuana risk perceptions.1 perceive moderate or great risk of harm in smoking marijuana “once or twice a week” (NSDUH) or “regularly“ (MTF).
Among U.S. adults, NSDUH data also show a decrease in perceived harmfulness of cannabis since 2002 (Fig. 2; Azofeifa et al., 2016; Compton et al., 2016; Pacek et al., 2015). Between 2002 and 2014, the prevalence of perceived great risk in cannabis use decreased from 50.4% to 33.3%, while the prevalence of perceiving no risk increased from 5.6% to 15.1% (Compton et al., 2016). The greatest decrease occurred since 2007 (Compton et al., 2016; Pacek et al., 2015). Among adults, younger age groups are consistently less likely to perceive great risk from regular cannabis use. In NSDUH surveys, prevalence of perceived risk decreased for all age groups between 2002 and 2012 (Pacek et al., 2015). Perceptions of risk also decreased within other demographic groups. For example, the prevalence of perceived great risk of regular cannabis use decreased from 58.8% in 2002 to 46.7% in 2012 among women, and from 43.2% in 2002 to 33.5% in 2012 among men (Pacek et al., 2015), and decreased by 11.8% among Whites and His-panics, and 11.5% among Blacks (Pacek et al., 2015). After adjusting for sociodemographic characteristics and cannabis use, characteristics associated with perceiving cannabis use as less risky included high school or greater education, greater household income (i.e., >$75,000), younger age, and being male and non-Hispanic White (Pacek et al., 2015). Given the inverse relationship often found between perceived harmfulness and actual cannabis use (Compton et al., 2016; Keyes et al., 2016), trends in perceptions of risk are seen as important bellwethers of trends in actual use.
Fig. 2.
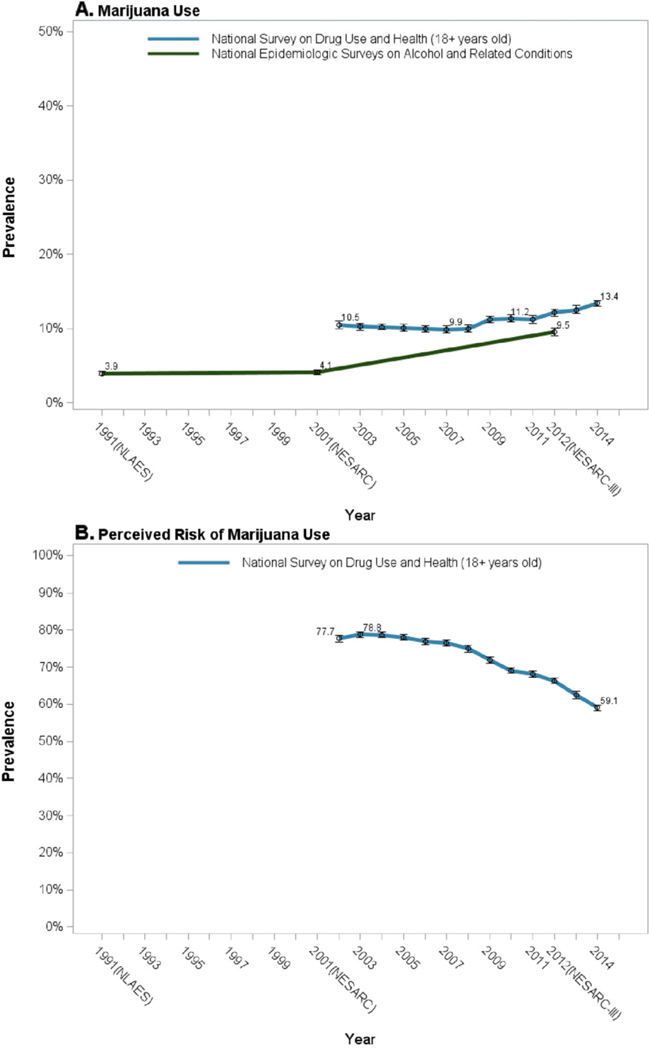
Trends in adult (18+) past-year marijuana use and marijuana risk perceptions.1
3.3. Epidemiology of cannabis use and cannabis use disorder, and relationship to cannabis legalization
3.3.1. Adolescents
3.3.1.1. Overall trends.
Adolescent cannabis use has fluctuated over time. In MTF 12th graders, the prevalence of past-year use reached an all-time peak of just over 50% in 1979, an all-time low of 22% in 1992, and was 36% in 2016 (Survey Research Center, 2016). Similarly, when including 8th, 10th, and 12th graders together in the MTF surveys the prevalence of past-year use ranged between 30 and 40% since the mid-1990s (Fig. 1). In NSDUH, which provides consistently-measured data since 2002, adolescent prevalence of past-month use was highest, 8.2%, in 2002, decreasing to 7.0% in 2015 (Center for Behavioral Health Statistics and Quality, 2016). Prevalence of past-year use ranged between 12% and 16% for 12–17 year olds between 2002 and 2014 (Fig. 1).
3.3.1.2. Demographic characteristics.
The prevalence of cannabis use increases with age among adolescents, as shown in the MTF participants (Survey Research Center, 2016). Time trends across grades are generally consistent, with an exception that since 2013, 8th and 10th grade prevalence decreased, while 12th grade prevalence increased slightly. Male 12th graders consistently have higher prevalence than females (Lanza et al., 2015). Earlier, rates of cannabis use differed consistently between White and Black 12th graders, with Whites having higher prevalence from 1976 to about 2005. Subsequently, rates increased sharply among Black 12th graders, narrowing the Black-White difference by 2013 (Lanza et al., 2015).
Among 12–17 year old NSDUH participants since 2002, the prevalence of cannabis use has ranged between 11% and 15% among females and males, with evidence of an increasing gender gap over time (Pacek et al., 2015). Daily use is more common among males and has remained relatively constant in both genders over time (Azofeifa et al., 2016; Pacek et al., 2015). In 2002, the prevalence of non-daily cannabis use was higher among Whites, compared to Blacks and Hispanics, however this difference narrowed or reversed by 2012. In contrast, prevalence of daily use remained higher among Whites throughout this same time span (Pacek et al., 2015).
3.3.1.3. Medical marijuana laws and adolescent cannabis use.
Determining a causal effect of state-level marijuana legalization on cannabis use is challenging because MMLs are not randomly assigned to states. An early study showed that teen cannabis use was higher in MML than non-MML states (Wall et al., 2011), but as pointed out by the authors, cannabis use may have been higher in those states even before the MML were passed (Wall et al., 2011). Since then, studies have used statistical methodology to address the causality of MML by comparing changes in states before and after MML passage to contemporaneous changes in states that did not pass MML. This methodology is known as the difference-in-differences (DiD) approach (Angrist and Pischke, 2008; Hunt and Miles, 2015; Imbens and Wooldridge, 2009), which provides evidence on causality if its assumptions are met.
Four U.S. nationally representative datasets have been used by researchers to investigate the relationship of MMLs to changes in prevalence of adolescent cannabis use with DiD approaches, including the MTF and NSDUH surveys. Data also came from the National Longitudinal Surveys of Youth (NLSY) and the Youth Risk Behavior Surveys (YRBS). The former represents a specific cohort of over 40,000 12–20 year olds studied longitudinally by the U.S. Bureau of Labor Statistics, starting in 1997. The latter are biennial surveys conducted by the Centers for Disease Control and Prevention in association with state and local agencies, comprising 3.8 million high school students surveyed since 1991. Additional details on the surveys can be found in Table 2.
Table 2:
Studies assessing the effect of cannabis legalization on perception of risk and past-month cannabis use.
| Study |
Main sample size |
# of MML states included with pre-post data |
Years | Pre-post MML change in past-month cannabis use within MML states |
||
|---|---|---|---|---|---|---|
| Age (if applicable) |
#of participants |
Odds Ratio [OR] or Prevalence Difference [PD] (95% CI) |
Overall finding: + indicates a statistically significant increase; — indicates a statistically significant decrease |
|||
| Adolescents | ||||||
| Cannabis use prevalence (past-month) | ||||||
| MTF | (13–18)a | 1,098,270 | 21 | 1991–2014 | OR = 0.92 (0.82,1.04) | n.s. |
| (13–18)a | 973,089 | 21 | 1992–2014 | OR = 0.95 (0.86,1.04) | n.s. | |
| NLSY | 12–19 | 40,986b | 6 | 1997–2003 | PD = −0.4 (−4.71,3.91) | n.s. |
| 12–20 | 46,375b | 7 | 1997–2005 | PD = +0.5 (−1.46, 2.46) | n.s. | |
| 12–20 | 46,321b | 7 | 1997–2005 | PD = +0.4 (−1.56, 2.36) | n.s. | |
| NSDUH | 12–20 | ~256,000 | 8 + D.C. | 2004–2012 | PD = +1.38 (−1.95,4.71) | n.s. |
| 12–20 | ~183,600 | 6 + D.C. | 2004–2011 | PD = −0.62 (−1.56, 0.32) | n.s. | |
| 12–20 | ~269,500 | 9 + D.C. | 2004–2012 | PD = −0.43 (−1.37, 0.51) | n.s. | |
| 12–17 | ~175,000c | 10 | 2004–2013 | OR = 1.03 (0.97,1.09) | n.s. | |
| 12–17 | 250d | 8 | 2002–2011 | PD = +0.86 (0.27,1.45)e | + | |
| 12–18 | 250d | 8 | 2002–2011 | PD = +0.43 (−0.12, 0.98) | n.s. | |
| 12–17 | 539d | 12 + D.C. | 2002–2013 | PD = −0.12 (− 0.88, 0.64) | n.s. | |
| YRBS | ~16f | 846,928 | 16 + D.C. | 1993–2011 | PD = −0.7 (−2.86,1.46) | n.s. |
| ~16f | NAg | 5 | 1991–2011 | PD = +0.7 (−0.7, +2.0) | n.s. | |
| ~16f | 715,014 | 12 | 1991–2011 | OR = 0.93 (0.86, 0.99) | — | |
| NA | NA; | 11 | 1991–2011 | PD = −1.0 (− 7.47, 5.47) | n.s. | |
| state-level | ||||||
| Perceived riskiness of cannabis | ||||||
| MTF | (13–18)a | 973,089 | 21 | 1992–2014 | OR = 1.03 (0.93,1.15)h | n.s. |
| NSDUH | 12–14 | ~111,100 | 10 | 2004–2013 | OR = 1.03 (0.90,1.17)i | n.s. |
| years | ||||||
| 15–17 | ~114,000 | OR = 0.99 (0.92,1.06)i | n.s. | |||
| years | ||||||
| 18–25 | ~225,200 | OR = 1.03 (0.98,1.07)j | n.s. | |||
| years | ||||||
| Adults | ||||||
| Cannabis use prevalence (past-month) | ||||||
| NSDUH | 21 + years | ~269,500 | 9 + D.C. | 2004–2012 | PD = +1.32 (0.18, 2.46) | + |
| 18–25 | ~175,000 | 10 | 2004–2013 | OR = 0.97 (0.93,1.02) | n.s. | |
| years | ||||||
| 26 + years | ~188,000 | OR =1.24 (1.16,1.31) | + | |||
| NIAAA | 18+ years | 118,497 | 15 | 1991–2012 | PD = +1.43 (0.49, 2.37)k | + |
| surveys | ||||||
| Perceived riskiness of cannabis | ||||||
| NSDUH | 18–25 | 357d | 6 + D.C. | 2002–2009 | PD = −0.09 (−1.2,1.0) | n.s. |
| years | ||||||
| 26+ years | PD = +0.23 (−1.4,1.9) | n.s.j,k | ||||
Some respondents are older than 18 or younger than 13 in MTF sample, but ages were censored for these groups in analytic files.
Person years.
Sample N not provided in manuscript. Approximate N is provided based on approximate sample sizes of included states ([17,500 * (all 50 states)] * 10 years = 131,850).
Analyses performed on statewide aggregated data.
Estimand provided in study comes from model that does not control for pre-law differences in adolescent cannabis use between MML and non-MML states all [Stolzenberg], and therefore includes both the pre-law difference between MML and non-MML states and the pre-post change in adolescent cannabis within MML states.
Age range of overall sample not reported. Mean age estimated based on reported mean age of sample in MML (16.0) and non-MML states (16.2) within National YRBS sample.
Unweighted sample size not reported in manuscript.
Great or moderate perceived risk of smoking cannabis occasionally.
Not a great perceived risk of smoking cannabis weekly.
Great perceived risk of smoking cannabis monthly.
Past-year cannabis use.
Virtually all studies based on these four surveys suggest no effect of MMLs on prevalence of adolescent use (Table 2). Collectively, these studies included millions of participants, and data from the years 1991–2014. The only study to find a slight increase in use used incorrect statistical methodology (Stolzenberg et al., 2016; Wall et al., 2016). One study found a slight but significant decrease in cannabis use following passage of MMLs (Johnson et al., 2017).
In the largest study of adolescents, we used DiD methods to analyze over one million MTF adolescents (Hasin et al., 2015c). The study showed that since 1991, rates of adolescent cannabis use were higher in MML-than non-MML states prior to law passage. However, importantly, no post-MML increases were observed in MML states, either in the primary analyses or in over fifty sensitivity analyses. These sensitivity analyses included, for example, indicators of whether MML states had provisions for dispensaries, and varying time lags. In fact, stratifying participants by grade, 8th graders decreased cannabis use post-MML, a result that was also robust in many sensitivity analyses.
3.3.1.4. Recreational marijuana laws.
Very little is known about the relationship of recreational marijuana laws to adolescent cannabis use. Using MTF data and DiD tests to compare Washington and Colorado pre- and post-RML to other MML and non-MML states (Cerda et al., 2017), cannabis use increased post-RML in adolescents in Washington but not Colorado, so a consistent picture has not emerged. Further studies of the relationship of RML to adolescent cannabis use will be important when more information becomes available.
3.3.2. Adults
3.3.2.1. Overall trends.
Among adults, the main sources of time trend information in the general population are the NSDUH and NIAAA surveys (Table 2). The NIAAA surveys show that past-year cannabis use was fairly stable at about 4% in 1991–1992 and 2001–2002 (Compton et al., 2004), but increased to 9.5% by 2012–2013 (Hasin et al., 2015b). Further, significant increases in past-year use and CUD were found in virtually all population subgroups (e.g., gender, age, income) in NESARC-III (Hasin et al., 2015b). In the NSDUH surveys, prevalence of past-year use also increased between 2002 and 2014, as did mean days of use/ year and daily/near-daily use (Fig. 2). However, in NSDUH, the prevalence of past-year cannabis use disorder changed little between 2002 and 2014, remaining at about 1.5% (Compton et al., 2016).
3.3.2.2. Demographic characteristics
3.3.2.2.1. Age.
In NESARC and NESARC-III, past-year cannabis use and CUD were most prevalent among young adults age 18–29, and the prevalence of past-year cannabis use increased significantly in all age groups over time (Hasin et al., 2015c). Further, younger adults increased past- year use at significantly greater rates than those in older age groups (Mauro et al., 2017). In NSDUH between 2002 and 2012, rates of past- year non-daily cannabis use were highest among male and female adults aged 18–25 (about 27% and 25%), but appeared descriptively to increase at greater rates among adults age 26–49 and 50 + since 2007 (Pacek et al., 2015), with a significant narrowing of the difference in ages between younger and older adult NSDUH participants since 2007 (Mauro et al., 2017). Daily cannabis use increased at similar rates across NSDUH participants in all adult age groups since 2007 (Mauro et al., 2017).
3.3.2.2.2. Gender.
Earlier data on adult trends in cannabis use by gender came from a series of smaller national surveys, the National Alcohol Surveys conducted in 1984, 1990,1995, and 2000 (Kerr et al., 2007). Over these years, the prevalence of cannabis use declined, particularly among men, suggesting that the historically higher prevalence of cannabis use in men was narrowing (Kerr et al., 2007), consistent with a contemporaneous narrowing of the gender gap in the prevalence of heavy drinking and alcohol problems (Keyes et al., 2008; Keyes et al., 2011). However, more recent data indicate that narrowing of the gender gap did not continue, and even reversed. Comparing NESARC to NESARC- III, both past-year cannabis use and CUD increased among both men and women, but the rates were significantly greater among men (Hasin et al., 2017c; Hasin et al., 2015c).
NSDUH data between 2002 and 2014 also indicated widening rather than narrowing of gender difference in cannabis use (Carliner et al., 2017). Up to 2007, the gender difference in prevalence of past-year cannabis use remained fairly constant, around 13% in men and 7% in women. However, starting in 2007, men began a significantly faster rate of increase (4.4%) than women (2.7%). Further examination by income indicated that this widening gender difference was concentrated among participants living in low-income households (Carliner et al., 2017).
Cannabis use among pregnant women can be seen as a gender-related issue, even if it does not involve direct comparisons of men and women. While evidence on the effects of prenatal cannabis exposure is still developing (Volkow et al., 2016), human and animal studies suggest that such exposure may be associated with numerous negative fetal and child health outcomes, e.g., deficits in fetal growth, neurodevelopment, and birthweight (Calvigioni et al., 2014). Therefore, the American College of Obstetricians and Gynecologists recommends that pregnant women and women contemplating pregnancy refrain from cannabis use (American College of Obstetricians and Gynecologists Committee on Obstetric Practice, 2015). Nevertheless, cannabis use has increased among pregnant women and non-pregnant women of reproductive age at similar rates (Brown et al., 2017). From 2002 to 2014, past month cannabis use increased 62% among pregnant women, and 47% among non-pregnant reproductive age women, with prevalences highest among women 18–25 years old (Brown et al., 2017). Other vulnerable pregnant women include those who are unmarried and/or with low incomes (Ko et al., 2015).
3.3.2.2.3. Race/ethnicity.
Increases in past-year cannabis use and cannabis use disorder occurred within race/ethnic groups in NESARC surveys (Hasin et al., 2015c). In NSDUH, no race/ethnic increases were found between 2002 and 2007 (Shmulewitz et al., 2016). However, between 2007 and 2014, Whites increased their prevalence of past-year cannabis use at a significantly greater rate than Blacks or Hispanics (Shmulewitz et al., 2016).
3.3.2.2.4. Income.
Past-year cannabis use and cannabis use disorder increased significantly for adults at all income levels between NESARC Wave 1 and NESARC-III (Hasin et al., 2015c). However, those with the lowest incomes had the highest risk and the greatest rates of increase in past-year cannabis use and disorder (Hasin et al., 2017c). In NSDUH, past-year cannabis use increased among men and women at all income levels between 2007 and 2014 (Carliner et al., 2017). Among adults with annual household incomes <$50,000, these increases were greater among men than among women. Similar trends were found among both daily (>300 days/year) and non-daily past- year cannabis users (Carliner et al., 2017).
3.3.2.2.5. Additional sources of information on time trends in cannabis- related outcomes.
Over the last 15 years, numerous additional studies provided information on time trends in cannabis use disorder and other adverse cannabis outcomes (Table 3). Between 2004 and 2011, cannabis-related emergency department visits increased by 62% annually (Zhu and Wu, 2016). A 27-year series of over 190,300 gastroenterology patients also indicated significant increases in CUD and emergency department visits (Gubatan et al., 2016). A study of national inpatient hospital records from 2002 to 2011 indicated increases in hospital admissions in which patients received ICD-9 diagnoses of cannabis use disorder (abuse or dependence) (Charilaou et al., 2017). An additional study of national hospital record discharge diagnoses from 1997 to 2014 also showed substantial increases in ICD-9 diagnoses of cannabis use disorders over this longer period of time, but reductions in opioid-related hospitalizations and overdose related to MMLs (Shi, 2017). Using national Veterans Health Administration medical records, the prevalence of CUD increased over 50% between 2002 and 2009 (Bonn-Miller et al., 2012). Data from a multi-state traffic fatality registry show that the presence of cannabis metabolites in the blood of fatal accident drivers almost tripled between 1999 and 2010 (Brady and Li, 2014). Finally, the prevalence of cannabis in the blood or tissues of fatally injured pilots also increased between 1990 and 2012, primarily in the last 10 years of this period (McKay and Groff, 2016).
Table 3.
Additional sources of information on time trends in cannabis-related outcomes.
| Authors | Outcome | Data source | Time period |
Sample size | Age range |
Results |
|---|---|---|---|---|---|---|
| Zhu and Wu (2016) | Cannabis-related emergency department (ED) visits |
United States Drug Abuse Warning Network |
2004–2011 | 2,823,321 ED visits |
≥ 12 years old |
1ncrease in rate ofcannabis-only-related ED visits, especially among adolescents. |
| 1ncrease in rate ofcannabis-polydrug-related ED visits. | ||||||
| Gubatan et al. (2016) | 1CD-9 cannabis use disorder (abuse or dependence, emergency department (ED) visits) | Massachusetts General Hospital gastroenterology clinic patients | 1986–2013 | 190,303 | Mean age = 47 |
Prevalence of cannabis use disorders increased over time, which was associated with increases in ED visits. |
| Brady and Li (2014) | Traffic fatalities | Fatality Analysis Reporting System (California, Hawaii, 1llinois, New Hampshire, Rhode Island, and West Virginia) | 1999–2010 | 23,591 | Not reported |
Prevalence of cannabinol in the blood of fatally injured drivers increased over the study period. |
| McKay and Groff (2016) | Fatal airplane crashes | Federal Aviation Administration’s Civil Aerospace Medical 1nstitute toxicology database National Transportation Safety Board’s aviation accident database |
1990–2012 | 6677 pilots | Mean age = 50 |
The prevalence of marijuana in the blood or tissues of fatally injured pilots increased over the study period. |
| Bonn-Miller et al. (2012) | 1CD-9-CM cannabis use disorders |
Veterans Health Administration national database |
2002, 2008, and 2009 |
2002 (289,904) |
Mean age = 53–54 |
Prevalence of cannabis use disorders increased over the study period. Results suggested that this occurred more in states with medical marijuana laws (wheremedical use ofmarijuana was legal). |
| 2008 (403,117) |
||||||
| 2009 (448,669) |
||||||
| Charilaou et al. (2017) | 1CD-9-CM cannabis use disorders |
U.S. National 1npatient Sample discharge diagnoses |
2002–2011 | 7 million discharges per year |
≥18 years old |
Proportion of hospital discharge diagnoses involving cannabis abuse or dependence increased over the study period. |
| Shi (2017) | Rates of hospitalizations for 1CD-9-CM cannabis use disorders, and opioid use disorders or overdose | State Inpatient Databases, state-level annual administrative records from 27 states | 1997–2014 | 382 state-year observations |
Not reported |
Significant increases in CUD diagnosis over time. Medical marijuana legalization was associated with reductions in hospitalizations related to opioid use disorders and overdose. They had no effect on cannabis-related hospitalizations. |
3.3.2.2.6. Marijuana laws and adult cannabis use.
Compared to the literature on adolescents, fewer studies have been conducted on the relationship between medical marijuana laws and cannabis use and cannabis use disorder in adults. Similar to studies in adolescents, cross-sectional studies of adults find higher rates of cannabis use and disorder in states with MMLs compared to non-MML states (Cerdá et al., 2012). A rigorous study of adults that used individual-level NSDUH data from 2004 to 2012, DiD methods, and controlled for both individual and state-level factors (Wen et al., 2015), observed increases in cannabis use, frequent cannabis use and CUD in MML states following MML passage, relative to contemporaneous national trends in non-MML states (Wen et al., 2015). A similar study with NSDUH data replicated findings for post-MML increases in past-month cannabis use among adults 26 or older (Martins et al., 2016). While these NSDUH studies are important, they provide information only about states passing MMLs after 2002, precluding consideration of differences in effects between early-MML and late-MML states.
A study analyzing the NIAAA surveys (1991–1992 NLAES, 2001–2002 NESARC, and 2012–2013 NESARC-III) was able to examine MML effects from a period that pre-dated any MMLs (Hasin et al., 2017d). Overall, between 1991–1992 and 2012–2013, illicit cannabis use and cannabis use disorder increased significantly more in states that passed MML than in other states. Between 1991–1992 to 2001–2002, illicit cannabis use and cannabis use disorder increased in states passing MMLs relative to non-MML states, with the exception of California, a highuse state even before any MML was passed. More recently (2001–2002 to 2012–2013), cannabis use and disorders increased in late- MML states, and in California and Colorado, relative to non-MML states. One possible explanation of the lagged increases in California and Colorado is the rapid proliferation of cannabis dispensaries that occurred after a Department of Justice 2009 policy change (Ogden, 2009) that placed low priority on federal prosecution of cannabis offences among those fully complying with state medical marijuana laws (Davis et al., 2016; Freisthler and Gruenewald, 2014; Salomonsen-Sautel et al., 2014; Schuermeyer et al., 2014). Recent additional analyses of these data indicate a similar set of relationships between MML and driving under the influence of cannabis (Hasin et al., 2017a), and with cannabis withdrawal, and daily-near-daily use of cannabis (Hasin et al., 2017b).
An additional study by Chu (2014), used alternative data not based on survey self-reports to investigate the relationship of MMLs to changes in prevalence of cannabis-related indicators via DiD tests. The outcomes were arrests for cannabis possession and cannabis-specific treatment admissions, both associated with heavy cannabis use. Each of these indicators showed post-MML increases, suggesting an association of MMLs in the prevalence of heavy cannabis use (Chu, 2014). A study of hospital discharge records in 27 states found that MMLs were associated with significant reductions in hospitalizations for opioid use disorders and overdose, but no change in cannabis-related hospitalizations (Shi, 2017).
No study has yet addressed the relationship of RMLs and adult cannabis outcomes.
4. Discussion
The sociocultural and legal landscape regarding cannabis is changing, as illustrated by public opinion polls, the many states that have passed medical marijuana laws, and the growing majority of Americans who favor use of cannabis for medical purposes. Consistent with these trends, a growing majority of adults and adolescents now also see cannabis use as posing very little or no risk for harm. Despite these views, cannabis use, particularly regular and heavy use, poses a number of risks. These include potential harms to a developing fetus, alterations to neurodevelopment when used early in adolescence, risks for a withdrawal syndrome and for cannabis use disorder, accidents and fatalities, and impairment in many social domains, including education and employment.
Among adults, cannabis use has increased considerably over the last 15 years, as have adverse health consequences of use, including cannabis use disorders, fatal crashes, and emergency department visits. Available studies suggest that medical marijuana laws have played a role in these increases. However, the prevalence of cannabis use has not changed markedly among adolescents, except for a possible slight decrease among younger teens, and many studies suggest that MMLs are unrelated to increases in adolescent cannabis use. The current data are insufficient to determine the effect of recreational legalization in either adolescents or adults.
As more states consider legalizing medical or recreational use ofcan- nabis, determining the effects of such laws on usage patterns and related outcomes have become an important public health priority. However, determining the causal effect of MLs has been challenging for several reasons. MMLs are not ‘natural experiments’, since these laws are not randomly assigned, and states that pass MML may differ from non-MML states in many ways. Thus, statistical methods (e.g. DiD testing) must be used to infer causal effects of marijuana laws, which depend on meeting model assumptions (e.g., that the prevalence of cannabis use was not already increasing in MML states before they passed MML), and using correct modeling specifications. Second, states differ in how they pass MMLs, with some using ballot measures and others using bills in the state legislature, and in what provisions they include. Variation in specific laws include the number and type of medical conditions eligible for a physician’s recommendation, whether patient registration is required, whether home cultivation is permitted, whether dispensaries are permitted, and the amount of cannabis allowed for purchase and possession (Bestrashniy and Winters, 2015; Pacula et al., 2013; Pacula et al., 2015). These factors may have important implications about public perception of cannabis use, public knowledge of the laws, and in the size and scope of the legal marijuana markets in these states. Third, the effect of public policy on health behaviors may not be immediate, so datasets and analyses should provide for the ability to analyze lagged effects. Variations in recreational marijuana laws will require study as well.
Concerns about adolescents were raised soon after California passed the first state MML (United States Congress; House Committee on the Judiciary; Subcommittee on Crime, 1997). Experts feared that MMLs would “send the wrong message” to teenagers, causing them to increase cannabis use (Annas, 1997). However, the prevalence of adolescent cannabis use has been fairly stable for the last few years, e.g., about one- third of high school seniors. Therefore, concerns about the potential for medical marijuana laws to increase teen use of cannabis appear not to have materialized, as shown in many studies using national data and statistically sophisticated before- and after-MML designs.
Possible explanations for the lack of post-MML increases in adolescent cannabis use are that MML are not salient to the interests of adolescents, or that such laws create a mental association between unpleasant-sounding medical problems (e.g., pain, nausea) and cannabis, discouraging use among the youngest adolescents who have not yet formed their attitudes towards cannabis. In addition, many adolescents do not appear to be aware of their state laws regarding cannabis use (Mauro et al., 2016), so that passage of MMLs would not change their behavior. However, given the rapidly changing social and legal context, these trends should continue to be monitored, as they may change in the future. Additionally, if large-scale studies could be conducted using repeated measures within individuals before and after passage of MML, this could provide a different perspective on MML impact, as could studies examining additional variations in state MML or different aspects of MML implementation (Pacula et al., 2013; Pacula et al., 2015).
Among adults, cannabis use is generally increasing, and increased prevalence of cannabis use over time has also been observed among diverse sociodemographic groups. Understanding these secular trends in population subgroups is an important first step in determining the effect of changing perceptions and legalization status on incidence and prevalence of use.
The reasons that NSDUH and NESARC were consistent in showing increased cannabis use but inconsistent regarding cannabis use disorder (Compton et al., 2016; Hasin and Grant, 2016) are unknown. Some questions have been raised about the measure ofcannabis use disorders in the NSDUH, given its inconsistencies with other indicators of time trends in serious cannabis-related conditions. Increases in CUD and daily-near daily use found in NESARC are consistent with the several other studies showing increases in serious cannabis problems (Hasin and Grant, 2016), including cannabis involvement in fatal crashes, increasing prevalence of CUD in large patient databases, and increases in cannabis-related emergency department visits. The consistency of these trends with the increases in CUD shown by Hasin et al. (2016) suggest that the findings on increases in CUD as shown in the NIAAA surveys are valid (Hasin and Grant, 2016).
Many states have legalized cannabis use for medicinal purposes. While the federal Food and Drug Administration (FDA) is responsible for approving medications for U.S. markets based on rigorous safety and efficacy tests, this regulatory framework could not be applied to cannabis, due to its classification as a controlled substance. This restriction has posed challenges to the scientific study of compounds in smoked cannabis, precluding rigorous studies of how changes in potency of various components of cannabis may affect use, disorder, and related harms. Much remains to be learned in this area.
The three available studies comparing adult prevalence of cannabis use and cannabis use disorders before and after passage ofmedical marijuana laws (Hasin et al., 2017d; Martins et al., 2016; Wen et al., 2015) are consistent in suggesting a causal relationship between the passage of medical marijuana laws and subsequent increases in adult cannabis use and cannabis use disorders. Much more remains to be learned about the relationship of medical and recreational marijuana laws to adult health outcomes, including effects on additional cannabis-related outcomes, further studies ofvariations between the marijuana laws and whether these affect results, effects of marijuana laws on other substance outcomes, and on indicators of treatment for psychiatric disorders and pain.
5. Conclusions
Though U.S. federal law prohibits cannabis use, such use is not rare. The prevalence of cannabis use is increasing, as are many cannabis-related harms. At the same time, the public increasingly sees cannabis as a harmless drug. Given that, public and professional education that conveys information about the potential harms from the use ofcannabis appears needed. Such information should avoid the exaggerated scare tactics of earlier decades [e.g., Reefer Madness (Annas, 1997), Your- Brain-On-Drugs (White, 2016)]. Instead, the development of more effective ways to disseminate balanced information on cannabis is needed. At the same time, while changing marijuana laws do not appear to be leading to increases in adolescent cannabis use, the picture is different among adults. The increases in adult cannabis use and potential consequences associated with MML shown to date indicate the importance of further studies to replicate and better understand existing results, and to continue monitoring these trends. In addition, no information is yet available on the relationship of recreational marijuana laws to changes in the prevalence of adult cannabis use and consequences. Recreational laws may further increase cannabis use and cannabis-related problems in health and functioning because they are likely to reduce price (Caulkins et al., 2012; Hall and Lynskey, 2016), may place profit motives over public health issues (Pacula et al., 2014; Room, 2014), and in any case, will offer opportunities for legal use to a broader population by eliminating the need for a medical approval for purchase. The passage of recreational marijuana laws offers an important social justice benefit (Jensen and Roussell, 2016; Kilmer, 2017; McGinty et al., 2017) by removing some mechanisms for unfair and damaging racial disparities in enforcement (Golub et al., 2007). Recreational marijuana laws can also save public money spent on law enforcement and the judicial system (Aldrich and Mikuriya, 1988), and increase revenues to state and local governments through taxation. However, a public health trade-off may occur if more widespread cannabis use occurs, since some of it is likely to be accompanied by the health and psychosocial harms that occur among some users (Hall, 2017; Lynskey and Hall, 2016; Pacula, 2010; Volkow et al., 2014). Designing and implementing public policies that protect public health, and educating the public about potential consequences will be important in minimizing harms from these changing laws.
Supplementary Material
Acknowledgments
This work was supported by NIDA grants R01DA034244 (Dr. Hasin), T32DA031099 (Drs. Carliner and Brown, PI Hasin) and the New York State Psychiatric Institute (Dr. Hasin).
Appendix A. Supplementary data
Supplementary data to this article can be found online at http://dx.doi.org/10.1016/j.ypmed.2017.07.008.
Footnotes
Conflict of interest disclosures
Dr. Hasin is Principal Investigator of a validity study of a measure of addiction to prescription opioids funded by InVentive Health Consulting, which combines support from nine pharmaceutical companies. All other authors have no conflicts of interest.
References
- Aldrich MR, Mikuriya T, 1988. Savings in California marijuana law enforcement costs attributable to the Moscone Act of 1976-a summary. J. Psychoactive Drugs 20,75–81. [DOI] [PubMed] [Google Scholar]
- American College of Obstetricians and Gynecologists Committee on Obstetric Practice, 2015. Committee opinion no. 637: marijuana use during pregnancy and lactation. Obstet. Gynecol. 126, 234–238. [DOI] [PubMed] [Google Scholar]
- American Psychiatric Association, 2013. Diagnostic and Statistical Manual of Mental Disorders. 5th ed American Psychiatric Publishing, Arlington, VA. [Google Scholar]
- Angrist JD, Pischke J-S, 2008. Mostly Harmless Econometrics: An Empiricist’s Companion. Princeton University Press. [Google Scholar]
- Annas GJ, 1997. Reefer madness-the federal response to California’s medical-marijuana law. N. Engl. J. Med. 337, 435–439. [DOI] [PubMed] [Google Scholar]
- Azofeifa A, Mattson ME, Schauer G, McAfee T, Grant A, Lyerla R, 2016. National estimates of marijuana use and related indicators - National Survey on Drug Use and Health, United States, 2002–2014. Morbidity And Mortality Weekly Report. Surveillance Summaries (Washington, D.C.: 2002) 65, pp. 1–28. [DOI] [PubMed] [Google Scholar]
- Bellum S, 2011. Blast from the past: “Just Say No”. In: Teens Nlo.DAf. (Ed.), Drugs & Health Blog. [Google Scholar]
- Bestrashniy J, Winters KC, 2015. Variability in medical marijuana laws in the United States. Psychol. Addict. Behav. 29, 639–642. [DOI] [PMC free article] [PubMed] [Google Scholar]
- Bonn-Miller MO, Harris AH, Trafton JA, 2012. Prevalence of cannabis use disorder diagnoses among veterans in 2002, 2008, and 2009. Psychol. Serv. 9,404–416. [DOI] [PubMed] [Google Scholar]
- Brady JE, Li G, 2014. Trends in alcohol and other drugs detected in fatally injured drivers in the United States, 1999–2010. Am. J. Epidemiol. 179, 692–699. [DOI] [PMC free article] [PubMed] [Google Scholar]
- Brown QL, Sarvet AL, Shmulewitz D, Martins SS, Wall MM, Hasin DS, 2017. Trends in marijuana use among pregnant and nonpregnant reproductive-aged women, 2002–2014. JAMA 317, 207–209. [DOI] [PMC free article] [PubMed] [Google Scholar]
- Brownell GS, 1988. Marijuana and the law in California: a historical and political over-view. J. Psychoactive Drugs 20, 71–74. [DOI] [PubMed] [Google Scholar]
- Budney AJ, Hughes JR, Moore BA, Vandrey R, 2004. Review of the validity and significance of cannabis withdrawal syndrome. Am. J. Psychiatr. 161,1967–1977. [DOI] [PubMed] [Google Scholar]
- Calvigioni D, Hurd YL, Harkany T, Keimpema E, 2014. Neuronal substrates and functional consequences of prenatal cannabis exposure. Eur. Child Adolesc. Psychiatry 23, 931–941. [DOI] [PMC free article] [PubMed] [Google Scholar]
- Carliner H, Mauro PM, Brown QL, Shmulewitz D, Rahim-Juwel R, Sarvet AL, Wall MM, Martins SS, Carliner G, et al. , 2017. The widening gender gap in marijuana use prevalence in the U.S. during a period of economic change, 2002–2014. Drug Alcohol Depend. 170, 51–58. [DOI] [PMC free article] [PubMed] [Google Scholar]
- Caulkins JP, Kilmer B, MacCoun RJ, Pacula RL, Reuter P, 2012. Design considerations for legalizing cannabis: lessons inspired by analysis of California’s Proposition 19. Addiction 107, 865–871. [DOI] [PubMed] [Google Scholar]
- Center for Behavioral Health Statistics and Quality, 2016. Key Substance Use and Mental Health Indicators in the United States: Results From the 2015 National Survey on Drug Use and Health (HHS Publication No. SMA 16–4984, NSDUH Series H-51). [Google Scholar]
- Cerda M, Wall M, Keyes KM, Galea S, Hasin D, 2012. Medical marijuana laws in 50 states: investigating the relationship between state legalization of medical marijuana and marijuana use, abuse and dependence. Drug Alcohol Depend. 120, 22–27. [DOI] [PMC free article] [PubMed] [Google Scholar]
- Cerdá M, Moffitt TE, Meier MH, Harrington H, Houts R, Ramrakha S, Hogan S, Poulton R, Caspi A, 2016. Persistent cannabis dependence and alcohol dependence represent risks for midlife economic and social problems: a longitudinal cohort study. Clinical Psychological Science 4,1028–1046. [DOI] [PMC free article] [PubMed] [Google Scholar]
- Cerdá M, Wall M, Feng T, Keyes KM, Sarvet A, Schulenberg J, O’Malley PM, Pacula RL, Galea S, et al. , 2017. State recreational marijuana laws and adolescent marijuana use. JAMA Pediatr. 171 (2):142–149. 10.1001/jamapediatrics.2016.3624. [DOI] [PMC free article] [PubMed] [Google Scholar]
- Charilaou P, Agnihotri K, Garcia P, Badheka A, Frenia D, Yegneswaran B, 2017. Trends of cannabis use disorder in the inpatient: 2002 to 2011. Am. J. Med. 130 (678–87), e7. [DOI] [PubMed] [Google Scholar]
- Chu Y-WL, 2014. The effects of medical marijuana laws on illegal marijuana use. J. Health Econ. 38, 43–61. [DOI] [PubMed] [Google Scholar]
- Compton WM, Grant BF, Colliver JD, Glantz MD, Stinson FS, 2004. Prevalence of marijuana use disorders in the United States: 1991–1992 and 2001–2002. JAMA 291, 2114–2121. [DOI] [PubMed] [Google Scholar]
- Compton WM, Gfroerer J, Conway KP, Finger MS, 2014. Unemployment and substance outcomes in the United States 2002–2010. Drug Alcohol Depend. 142, 350–353. [DOI] [PMC free article] [PubMed] [Google Scholar]
- Compton WM, Han B, Jones CM, Blanco C, Hughes A, 2016. Marijuana use and use disorders in adults in the USA, 2002–14: analysis of annual cross-sectional surveys. Lancet Psychiatry 3, 954–964. [DOI] [PubMed] [Google Scholar]
- Danielsson AK, Falkstedt D, Hemmingsson T, Allebeck P, Agardh E, 2015. Cannabis use among Swedish men in adolescence and the risk ofadverse life course outcomes: results from a 20 year-follow-up study. Addiction 110,1794–1802. [DOI] [PMC free article] [PubMed] [Google Scholar]
- Davis JM, Mendelson B, Berkes JJ, Suleta K, Corsi KF, Booth RE, 2016. Public health effects of medical marijuana legalization in Colorado. Am. J. Prev. Med. 50, 373–379. [DOI] [PMC free article] [PubMed] [Google Scholar]
- Desrosiers NA, Ramaekers JG, Chauchard E, Gorelick DA, Huestis MA, 2015. Smoked cannabis’ psychomotor and neurocognitive effects in occasional and frequent smokers. J. Anal. Toxicol. 39, 251–261. [DOI] [PMC free article] [PubMed] [Google Scholar]
- Eddy M, 2010. Medical Marijuana: Review and Analysis of Federal and State Policies. Report to United States Congress. [Google Scholar]
- Fergusson DM, Boden JM, 2008. Cannabis use and later life outcomes. Addiction 103, 969–976. [DOI] [PubMed] [Google Scholar]
- Fergusson DM, Boden JM, Horwood LJ, 2015. Psychosocial sequelae of cannabis use and implications for policy: findings from the Christchurch Health and Development Study. Soc. Psychiatry Psychiatr. Epidemiol. 50,1317–1326. [DOI] [PubMed] [Google Scholar]
- Freisthler B, Gruenewald PJ, 2014. Examining the relationship between the physical availability of medical marijuana and marijuana use across fifty California cities. Drug Alcohol Depend. 244–250. [DOI] [PMC free article] [PubMed] [Google Scholar]
- Gallup, 2016. Support for Legal Marijuana Use Up to 60% in U.S. [Google Scholar]
- Golub A, Johnson BD, Dunlap E, 2007. The race/ethnicity disparity in misdemeanor marijuana arrests in New York City. Criminology & Public Policy 6,131–164. [DOI] [PMC free article] [PubMed] [Google Scholar]
- Grant BF, Goldstein RB, Smith SM, Jung J, Zhang H, Chou SP, Pickering RP, Ruan WJ, Huang B, et al. , 2015. The Alcohol Use Disorder and Associated Disabilities Interview Schedule-5 (AUDADIS-5): reliability of substance use and psychiatric disorder modules in a general population sample. Drug Alcohol Depend. 148, 27–33. [DOI] [PMC free article] [PubMed] [Google Scholar]
- Gubatan J, Staller K, Barshop K, Kuo B, 2016. Cannabis abuse is increasing and associated with increased emergency department utilization in gastroenterology patients. Dig. Dis. Sci. 61,1844–1852. [DOI] [PubMed] [Google Scholar]
- Hall W, 2017. Alcohol and cannabis: comparing their adverse health effects and regulatory regimes. Int J Drug Policy 42, 57–62. [DOI] [PubMed] [Google Scholar]
- Hall W, Lynskey M, 2016. Why it is probably too soon to assess the public health effects of legalisation of recreational cannabis use in the USA. Lancet Psychiatry 3, 900–906. [DOI] [PubMed] [Google Scholar]
- Haney M, Hart CL, Vosburg SK, Comer SD, Reed SC, Foltin RW, 2008. Effects ofTHC and lofexidine in a human laboratory model of marijuana withdrawal and relapse. Psychopharmacology 197,157–168. [DOI] [PMC free article] [PubMed] [Google Scholar]
- Hasin DS, Grant BF, 2016. NESARC findings on increased prevalence of marijuana use disorders—consistent with other sources of information. JAMA psychiatry 73 (532–32). [DOI] [PMC free article] [PubMed] [Google Scholar]
- Hasin DS, Keyes KM, Alderson D, Wang S, Aharonovich E, Grant BF, 2008. Cannabis withdrawal in the United States: results from NESARC. J. Clin. Psychiatry 69, 1354–1363. [DOI] [PMC free article] [PubMed] [Google Scholar]
- Hasin DS, O’Brien CP, Auriacombe M, Borges G, Bucholz K, Budney A, Compton WM, Crowley T, Ling W, et al. , 2013. DSM-5 criteria for substance use disorders: recommendations and rationale. Am. J. Psychiatr. 170, 834–851. [DOI] [PMC free article] [PubMed] [Google Scholar]
- Hasin DS, Greenstein E, Aivadyan C, Stohl M, Aharonovich E, Saha T, Goldstein R, Nunes EV, Jung J, et al. , 2015a. The Alcohol Use Disorder and Associated Disabilities Interview Schedule-5 (AUDADIS-5): procedural validity of substance use disorders modules through clinical re-appraisal in a general population sample. Drug Alcohol Depend. 148, 40–46. [DOI] [PMC free article] [PubMed] [Google Scholar]
- Hasin DS, Saha TD, Kerridge BT, Goldstein RB, Chou SP, Zhang H, Jung J, Pickering RP, Ruan WJ, et al. , 2015b. Prevalence of marijuana use disorders in the United States between 2001–2002 and 2012–2013. JAMA Psychiatry 72, 1235–1242. [DOI] [PMC free article] [PubMed] [Google Scholar]
- Hasin DS, Wall M, Keyes KM, Cerda M, Schulenberg J, O’Malley PM, Galea S, Pacula R, Feng T, 2015c. Medical marijuana laws and adolescent marijuana use in the USA from 1991 to 2014: results from annual, repeated cross-sectional surveys. Lancet Psychiatry 2,601–608. [DOI] [PMC free article] [PubMed] [Google Scholar]
- Hasin DS, Kerridge BT, Saha TD, Huang B, Pickering R, Smith SM, Jung J, Zhang H, Grant BF, 2016. Prevalence and correlates of DSM-5 cannabis use disorder, 2012–2013: findings from the National Epidemiologic Survey on Alcohol and Related Con- ditions-III. Am. J. Psychiatr. 173, 588–599. [DOI] [PMC free article] [PubMed] [Google Scholar]
- Hasin DS, Kerridge B, Sarvet AL, Wall MM, 2017c. Greater Increases in Cannabis Use and Cannabis Use Disorder Among U.S. Men, Young Adults and Those in Low-income Households (In preparation). [Google Scholar]
- Hasin DS, Sarvet AL, Cerda M, Keyes KM, Galea S, Wall MM, 2017a. Driving under the influence of cannabis or alcohol: relationship to medical marijuana laws, 1991–1992 to 2012–2013. Annual Meeting of the Reseearch Society on Alcoholism Denver, Colorado. [Google Scholar]
- Hasin DS, Sarvet AL, Cerda M, Keyes KM, Galea S, Wall MM, 2017b. U.S. illicit cannabis use, cannabis use disorders, and medical marijuana laws, 1991–1992 to 2012–2013. Annual Meeting of the College on Problems of Drug Dependence Montreal, Canada. [Google Scholar]
- Hasin DS, Sarvet AL, Cerda M, Keyes KM, Stohl M, Galea S, Wall MM, 2017d. U.S. Adult Illicit Cannabis Use, Cannabis Use Disorder, and Medical Marijuana Laws: 1991–1992 to 2012–2013. JAMA Psychiatry 74 (6):579–588. 10.1001/jamapsychiatry.2017.0724. [DOI] [PMC free article] [PubMed] [Google Scholar]
- Henkel D, 2011. Unemployment and substance use: a review of the literature (1990–2010). Current Drug Abuse Reviews 4, 4–27. [DOI] [PubMed] [Google Scholar]
- Hunt PE, Miles J, 2015. The impact of legalizing and regulating weed: issues with study design and emerging findings in the USA. Springer Berlin Heidelberg, Berlin, Heidelberg, pp. 1–26. [DOI] [PubMed] [Google Scholar]
- Imbens GW, Wooldridge JM, 2009. Recent developments in the econometrics of program evaluation. J. Econ. Lit. 47, 5–86. [Google Scholar]
- Jensen EL, Roussell A, 2016. Field observations of the developing legal recreational cannabis economy in Washington State. Int J Drug Policy 33, 96–101. [DOI] [PubMed] [Google Scholar]
- Johnson J, Hodgkin D, Harris SK, 2017. The design of medical marijuana laws and adolescent use and heavy use of marijuana: analysis of 45 states from 1991 to 2011. Drug Alcohol Depend. 170,1–8. [DOI] [PMC free article] [PubMed] [Google Scholar]
- Kerr WC, Greenfield TK, Bond J, Ye Y, Rehm J, 2007. Age-period-cohort influences on trends in past year marijuana use in the US from the 1984, 1990, 1995 and 2000 National Alcohol Surveys. Drug Alcohol Depend. 86, 132–138. [DOI] [PubMed] [Google Scholar]
- Keyes KM, Grant BF, Hasin DS, 2008. Evidence for a closing gender gap in alcohol use, abuse, and dependence in the United States population. Drug Alcohol Depend. 93, 21–29. [DOI] [PMC free article] [PubMed] [Google Scholar]
- Keyes KM, Li G, Hasin DS, 2011. Birth cohort effects and gender differences in alcohol epidemiology: a review and synthesis. Alcohol. Clin. Exp. Res. 35, 2101–2112. [DOI] [PMC free article] [PubMed] [Google Scholar]
- Keyes KM, Wall M, Cerda M, Schulenberg J, O’Malley PM, Galea S, Feng T, Hasin DS, 2016. How Does State Marijuana Policy Affect U.S. Youth? Medical Marijuana Laws, Marijuana Use and Perceived Harmfulness: 1991–2014. Addiction. Abingdon, England. [DOI] [PMC free article] [PubMed] [Google Scholar]
- Kilmer B, 2017. Recreational cannabis - minimizing the health risks from legalization. N. Engl. J. Med. 376, 705–707. [DOI] [PubMed] [Google Scholar]
- King RS, Mauer M, 2006. The war on marijuana: the transformation of the war on drugs in the 1990s. Harm Reduction Journal 3. [DOI] [PMC free article] [PubMed] [Google Scholar]
- Ko JY, Farr SL, Tong VT, Creanga AA, Callaghan WM, 2015. Prevalence and patterns ofmarijuana use among pregnant and nonpregnant women ofreproductive age. Am. J.Obstet. Gynecol. 213 (201) (e1–01 e10). [DOI] [PMC free article] [PubMed] [Google Scholar]
- Lanza ST, Vasilenko SA, Dziak JJ, Butera NM, 2015. Trends among U.S. high school seniors in recent marijuana use and associations with other substances: 1976–2013. J. Adolesc. Health 57,198–204. [DOI] [PMC free article] [PubMed] [Google Scholar]
- Liu C, Huang Y, Pressley JC, 2016. Restraint use and risky driving behaviors across drug types and drug and alcohol combinations for drivers involved in a fatal motor vehicle collision on U.S. roadways. Injury Epidemiology 3 (9). [DOI] [PMC free article] [PubMed] [Google Scholar]
- Lubman DI, Cheetham A, Yucel M, 2015. Cannabis and adolescent brain development. Pharmacol. Ther. 148,1–16. [DOI] [PubMed] [Google Scholar]
- Lynskey M, Hall W, 2016. Cannabis use and cannabis use disorders. Lancet Psychiatry 3, 911–912. [DOI] [PubMed] [Google Scholar]
- MacCoun R, Pacula RL, Chriqui J, Harris K, Reuter P, 2009. Do citizens know whether their state has decriminalized marijuana? Assessing the perceptual component of deterrence theory. Review of Law and Economics 5,347–371. [Google Scholar]
- Martins SS, Mauro CM, Santaella-Tenorio J, Kim JH, Cerda M, Keyes KM, Hasin DS, Galea S, Wall M, 2016. State-level medical marijuana laws, marijuana use and perceived availability ofmarijuana among the general U.S. population. Drug Alcohol Depend. 169, 26–32. [DOI] [PMC free article] [PubMed] [Google Scholar]
- Mauro PM, Santaella-Tenorio J, Mauro CM, Kim JH, Martins SS, 2016. Do people know if their state legally approved medical marijuana? Trends across the United States, 2004–2013. 2016 Annual Meeting of the Society for Epidemiologic Research Miami, FL. [Google Scholar]
- Mauro P, Shmulewitz D, Hasin D, Sarvet AL, Rahim-Juwel R, Brown Q, et al. , 2017. Age differences in adult past-year marijuana use and risk perceptions in the US, 2002–2013. Drug Alcohol Depend. 171, e134. [Google Scholar]
- McGinty EE, Niederdeppe J, Heley K, Barry CL, 2017. Public perceptions of arguments supporting and opposing recreational marijuana legalization. Prev. Med. 99, 80–86. [DOI] [PubMed] [Google Scholar]
- McKay MP, Groff L, 2016. 23 years of toxicology testing fatally injured pilots: implications for aviation and other modes of transportation. Accid. Anal. Prev. 90,108–117. [DOI] [PubMed] [Google Scholar]
- McKenna GJ, 2014. The current status of medical marijuana in the United States. Hawai’i journal of medicine & public health: a journal of Asia Pacific Medicine & Public Health 73,105–108. [PMC free article] [PubMed] [Google Scholar]
- Meier MH, Caspi A, Ambler A, Harrington H, Houts R, Keefe RS, McDonald K, Ward A, Poulton R, et al. , 2012. Persistent cannabis users show neuropsychological decline from childhood to midlife. Proc. Natl. Acad. Sci. U. S. A. 109, E2657–E2664. [DOI] [PMC free article] [PubMed] [Google Scholar]
- Musto DF, 1991. Opium, cocaine and marijuana in American history. Sci. Am. 265, 40–47. [DOI] [PubMed] [Google Scholar]
- Ogden DW, 2009. Memorandum for Selected United State Attorneys on Investigations and Prosecutions in States Authorizing the Medical Use of Marijuana. U.S. Department of Justice. [Google Scholar]
- Pacek LR, Mauro PM, Martins SS, 2015. Perceived risk of regular cannabis use in the United States from 2002 to 2012: differences by sex, age, and race/ethnicity. Drug Alcohol Depend. 149, 232–244. [DOI] [PMC free article] [PubMed] [Google Scholar]
- Pacula RL, 2010. Examining the Impact of Marijuana Legalization on Marijuana Consumption: Insights from the Economics Literature. RAND Corporation, Santa Monica, CA. [Google Scholar]
- Pacula RL, Chriqui JF, Reichmann DA, Terry-McElrath YM, 2002. State medical marijuana laws: understanding the laws and their limitations. J. Public Health Policy 23, 413–439. [PubMed] [Google Scholar]
- Pacula RL, Powell D, Heaton P, Sevigny EL, 2013. Assessing the Effects of Medical Marijuana Laws on Marijuana and Alcohol Use: The Devil is in the Details. National Bureau of Economic Research. [DOI] [PMC free article] [PubMed] [Google Scholar]
- Pacula RL, Kilmer B, Wagenaar AC, Chaloupka FJ, Caulkins JP, 2014. Developing public health regulations for marijuana: lessons from alcohol and tobacco. Am. J. Public Health 104,1021–1028. [DOI] [PMC free article] [PubMed] [Google Scholar]
- Pacula RL, Powell D, Heaton P, Sevigny EL, 2015. Assessing the effects of medical marijuana laws on marijuana use: the devil is in the details. Journal ofPolicy Analysis and Management 34, 7–31. [DOI] [PMC free article] [PubMed] [Google Scholar]
- ProCon.org, 2016. 28 Legal Medical Marijuana States and DC. [Google Scholar]
- Room R, 2014. Legalizing a market for cannabis for pleasure: Colorado, Washington, Uruguay and beyond. Addiction 109, 345–351. [DOI] [PubMed] [Google Scholar]
- Salomonsen-Sautel S, Min SJ, Sakai JT, Thurstone C, Hopfer C, 2014. Trends in fatal motor vehicle crashes before and after marijuana commercialization in Colorado. Drug Alcohol Depend. 140, 137–144. [DOI] [PMC free article] [PubMed] [Google Scholar]
- Sarvet AL, Wall MM, Keyes KM, Cerda M, Schulenberg J, O’Malley PM, Hasin DS, 2017. Rapid recent increases in perceptions that marijuana is not harmful: unaccompanied by increases in adolescent marijuana use. Annual Meeting of the Society for Epidemiologic Research Seattle, Washington. [Google Scholar]
- Schlosser E, 1994. Reefer Madness. The Atlantic. [Google Scholar]
- Schuermeyer J, Salomonsen-Sautel S, Price RK, Balan S, Thurstone C, Min SJ, Sakai JT, 2014. Temporal trends in marijuana attitudes, availability and use in Colorado compared to non-medical marijuana states: 2003–11. Drug Alcohol Depend. 140, 145–155. [DOI] [PMC free article] [PubMed] [Google Scholar]
- Shi Y, 2017. Medical marijuana policies and hospitalizations related to marijuana and opioid pain reliever. Drug Alcohol Depend. 173,144–150. [DOI] [PMC free article] [PubMed] [Google Scholar]
- Shmulewitz D, Brown QL, Rahim-Juwel R, Martins SS, Wall MM, Mauro PM, Carliner H, Sarvet AL, Hasin DS, 2016. US trends in past-year marijuana use and perceived risk of regular use, 2002–2014, by race/ethnicity. Annual Meeting of the College on Problems of Drug Dependence Palm Springs, CA. [Google Scholar]
- Stinson FS, Ruan WJ, Pickering R, Grant BF, 2006. Cannabis use disorders in the USA: prevalence, correlates and co-morbidity. Psychol. Med. 36, 1447–1460. [DOI] [PubMed] [Google Scholar]
- Stolzenberg L, D’Alessio SJ, Dariano D, 2016. The effect of medical cannabis laws on juvenile cannabis use. Int J Drug Policy 27, 82–88. [DOI] [PubMed] [Google Scholar]
- Substance Abuse and Mental Health Services Administration, 2014. Results From the 2013 National Survey on Drug Use and Health: Summary of National Findings, NSDUH Series H-48. Substance Abuse and Mental Health Services Administration, Rockville, MD. [Google Scholar]
- Survey Research Center, 2016. Monitoring the Future. Institute for Social Research, University of Michigan, Ann Arbor, MI. [Google Scholar]
- United States Congress, House Committee on the Judiciary, Subcommittee on Crime, 1997. Medical Marijuana Referenda Movement in America: Hearing Before the Subcommittee on Crime of the Committee on the Judiciary, House of Representatives, One Hundred Fifth Congress, First Session, October 1, 1997 U.S. Government Printing Office. [Google Scholar]
- Volkow ND, Baler RD, Compton WM, Weiss SR, 2014. Adverse health effects of marijuana use. N. Engl. J. Med. 370, 2219–2227. [DOI] [PMC free article] [PubMed] [Google Scholar]
- Volkow ND, Compton WM, Wargo EM, 2016. The Risks of Marijuana Use During Pregnancy (JAMA). [DOI] [PubMed] [Google Scholar]
- Wall MM, Poh E, Cerda M, Keyes KM, Galea S, Hasin DS, 2011. Adolescent marijuana use from 2002 to 2008: higher in states with medical marijuana laws, cause still unclear. Ann. Epidemiol. 21, 714–716. [DOI] [PMC free article] [PubMed] [Google Scholar]
- Wall MM, Mauro C, Hasin DS, Keyes KM, Cerda M, Martins SS, Feng T, 2016. Prevalence of marijuana use does not differentially increase among youth after states pass medical marijuana laws: commentary on and reanalysis of US National Survey on Drug Use in Households data 2002–2011. Int J Drug Policy 29, 9–13. [DOI] [PMC free article] [PubMed] [Google Scholar]
- Wen H, Hockenberry JM, Cummings JR, 2015. The effect of medical marijuana laws on adolescent and adult use of marijuana, alcohol, and other substances. J. Health Econ. 42, 64–80. [DOI] [PubMed] [Google Scholar]
- White MC, 2016. ‘This is your brain on drugs’, Tweaked for Today’s Parents. New York Times. [Google Scholar]
- Zhu H, Wu LT, 2016. Trends and correlates of cannabis-involved emergency department visits: 2004 to 2011. J. Addict. Med. 10, 429–436. [DOI] [PMC free article] [PubMed] [Google Scholar]
Associated Data
This section collects any data citations, data availability statements, or supplementary materials included in this article.