Abstract
Mouse double minute 2 (Mdm2) is a multifaceted oncoprotein that is highly regulated with distinct domains capable of cellular transformation. Loss of Mdm2 is embryonically lethal, making it difficult to study in a mouse model without additional genetic alterations. Global overexpression through increased Mdm2 gene copy number (Mdm2Tg) results in the development of hematopoietic neoplasms and sarcomas in adult animals. In these mice, we found an increase in osteoblastogenesis, differentiation, and a high bone mass (HBM) phenotype. Since it was difficult to discern the cell lineage that generated this phenotype, we generated osteoblast-specific Mdm2 overexpressing (Mdm2TgOb) mice in two different strains, C57BL/6 and DBA. These mice did not develop malignancies; however, these animals and the MG63 human osteosarcoma cell line with high levels of Mdm2 showed an increase in bone mineralization. Importantly, overexpression of Mdm2 corrected aged-related bone loss in mice, providing a role for the proto-oncogenic activity of Mdm2 in bone health of adult animals.
Keywords: Mdm2, Osteoblast, Bone mass
Introduction
Bone is a complex and dynamic organ, simultaneously regulating hematopoiesis while continuously adapting to physiological conditions for optimal strength, support, and movement. The bone remodeling process encompassing bone resorption and apposition reveals an intricate equilibrium regulated by osteoblasts (OBs) and osteoclasts (OCs). Imbalances of remodeling can perturb bone microstructures and initiate pathologies such as bone loss, periodontal disease, arthritis, and malignancy.
The glycoprotein osteonectin is an important marker of OB differentiation, inducing mineralization in normal skeletal tissue [Doi et al., 1989; Romberg et al., 1985; Romberg et al., 1986; Termine et al., 1981a; Termine et al., 1981b]; [Jundt et al., 1987; Termine et al., 1981b]. Consequently, osteonectin-null mice exhibit reduced OB and OC numbers with approximately 50% decrease in bone formation rate [Delany et al., 2000; Doi et al., 1989]. The osteonectin gene is regulated by numerous transcription factors including Sp1 in OBs [Chamboredon et al., 2003]. Sp1 is a zinc finger transcription factor that binds to GC rich motifs and cooperates with other transcription factors to induce gene expression [Mann et al., 2001]. Converse to SP1, the transcription factor and tumor suppressor p53 is an important regulator of OBs and OCs. Loss of p53 (−/−) in OB precursors results in OB proliferation and OC differentiation, elevated levels of RUNX2, and generation of a high bone mass (HBM) phenotype [Liu and Li, 2010];[Wang et al., 2006] . These mice also develop of osteosarcoma as they age [Walkley et al., 2008]. Furthermore, osteosarcoma cells with p53 deletion also exhibit high levels of RUNX2 and enhanced osteogenesis compared to those with wild type p53 [He et al., 2015].
Mdm2, a negative regulator of p53, has also been implicated in the development of osteosarcoma with gene amplification found in a third of high-grade dedifferentiated osteosarcomas and the late stages of metastasis [Chen et al., 2012];[Guerin et al., 2016];[Yoshida et al., 2012];[Salinas-Souza et al., 2013]. While the oncogenic function of Mdm2 is correlated with neoplastic development, little is known about the proto-oncogene role in maturing animals [Haines, 1997; Zhao et al., 2014]. Examination of Mdm2 expression patterns during embryogenesis shows ubiquitous expression during 7.5–11.5 days post coitum (dpc), and in the teeth at 14–18 dpc independent of p53 expression [Leveillard et al., 1998]. Deletion of Mdm2 in mice (Mdm2−/−) is embryonically lethal due to p53-induced cell growth arrest or apoptosis, whereas Mdm2 −/−; p53−/− mice remain viable [Jones et al., 1995; Montes de Oca Luna et al., 1995]; [Maluszek, 2015; Manfredi, 2010]. Deletion of Mdm2 only in OB progenitor cells results in numerous skeletal defects and reduced mineralization leading to neonatal death [Lengner et al., 2006], suggesting that Mdm2 has both p53-dependent and independent roles.
The influence of Mdm2 upregulation in the rich cellular milieu remains largely unknown due to the inherent difficulties in investigating the function of Mdm2 in adult animals as p53−/−; Mdm2−/− animals develop hematopoietic malignancies and sarcomas early [Abbas et al., 2010; Chen et al., 2012; Das et al., 2012; Lengner et al., 2006];[Jones et al., 1998; Pant et al., 2012]. Here we demonstrate that Mdm2 overexpression specific to osteoblast lineage cells leads to a high bone mass phenotype and corrects age-related bone loss in female mice.
Materials and Methods
Global overexpressing Mdm2 (Mdm2Tg) C57BL/6 mice.
For these studies 3-month-old male WT and globally overexpressing Mdm2Tg C57BL/6 mice were a generous gift from Stephen Jones [Jones et al., 1998]. Overexpression of Mdm2 was analyzed by western blot analysis.
Mdm2ObTg C57BL/6 and DBA mice.
For these studies, female and male WT and Mdm2ObTg (on a C57BL/6 or DBA background) were utilized. DBA mice were obtained in-house. There were no significant differences between male and female mice. C57BL/6 mice were obtained from Jackson Laboratories. All procedures were approved by the Institutional Animal Care and Use Committee (IACUC) of the Indiana University School of Medicine, and complied with NIH guidelines, and the Guide for the Care and Use of Laboratory Animals. To generate Mdm2ObTg mice, the osteoblast and osteocyte specific promoter, collagen 1.7 (Col1.7) was ligated upstream of the Mdm2 cDNA and injected into embryos. Overexpression of Mdm2 was monitored by western blot analysis.
BMD and μCT analysis of bone.
Whole body and femoral BMD (g/cm2) was measured in vivo by peripheral DEXA (PIXImus, GE Lunar Madison, WI). Trabecular bone parameters of the distal femur designated for histology were quantified by μCT (Skycan 1172) as previously described [Feher et al., 2010; Warden et al., 2008]; [Meijome et al., 2015; Weatherholt et al., 2013]. Images were binarized to calculate three-dimensional BV parameters: trabecular bone volume fraction (BV/TV, %), trabecular number (Tb.N, 1/mm), trabecular thickness (Tb.Th, mm), and trabecular separation (Tb.Sp, mm).
Histology/histomorphometry.
WT and Mdm2ObTg mice were administered 30mg/kg fluorochrome calcein (IP) 13 and 3 days prior to sacrifice to label actively forming bone surfaces. Static and dynamic histomorphometric analysis of trabecular bone was performed on femurs as previously described [Feher et al., 2010; Meijome et al., 2015; Warden et al., 2008]. Histological measurements were made with a semiautomatic analysis system (Bioquant OSTEO 7.20.10, Bioquant Image Analysis Co.) attached to a microscope with an ultraviolet light source (Nikon Optiphot 2 microscope, Nikon). Measurements were done on one stained (static) and one unstained (dynamic) section for each animal.
Preparation of neonatal calvarial cells (OB).
Neonatal murine calvarial OB cells were prepared as previously described from WT and Mdm2ObTg C57BL/6 and DBA mice [Horowitz et al., 1994]. Our technique is a modified version of the basic method described by Wong and Cohn [Wong and Cohn, 1975]. Dissected calvaria from neonatal mice were treated with EDTA in PBS for 30 min and digested with collagenase (200U/mL) at 37°C. Fractions 3–5 (20–35, 35–50, and 50–65 min) were used as the OB starting population and seeded at 2 ×10⁴ cells/ml (optimal pre-tested). This population contains ~90% OB/OB precursors as previously established [Horowitz et al., 1994], [Simmons et al., 1982], [Jilka and Cohn, 1981]. OB cultures were fed twice per week with αMEM supplemented with 10% FBS, ascorbic acid (AA; 50 μg/ml added on day 0 and at all feedings), and β-glycerophosphate (BGP; 5mM added starting on day 7 and all subsequent feedings).
In Vitro OC-like cell formation models.
OC-like cells were generated as previously described [Kacena et al., 2004]. In brief, 2×10⁶ control or Mdm2TgOb BM cells/ml and 20,000 primary calvarial OB/ml were grown in a α-MEM supplemented with 10% FCS and 10−8 M 1,25(OH)2D3. The media was changed every other day for 6–8 days for OC formation then fixed with 2.5% gluteraldehyde in PBS for 30 min at RT. TRAP positive multinucleated cells (>3 nuclei) were quantified.
Cell culture.
Human MG63 osteosarcoma cells were maintained in 10% FBS DMEM, and treated with ascorbic acid (AA; 1ul/ml) and ß-glycerolphosphate (BGP; 10ul/ml) to induce differentiation.
Protein analysis.
Cell monolayers were harvested by scraping with in ice-cold 1X PBS. After centrifugation PBS was removed, pelleted cells were lysed with urea lysis buffer on ice for >2 hr and debris centrifuged. Supernatant was collected and protein concentrations were determined by BioRad assay. Protein was fractionated by SDS/PAGE and transferred to PVDF membrane (Amersham Biosciences). Membranes were blocked for 1 hr at room temperature (RT) in 5% non-fat dry milk in PBST, and subsequently incubated with primary antibodies in milk (1:1000) for 2 hr at RT. Mdm2 (SMP14, 2A10, and 4B11), Osteonectin (AON-1), and GAPDH (6C5) were purchased from Millipore (Calbiochem, Billerica, MA). β-actin (C4) was purchased from Santa Cruz Biotechnology (Santa Cruz, CA).
Cell cycle analysis.
WT and Mdm2ObTg OB were assessed on days 1, 3, 5, and 7 of culture. Cells were stained with equal volumes of staining buffered (0.1mg/ml propidium iodide + 0.6% Nonidet P40 in PBS) and 2mg/ml RNase as described previously [Srour et al., 1992]. OB were mixed well and incubated on ice for 30 min. A FACS caliber flow cytometer (BDIS) was used to determine the percentage of cells in phase G0/G1 and S/G2+M.
Quantitative analysis of calcium deposition by alizarin red staining.
To evaluate calcium deposition, monolayers of neonatal calvarial OB were stained with Alizarin Red S after 14 days in culture as previously described [Stanford et al., 1995]. Briefly, monolayers were washed 2X with PBS, subsequently fixed in ice cold 70% (v/v) ethanol for 1 hr, and washed 2X with water. Monolayers were stained with 40mM Alizarin Red S (pH 4.2) for 10 min at RT while shaking. Unbound dye was washed off with 5X water and 1X with PBS for 15 min at RT with shaking.
Statistical analysis.
Data are presented as the Mean ±1 SEM unless otherwise stated. Experiments were performed as duplicates or triplicates at least 3X. The sample size for in vivo studies is presented in the corresponding figure legends. Student’s t-test was performed when only two groups were compared. For ease of reporting and to increase sample size, data from both genders which shared identical properties were combined for all the in vivo data analysis. One-way analyses of variances (one-way ANOVA) with LSD were used to make multiple group comparisons.
Two-way analyses of variances (two-way ANOVA) were used to determine significant main effect contribution in cell co-culture groups, with BM genotype and OB genotype being the independent variables, as well as significant interaction effect between these independent variables. Statistical Package for Social Sciences (IBM SPSS 19; SPSS Inc., Armonk, NY) software was used to analyze the data with two tailed with a level of significance at 0.05.
Results
Previous efforts to understand Mdm2 function on oncogenic transformation through generation of global overexpressing transgenic mice (Mdm2Tg) led to lymphoma and sarcoma phenotypes in adult mice [Jones et al., 1998]. While this limited the utility of the model for studying physiological roles of Mdm2 in aged animals, the effects of global Mdm2 over-expression on osteogenesis, bone volume and architecture could be examined prior to 4 months of age. Micro-computed tomographic (μCT) analysis of 3-month-old male Mdm2Tg mice revealed an increase in trabecular bone fraction (BV/TV; Figure 1a,and c) and improved architecture in the vertebrae (Figure 1d-f). Additionally, the material bone mineral density (mBMD) of Mdm2Tg mice were significantly greater than in wild-type (WT) (Figure 1b). Overexpression of Mdm2 also significantly enhanced ex vivo OB differentiation from BM stromal cells (BMSCs) represented by mineralized nodules and increased alkaline phosphatase positive colonies compared to WT (Figure 1g, h).
Figure 1. Global overexpression of Mdm2 causes a high bone volume phenotype and increases osteogenic differentiation.
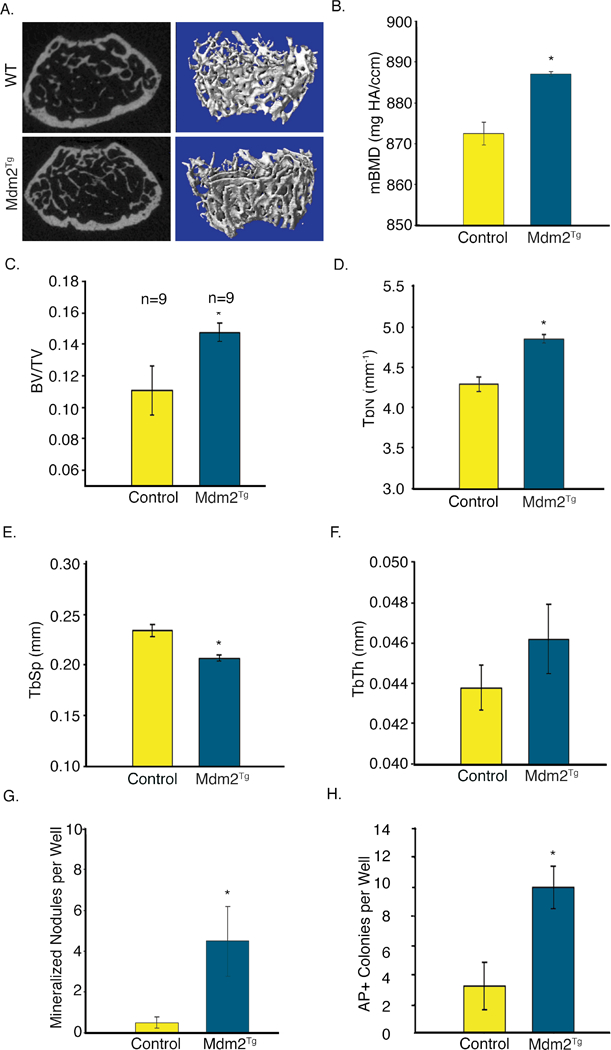
A. μCT imaging of Mdm2Tg vertebrae compared to wild type control. B. MDM2 overexpression increases mBMD of trabecular bone. C.-F. Mdm2 improves bone architecture with increases in BV/TV, Tb.N, decrease in Tb.Sp, and corresponding increase in Tb.Th. G. MDM2 overexpression enhances OB differentiation from BMSCs quantitated by mineralized nodules. H. Mdm2 overexpression increases Alkaline phosphatase colonies. Asterisk signifies statistical significance at p<0.05.
Though not definitive, these findings from the global Mdm2Tg strongly suggested a direct role of Mdm2 in differentiation and function. To definitively determine this skeletal phenotype was due to a direct role of Mdm2 in OBs, rather than indirect role via its effects in other cells in the BM microenvironment, we generated mice that overexpress Mdm2 only in cells of the osteogenic lineage (Mdm2TgOb) using a construct that contained the collagen 1.7kb fragment of the Col1a1 promoter (Col1.7) upstream of the murine Mdm2 cDNA. This promoter activity is limited to maturing OBs, and osteocytes. Two founder lines were generated that contained the Mdm2 transgene (Mdm2TgOb) as detected by PCR. To confirm that this promoter was active during OB differentiation, BMSCs were isolated from long bones and vertebrae. These cells were treated with ascorbic acid and β-glycerophosphate to induce osteoblastogenesis. Western blot analysis showed that Mdm2 levels were higher in BMSCs isolated from Mdm2TgOb long bone and vertebrae compared to controls (Figure 2a). Histological analysis of Mdm2 distal femur demonstrated Mdm2 staining in OBs and not OCs (Figure 2b). Mdm2TgOb OB cell proliferation was also higher than controls (Figure 2c). This result is consistent with the increase in calvarial OB proliferation observed in OB generated from p53−/−; Rb−/− mice as compared to WT counterparts. Lysates from Mdm2TgOb calvaria OBs show marked reductions in p53 levels compared to control OBs. Interestingly, p53−/− mice have a significant increase in BMD, BFR, and OB number [Wang et al., 2006]. Additionally, Mdm2TgOb OBs exhibited a 2-fold increase in osteocalcin mRNA compared to controls (Figure 2d).
Figure 2. Conditional overexpression of Mdm2 in osteogenic cells promotes osteogenic differentiation.
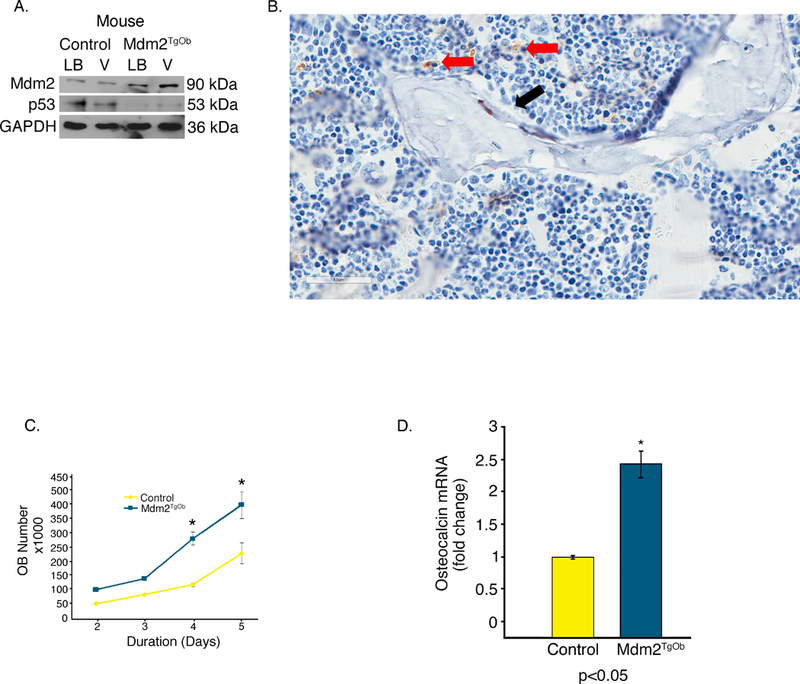
A. Representative Western blotting showing OB-specific overexpression of Mdm2 in bone marrow from Mdm2TgOb compared to wild type littermate controls upon induction of OB differentiation. Bone marrow cells were isolated from both the long bones (LB) and vertebrae (V) of 6-week-old female littermates. Mdm2 expression is higher in bone marrow cultures derived from Tg females as compared to cultures derived from WT control females. B. Mdm2 staining in OBs (red arrow) and not in OCs (black arrow) C. An increase in osteoblast proliferation from calvarial OB isolated from Mdm2TgOb is observed compared to wild type littermate control mice. D. An increase in osteocalcin mRNA in Mdm2TgOb mice compare to WT controls. Asterisk signifies statistical significance at p<0.05.
Alizarin red staining of calcium deposition showed enhanced mineralization in Mdm2TgOb compared to WT OB cultures (Figure 3d top panel). We also overexpressed or knocked down Mdm2 expression in p53-null MG63 human osteosarcoma cells (Mdm2-MG63 and shMdm2-MG63, respectively). Western blot analysis confirms transduction as levels of Mdm2 were increased in Mdm2-MG63 cells and decreased in ShMdm2-MG63 cells (Figure 3a). Western blot analysis revealed increased levels of osteonectin (a marker of osteoblast differentiation) in mouse Mdm2TgOb and Mdm2-MG63 cells compared to controls (Figure 3b top and bottom panels), while shMdm2-MG63 cells had a lower level of osteonectin compared to control cells (Figure 3b bottom panel). Western blot analysis shows that in shMdm2 MG63 cells, Sp1 levels are diminished compared to pLKO empty vector controls (Figure 3c top panel), and elevated in Mdm2-MG63 compared to pLV empty vector controls (Figure 3c bottom panel). We found that Mdm2-overexpressing cells were more effective at mineralization compared to control cells (Figure 3d middle panel). Conversely, shRNA-mediated knockdown of endogenous Mdm2 in MG63 cells inhibited mineralization compared to control MG63 cells (Figure 3d bottom panel). The data from both mouse and human cells implicate that Mdm2 may be regulating mineralization downstream of Sp1 through osteonectin.
Figure 3. Conditional overexpression of Mdm2 in osteogenic cells increases osteonectin, Sp1, and mineralization.
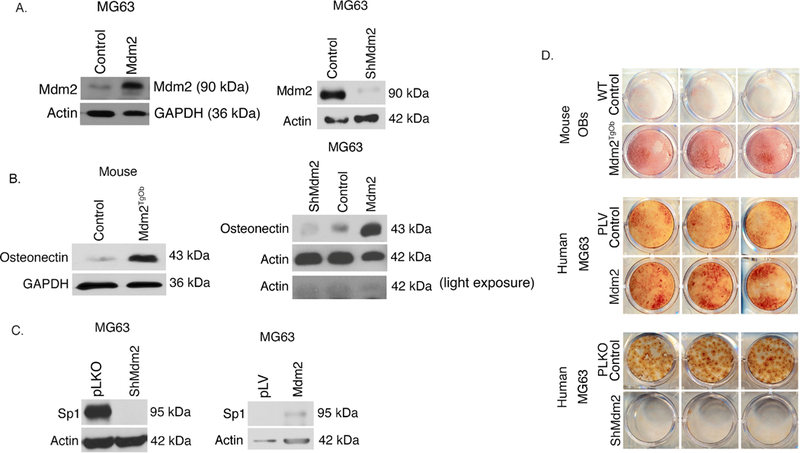
A. (Top panel) Western Blot analysis demonstrating elevated Mdm2 levels in human MG63 cells compared to wild type controls and (Bottom panel) decreased Mdm2 levels in silenced Mdm2 MG63 cells compared to vector control. B. (Top panel) Western blot analysis demonstrate elevated levels of osteonectin in mouse cells with overexpression of Mdm2 protein levels compared to vector control and (Bottom panel) elevated levels of osteonectin with increasing Mdm2 levels. C. (Top panel) Elevated Sp1 protein levels in pLKO vector control MG63 cells compared to ShMdm2 MG63 cells. (Bottom panel) Elevated Sp1 protein levels in Mdm2 overexpressed MG63 cells compared to pLV vector control. D. Mineralization by Alizarin Red staining. (Top panel) Mouse calvarial OB Mdm2TgOb shows increased mineralization compared to wild type OB control. (Middle panel) Overexpression of Mdm2 in MG63 human osteosarcoma cells resulted in greater mineralization compared to empty pLV vector control. (Bottom panel) Silencing of Mdm2 (ShMdm2) in MG63 human osteosarcoma cells resulted in significantly less mineralization compared to empty pLKO vector control. Asterisk signifies statistical significance at p<0.05.
Given that we observed a direct effect of Mdm2 expression on OB mineralization in vitro in human and murine cells, we next analyzed control and Mdm2TgOb mice for changes in their bone phenotype. Dual-energy X-ray absorptiometry (DEXA) showed that Mdm2TgOb mice had marked increases in their whole body and femoral bone mineral density (BMD) compared to controls (Figure 4a). In Figures 4b-h, μCT and histological analyses revealed increases in bone volume fraction (BV/TV) and mineral apposition rate, but no differences in trabecular thickness, trabecular separation, or bone formation rate. Calcein labeled cross sections from the femoral midshaft (Figure 5a) revealed a significant increase in cortical bone area (Figure 5b), cross sectional area (Figure 5c), endocortical surface area (Figure 5d) and endosteal bone formation rate (Figure 5f) with a concomitant decrease in endocortical area (Figure 5e) compared to controls.
Figure 4. Conditional overexpression of Mdm2 in osteogenic cells increases bone mass.
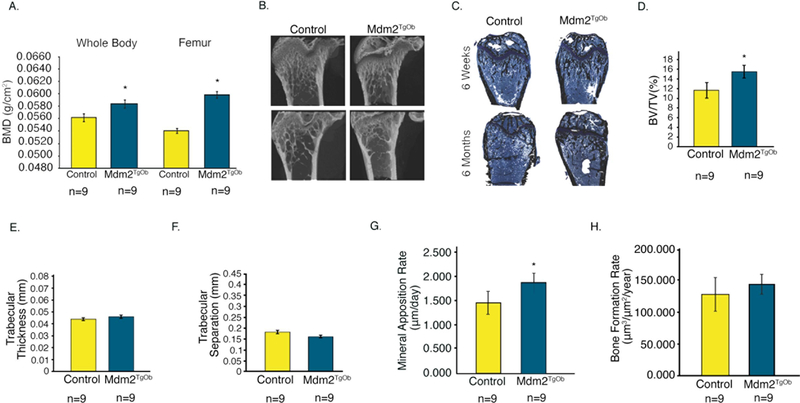
A. DEXA was used to evaluate whole body and femoral BMD of Mdm2TgOB mice compared to WT littermate controls. B. μCT and C. Histological staining (Von Kossa) of femurs at 6 weeks and 6 months. D. Trabecular Bone Volume Fraction or BV/TV. E. Trabecular Thickness. F. Trabecular Separation. G. Mineral Apposition Rate. H. Bone Formation Rate. Asterisk signifies statistical significance at p<0.05.
Figure 5. Conditional overexpression of Mdm2 in osteogenic cells increases cortical bone mass and formation.
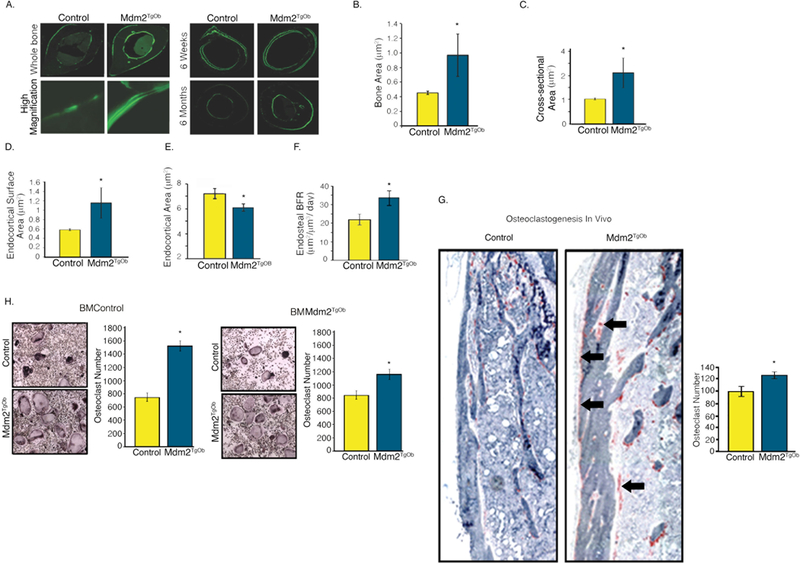
A. (Left panel) Calcein labeled, femoral midshaft, cross-sections from wild type controls and Mdm2TgOb mice and (Right panel) at 6 weeks and 6 months. B. Bone area. C. Cross-sectional area. D. Endocortical surface area. E. Endocortical area. F. Histomorphometry shows an increase in endosteal bone formation rate (BFR) of Mdm2TgOb compared to wild type controls. G. Femoral TRAP staining (black arrows) and quantitation demonstrating increased osteoclastogenesis in Mdm2TgOb mice. H. In vitro TRAP staining and quantitation using wild type osteoblast progenitors and co-cultured with wild type or Mdm2tgob increased osteoclast (left) or Mdm2tgob osteoblast progenitors cells with bone marrow cells from wild type or Mdm2tgob (right). Asterisk signifies statistical significance at p<0.05.
Interestingly, in vivo histological analysis revealed significant increases in osteoclast (OC) number on periosteal surfaces of the femur in Mdm2TgOb as compared to those generated from controls (Figure 5g). BM cells were isolated from femurs of Mdm2TgOb and controls, cultured in the presence of MCSF and RANKL (to promote osteoclast differentiation) and co-cultured with OB (control and Mdm2tgob), and OCs were enumerated as tartrate-resistant acid phosphatase (TRAP) positive cells with >3 nuclei. There was approximately a 2-fold increase in OCs generated from Mdm2TgOb cultures as compared to those generated from controls (Figure 5 h).
Next, to more directly compare our findings with that observed in the global Mdm2Tg mice, we examined the vertebrae of Mdm2TgOb mice. In Figure 6a-e, vertebrae from Mdm2TgOb mice, like Mdm2Tg mice, have significant increases in BV/TV and trabecular number, with decreases in trabecular separation. Analysis of both the vertebral and whole body BMD in Mdm2TgOb mice was also significantly elevated compared to controls. The vertebral data is from 9-month-old female mice, an age when control mice already begin to lose bone mass. Interestingly, in the 9-month-old Mdm2TgOb mice the age-related osteoporosis was corrected compared to littermate controls of the same age (Figure 6a).
Figure 6. Osteoblast-conditioned overexpression of Mdm2 increases the density and trabecular bone volume in the vertebra of adult mice.
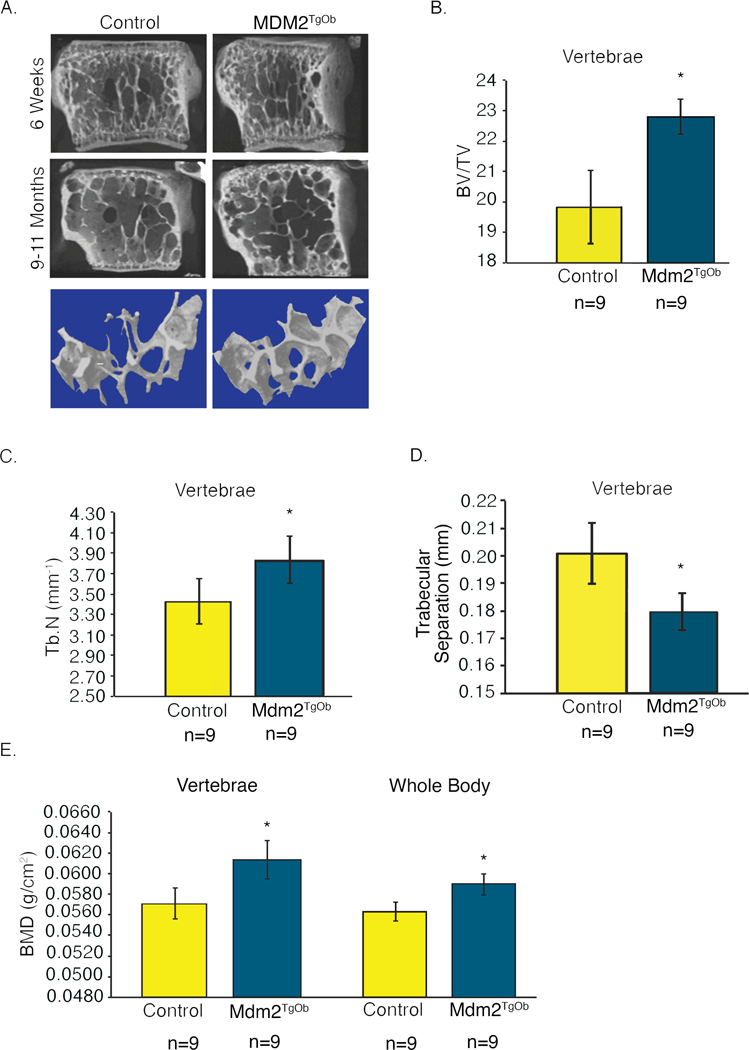
A. μCT images of vertebrae from 6-week and 9–11-month-old mice display marked differences in bone phenotype between wild type controls and Mdm2TgOb mice. B. Vertebral BV/TV. C. Vertebral Tb.N. D. Vertebral trabecular separation. E. DEXA measurements evaluating vertebral and whole body BMD demonstrate increases in BMD of Mdm2TgOb mice compared to wild type littermate controls. Data in all figures is presented as the average ± SEM. Asterisk signifies statistical significance at p<0.05.
Discussion
While the globally Mdm2 overexpressing transgenic animals developed tumors arising from soft tissue or hematopoietic system, we followed the Mdm2TgOb animals for over a year and there was no evidence of neoplastic development. The major difference between the global Mdm2Tg and osteoblast-specific Mdm2TgOb is sustained expression versus acute expression. The acute expression of Mdm2TgOb may be necessary for the generation of high quality bone as observed in our study versus sustained expression, which leads to neoplastic development.
Many studies have been conducted on mdm2−/− and conditional knockout animals; however, these studies are limited as a lethal phenotype is evident early during development due to p53. Knockout of p53 and Mdm2 lead to developmental defects or neoplastic development. Counter to using a knockout approach, Mdm2Tg animal, we were able to gain insight into physiological activity of Mdm2 in the presence of p53 in older animals. OB differentiation is guided by several extracellular signaling factors including fibroblast growth factors, parathyroid hormone, estrogen, bone morphogenetic protein, transforming growth factor β, Wnt, and members of the growth hormone/IGF family [Erlebacher et al., 1998; Hu et al., 2005; Isogai et al., 1996; Marie, 2003; Okazaki et al., 2002; Yamaguchi et al., 2000; Zheng et al., 1992]. All or most of these factors can have an influence on Mdm2 gene expression or protein levels and activity [Araki et al., 2010; Heron-Milhavet and LeRoith, 2002; Shaulian et al., 1997; Yang et al., 2006].
Our data shows a high bone mass phenotype (Fig.1). The increase in bone mass and bone mass turnover of these animals guided us to investigate what induces this phenotype downstream. We show that increased Mdm2 is associated with increased osteonectin, a factor important for mineralization. This was evident in our animal model and more importantly, in human cells in vitro (Fig 3). Upon examination of the transcription factor implicated in the induction of osteonectin, Sp1, we found it was elevated in human and murine models (Fig 3). The link to Mdm2 is important as osteonectin knockout animals present with severe skeletal defects [Boskey et al., 2003; Delany et al., 2000]. Thus, the biometric and molecular data support a novel physiological role for Mdm2 in the regulation of the bone microenvironment.
Collectively, our data suggest that Mdm2 has a significant proto-oncogene function in bone formation. Thus, diminished levels of Mdm2 may be involved in human bone pathologies. Moreover, targeting Mdm2 for acute expression may be an effective method to alleviate age-associated osteoporosis.
Acknowledgements
This work was supported by the National Cancer Institute R01 (CA172256) and Riley Children’s Foundation (LDM), and ITRAC-IUSCC (to LDM and MAK); the Center of Excellence in Molecular Hematology funded in part by NIH/NIDDK DK090948, the Indiana- Clinical and Translational Sciences Institute funded in part by NIH grants UL1TR001108 (MAK, AB), NIH/NIAMS grants ARO60863 (MAK) and AR060332 (MAK), and NIH T32 DK007519 (DJO); and NCI grant CA181204 (CME).
Contract grant sponsor: NIH; Contract grant number: R01 CA172256, Riley Children’s Foundation, Indiana University Simon Cancer Center (LDM).
References
- Abbas HA, Maccio DR, Coskun S, Jackson JG, Hazen AL, Sills TM, You MJ, Hirschi KK, Lozano G. 2010. Mdm2 is required for survival of hematopoietic stem cells/progenitors via dampening of ROS-induced p53 activity. Cell Stem Cell 7:606–17. [DOI] [PMC free article] [PubMed] [Google Scholar]
- Araki S, Eitel JA, Batuello CN, Bijangi-Vishehsaraei K, Xie XJ, Danielpour D, Pollok KE, Boothman DA, Mayo LD. 2010. TGF-beta1-induced expression of human Mdm2 correlates with late-stage metastatic breast cancer. J Clin Invest 120:290–302. [DOI] [PMC free article] [PubMed] [Google Scholar]
- Boskey AL, Moore DJ, Amling M, Canalis E, Delany AM. 2003. Infrared analysis of the mineral and matrix in bones of osteonectin-null mice and their wildtype controls. J Bone Miner Res 18:1005–11. [DOI] [PubMed] [Google Scholar]
- Chamboredon S, Briggs J, Vial E, Hurault J, Galvagni F, Oliviero S, Bos T, Castellazzi M. 2003. v-Jun downregulates the SPARC target gene by binding to the proximal promoter indirectly through Sp1/3. Oncogene 22:4047–61. [DOI] [PubMed] [Google Scholar]
- Chen H, Kolman K, Lanciloti N, Nerney M, Hays E, Robson C, Chandar N. 2012. p53 and MDM2 are involved in the regulation of osteocalcin gene expression. Exp Cell Res 318:867–76. [DOI] [PMC free article] [PubMed] [Google Scholar]
- Das B, Bayat-Mokhtari R, Tsui M, Lotfi S, Tsuchida R, Felsher DW, Yeger H. 2012. HIF-2alpha suppresses p53 to enhance the stemness and regenerative potential of human embryonic stem cells. Stem Cells 30:1685–95. [DOI] [PMC free article] [PubMed] [Google Scholar]
- Delany AM, Amling M, Priemel M, Howe C, Baron R, Canalis E. 2000. Osteopenia and decreased bone formation in osteonectin-deficient mice. J Clin Invest 105:915–23. [DOI] [PMC free article] [PubMed] [Google Scholar]
- Doi Y, Okuda R, Takezawa Y, Shibata S, Moriwaki Y, Wakamatsu N, Shimizu N, Moriyama K, Shimokawa H. 1989. Osteonectin inhibiting de novo formation of apatite in the presence of collagen. Calcif Tissue Int 44:200–8. [DOI] [PubMed] [Google Scholar]
- Erlebacher A, Filvaroff EH, Ye JQ, Derynck R. 1998. Osteoblastic responses to TGF-beta during bone remodeling. Mol Biol Cell 9:1903–18. [DOI] [PMC free article] [PubMed] [Google Scholar]
- Feher A, Koivunemi A, Koivunemi M, Fuchs RK, Burr DB, Phipps RJ, Reinwald S, Allen MR. 2010. Bisphosphonates do not inhibit periosteal bone formation in estrogen deficient animals and allow enhanced bone modeling in response to mechanical loading. Bone 46:203–7. [DOI] [PubMed] [Google Scholar]
- Guerin M, Thariat J, Ouali M, Bouvier C, Decouvelaere AV, Cassagnau E, Aubert S, Lepreux S, Coindre JM, Valmary-Degano S, Larousserie F, Meilleroux J, Projetti F, Stock N, Galant C, Marie B, Peyrottes I, de Pinieux G, Gomez-Brouchet A. 2016. A new subtype of high-grade mandibular osteosarcoma with RASAL1/MDM2 amplification. Hum Pathol 50:70–8. [DOI] [PubMed] [Google Scholar]
- Haines DS. 1997. The mdm2 proto-oncogene. Leuk Lymphoma 26:227–38. [DOI] [PubMed] [Google Scholar]
- He Y, de Castro LF, Shin MH, Dubois W, Yang HH, Jiang S, Mishra PJ, Ren L, Gou H, Lal A, Khanna C, Merlino G, Lee M, Robey PG, Huang J. 2015. p53 loss increases the osteogenic differentiation of bone marrow stromal cells. Stem Cells 33:1304–19. [DOI] [PMC free article] [PubMed] [Google Scholar]
- Heron-Milhavet L, LeRoith D. 2002. Insulin-like growth factor I induces MDM2-dependent degradation of p53 via the p38 MAPK pathway in response to DNA damage. J Biol Chem 277:15600–6. [DOI] [PubMed] [Google Scholar]
- Horowitz MC, Fields A, DeMeo D, Qian HY, Bothwell AL, Trepman E. 1994. Expression and regulation of Ly-6 differentiation antigens by murine osteoblasts. Endocrinology 135:1032–43. [DOI] [PubMed] [Google Scholar]
- Hu H, Hilton MJ, Tu X, Yu K, Ornitz DM, Long F. 2005. Sequential roles of Hedgehog and Wnt signaling in osteoblast development. Development 132:49–60. [DOI] [PubMed] [Google Scholar]
- Isogai Y, Akatsu T, Ishizuya T, Yamaguchi A, Hori M, Takahashi N, Suda T. 1996. Parathyroid hormone regulates osteoblast differentiation positively or negatively depending on the differentiation stages. J Bone Miner Res 11:1384–93. [DOI] [PubMed] [Google Scholar]
- Jilka RL, Cohn DV. 1981. Role of phosphodiesterase in the parathormone-stimulated adenosine 3’,5’-monophosphate response in bone cell populations enriched in osteoclasts and osteoblasts. Endocrinology 109:743–7. [DOI] [PubMed] [Google Scholar]
- Jones SN, Hancock AR, Vogel H, Donehower LA, Bradley A. 1998. Overexpression of Mdm2 in mice reveals a p53-independent role for Mdm2 in tumorigenesis. Proc Natl Acad Sci U S A 95:15608–12. [DOI] [PMC free article] [PubMed] [Google Scholar]
- Jones SN, Roe AE, Donehower LA, Bradley A. 1995. Rescue of embryonic lethality in Mdm2-deficient mice by absence of p53. Nature 378:206–8. [DOI] [PubMed] [Google Scholar]
- Jundt G, Berghauser KH, Termine JD, Schulz A. 1987. Osteonectin--a differentiation marker of bone cells. Cell Tissue Res 248:409–15. [DOI] [PubMed] [Google Scholar]
- Kacena MA, Shivdasani RA, Wilson K, Xi Y, Troiano N, Nazarian A, Gundberg CM, Bouxsein ML, Lorenzo JA, Horowitz MC. 2004. Megakaryocyte-osteoblast interaction revealed in mice deficient in transcription factors GATA-1 and NF-E2. J Bone Miner Res 19:652–60. [DOI] [PubMed] [Google Scholar]
- Lengner CJ, Steinman HA, Gagnon J, Smith TW, Henderson JE, Kream BE, Stein GS, Lian JB, Jones SN. 2006. Osteoblast differentiation and skeletal development are regulated by Mdm2-p53 signaling. J Cell Biol 172:909–21. [DOI] [PMC free article] [PubMed] [Google Scholar]
- Leveillard T, Gorry P, Niederreither K, Wasylyk B. 1998. MDM2 expression during mouse embryogenesis and the requirement of p53. Mech Dev 74:189–93. [DOI] [PubMed] [Google Scholar]
- Liu H, Li B. 2010. p53 control of bone remodeling. J Cell Biochem 111:529–34. [DOI] [PubMed] [Google Scholar]
- Maluszek M 2015. [Multifunctionality of MDM2 protein and its role in genomic instability of cancer cells]. Postepy Biochem 61:42–51. [PubMed] [Google Scholar]
- Manfredi JJ. 2010. The Mdm2-p53 relationship evolves: Mdm2 swings both ways as an oncogene and a tumor suppressor. Genes Dev 24:1580–9. [DOI] [PMC free article] [PubMed] [Google Scholar]
- Mann V, Hobson EE, Li B, Stewart TL, Grant SF, Robins SP, Aspden RM, Ralston SH. 2001. A COL1A1 Sp1 binding site polymorphism predisposes to osteoporotic fracture by affecting bone density and quality. J Clin Invest 107:899–907. [DOI] [PMC free article] [PubMed] [Google Scholar]
- Marie PJ. 2003. Fibroblast growth factor signaling controlling osteoblast differentiation. Gene 316:23–32. [DOI] [PubMed] [Google Scholar]
- Meijome TE, Hooker RA, Cheng YH, Walker W, Horowitz MC, Fuchs RK, Kacena MA. 2015. GATA-1 deficiency rescues trabecular but not cortical bone in OPG deficient mice. J Cell Physiol 230:783–90. [DOI] [PMC free article] [PubMed] [Google Scholar]
- Montes de Oca Luna R, Wagner DS, Lozano G. 1995. Rescue of early embryonic lethality in mdm2-deficient mice by deletion of p53. Nature 378:203–6. [DOI] [PubMed] [Google Scholar]
- Okazaki R, Inoue D, Shibata M, Saika M, Kido S, Ooka H, Tomiyama H, Sakamoto Y, Matsumoto T. 2002. Estrogen promotes early osteoblast differentiation and inhibits adipocyte differentiation in mouse bone marrow stromal cell lines that express estrogen receptor (ER) alpha or beta. Endocrinology 143:2349–56. [DOI] [PubMed] [Google Scholar]
- Pant V, Quintas-Cardama A, Lozano G. 2012. The p53 pathway in hematopoiesis: lessons from mouse models, implications for humans. Blood 120:5118–27. [DOI] [PMC free article] [PubMed] [Google Scholar]
- Romberg RW, Werness PG, Lollar P, Riggs BL, Mann KG. 1985. Isolation and characterization of native adult osteonectin. J Biol Chem 260:2728–36. [PubMed] [Google Scholar]
- Romberg RW, Werness PG, Riggs BL, Mann KG. 1986. Inhibition of hydroxyapatite crystal growth by bone-specific and other calcium-binding proteins. Biochemistry 25:1176–80. [DOI] [PubMed] [Google Scholar]
- Salinas-Souza C, De Oliveira R, Alves MT, Garcia Filho RJ, Petrilli AS, Toledo SR. 2013. The metastatic behavior of osteosarcoma by gene expression and cytogenetic analyses. Hum Pathol 44:2188–98. [DOI] [PubMed] [Google Scholar]
- Shaulian E, Resnitzky D, Shifman O, Blandino G, Amsterdam A, Yayon A, Oren M. 1997. Induction of Mdm2 and enhancement of cell survival by bFGF. Oncogene 15:2717–25. [DOI] [PubMed] [Google Scholar]
- Simmons DJ, Kent GN, Jilka RL, Scott DM, Fallon M, Cohn DV. 1982. Formation of bone by isolated, cultured osteoblasts in millipore diffusion chambers. Calcif Tissue Int 34:291–4. [DOI] [PubMed] [Google Scholar]
- Srour EF, Brandt JE, Leemhuis T, Ballas CB, Hoffman R. 1992. Relationship between cytokine-dependent cell cycle progression and MHC class II antigen expression by human CD34+ HLA-DR- bone marrow cells. J Immunol 148:815–20. [PubMed] [Google Scholar]
- Stanford CM, Jacobson PA, Eanes ED, Lembke LA, Midura RJ. 1995. Rapidly forming apatitic mineral in an osteoblastic cell line (UMR 106–01 BSP). J Biol Chem 270:9420–8. [DOI] [PubMed] [Google Scholar]
- Termine JD, Belcourt AB, Conn KM, Kleinman HK. 1981a. Mineral and collagen-binding proteins of fetal calf bone. J Biol Chem 256:10403–8. [PubMed] [Google Scholar]
- Termine JD, Kleinman HK, Whitson SW, Conn KM, McGarvey ML, Martin GR. 1981b. Osteonectin, a bone-specific protein linking mineral to collagen. Cell 26:99–105. [DOI] [PubMed] [Google Scholar]
- Walkley CR, Qudsi R, Sankaran VG, Perry JA, Gostissa M, Roth SI, Rodda SJ, Snay E, Dunning P, Fahey FH, Alt FW, McMahon AP, Orkin SH. 2008. Conditional mouse osteosarcoma, dependent on p53 loss and potentiated by loss of Rb, mimics the human disease. Genes Dev 22:1662–76. [DOI] [PMC free article] [PubMed] [Google Scholar]
- Wang X, Kua HY, Hu Y, Guo K, Zeng Q, Wu Q, Ng HH, Karsenty G, de Crombrugghe B, Yeh J, Li B. 2006. p53 functions as a negative regulator of osteoblastogenesis, osteoblast-dependent osteoclastogenesis, and bone remodeling. J Cell Biol 172:115–25. [DOI] [PMC free article] [PubMed] [Google Scholar]
- Warden SJ, Nelson IR, Fuchs RK, Bliziotes MM, Turner CH. 2008. Serotonin (5-hydroxytryptamine) transporter inhibition causes bone loss in adult mice independently of estrogen deficiency. Menopause 15:1176–83. [DOI] [PubMed] [Google Scholar]
- Weatherholt AM, Fuchs RK, Warden SJ. 2013. Cortical and trabecular bone adaptation to incremental load magnitudes using the mouse tibial axial compression loading model. Bone 52:372–9. [DOI] [PMC free article] [PubMed] [Google Scholar]
- Wong GL, Cohn DV. 1975. Target cells in bone for parathormone and calcitonin are different: enrichment for each cell type by sequential digestion of mouse calvaria and selective adhesion to polymeric surfaces. Proc Natl Acad Sci U S A 72:3167–71. [DOI] [PMC free article] [PubMed] [Google Scholar]
- Yamaguchi A, Komori T, Suda T. 2000. Regulation of osteoblast differentiation mediated by bone morphogenetic proteins, hedgehogs, and Cbfa1. Endocr Rev 21:393–411. [DOI] [PubMed] [Google Scholar]
- Yang X, Chen MW, Terry S, Vacherot F, Bemis DL, Capodice J, Kitajewski J, de la Taille A, Benson MC, Guo Y, Buttyan R. 2006. Complex regulation of human androgen receptor expression by Wnt signaling in prostate cancer cells. Oncogene 25:3436–44. [DOI] [PMC free article] [PubMed] [Google Scholar]
- Yoshida A, Ushiku T, Motoi T, Beppu Y, Fukayama M, Tsuda H, Shibata T. 2012. MDM2 and CDK4 immunohistochemical coexpression in high-grade osteosarcoma: correlation with a dedifferentiated subtype. Am J Surg Pathol 36:423–31. [DOI] [PubMed] [Google Scholar]
- Zhao Y, Yu H, Hu W. 2014. The regulation of MDM2 oncogene and its impact on human cancers. Acta Biochim Biophys Sin (Shanghai) 46:180–9. [DOI] [PMC free article] [PubMed] [Google Scholar]
- Zheng MH, Wood DJ, Papadimitriou JM. 1992. What’s new in the role of cytokines on osteoblast proliferation and differentiation? Pathol Res Pract 188:1104–21. [DOI] [PubMed] [Google Scholar]


