Abstract
Neurofibomatosis (NF1) patients are susceptible to multiple tumors of the nervous system including neurofibromas, optic glioma, malignant per- ipheral nerve sheath tumors (MPNSTs), and astrocytoma. The Nf1+/−;Trp53+/− (NPcis) mouse model of NF1 spontaneously develops astrocytoma and MPNSTs that are very similar to human NF1 tumors. To use this model for testing potential therapeutics, we have developed systems that take advantage of bioluminescent reporters of tumor growth. We have generated E2F1 promoter–driving luciferase (ELUX) reporter mice to detect pro- liferating tumors in NPcis mice in vivo using bioluminescence. The power of this system is that it enables looking at tumor evolution and detecting spontaneous tumors at early stages of development as they evolve within their natural haploinsufficient microenvironment. This system can be used to identify tumors at different stages of tumorigenesis and to examine where spontaneous NF1 tumors initiate. The ability to rapidly screen multiple animals at a time increases the potential for use of this model in preclinical trials. This model will be valuable for the characterization of spontaneous NF1 tumors and will be important for studying the treatment and prevention of NF1 tumors in vivo.
Introduction
Neurofibromatosis type 1 (NF1) is an autosomal dominant syndrome affecting one in every three thousand people. NF1 affects patients with 100% penetrance and is typically indicated by cutaneous café au lait patches and benign neurofibromas. Mutations of the NF1 gene also predispose individuals to developing nervous systems tumors including optic pathway pilocytic astocytomas, malignant peripheral nerve sheath tumors (MPNSTs), anaplastic astrocytoma, and glioblastoma (Pollack, Shutlz, and Mulvihill 1996; Sorensen, Mulvihill, and Nielsen 1986). The NF1 gene encodes the protein neurofibromin that functions as a rasGAP protein to negatively regulate oncogenic ras signaling (Martin et al. 1990). Loss of neurofibromin leads to increased ras activity downstream of growth factor signaling, thereby contributing to tumor development.
Inactivation of the Tp53 gene (Trp53 in the mouse) cooperates with loss of NF1 during tumorigenesis and plays a primary role in the progression of tumors in humans and mice (Cichowski et al. 1999; Ichimura et al. 2000; Menon et al. 1990; Watanabe et al. 1997; Zhu et al. 2005). The p53 protein is a transcription factor that functions as part of the cell-cycle checkpoint in response to DNA damage by regulating the expression of genes leading to growth arrest and apoptosis (Harris 1996). Tumors carrying mutations in p53 are often resistant to radiation and chemotherapeutic treatments (Weinstein et al. 1997).
Mouse models of NF1 carrying mutations in Nf1 and Trp53 on the same chromosome (Nf1−/+;Trp53−/+cis: NPcis) develop astrocytoma and MPNSTs with close similarity to human tumors (Cichowski et al. 1999; Reilly et al. 2000; Vogel et al. 1999). NPcis mice undergo spontaneous loss of heterozygosity, simultaneously losing the wild-type copy of Nf1 and Trp53 and leading to tumor development (Cichowski et al. 1999; Reilly et al. 2000). NPcis mice on the C57BL/6J back- ground have a high susceptibility for developing of astrocytoma (up to 71%) and MPNSTs (82%) (Cichowski et al. 1999; Reilly et al. 2000; Reilly et al. 2004; Walrath et al. 2009).
Astrocytomas are characterized by diffuse infiltration of the central nervous system, therefore they cannot be completely resected and lead to poor patient prognosis (Reilly et al. 2000; Ohgaki 2005). Furthermore, glioblastoma, the highest grade of astrocytoma, is virtually incurable, with a five-year survival rate of less than 5% (McLendon and Halperin 2003). Astrocytoma, including high-grade glioblastoma, is the most common malignant brain tumor in adults, with an incidence of fifteen in one hundred thousand in the general population. In addition, malignant astrocytomas affect 2% of NF1 patients. Recent studies in human primary glioblastoma and glioblastoma tumor lines have found NF1 to be commonly mutated (McLendon et al. 2008; Parsons et al. 2008) or neurofibromin destabilized (McGillicuddy et al. 2009) in glioblastoma, suggesting that loss of neurofibromin function is an important step in gliomagenesis. Therefore, the NPcis mouse model may be a useful tool for studying anti-astrocytoma approaches.
Malignant peripheral nerve sheath tumors are complex tumors formed by synergism between neoplastic Schwann cells and hyperactivated NF1−/+ stromal cells to form invasive tumors along peripheral nerves. Neurofibromatosis type 1 patients are at an increased risk for developing MPNSTs, with up to 10% of patients developing an MPNST. These tumors are aggressive and fatal and are a leading cause of mortality for NF1 patients. Sporadic MPNSTs occur with an incidence of one in one hundred thousand in the general population and carry a somewhat better prognosis compared to NF1- associated MPNSTs. The 5-year survival rate for sporadic MPNST is 42%, whereas the 5-year survival rate for NF1 patients is 21% (Evans et al. 2002).
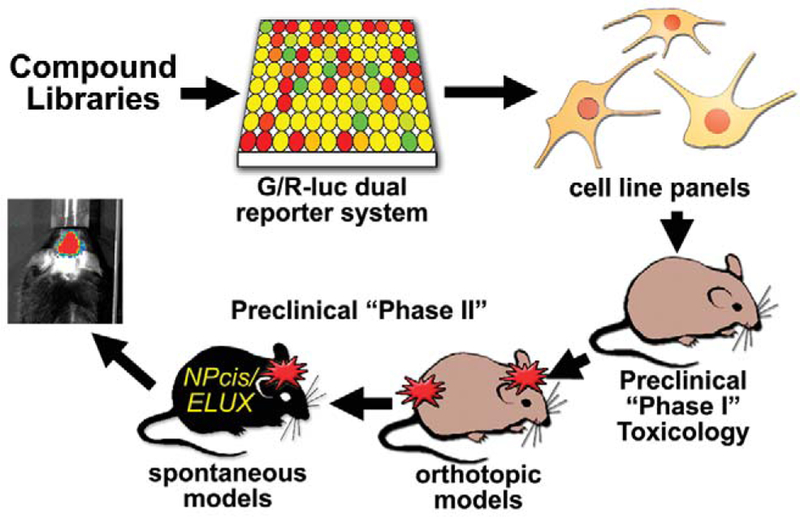
The MPNSTs and astrocytomas associated with NF1, as well as their sporadic counterparts, are currently incurable and particularly difficult to treat surgically because of their close association with the nervous system and their diffuse growth pattern. The NPcis mouse model mimics these characteristics and may provide a powerful model to test candidate therapeutics. We are developing a system (Figure 1) to screen for candidate therapies and test them against astrocytomas and MPNSTs in vivo. We are taking advantage of bioluminescence because of its high sensitivity and low background, as well as its successful use by others (Momota and Holland 2005). We are using an Nf1−/−;Trp53−/− anaplastic astrocytoma line expressing green and red luciferase under the control of proliferation-specific and constitutive promoters, respectively (G/R luc), as the basis for high-throughput screening of com- pounds, and then refining positive hits in the screen using a broader panel of Nf1−/−;Trp53−/− astrocytoma and MPNST cells. To test these compounds in vivo, we have developed in vivo imaging in the NPcis model to detect early tumors and measure tumor growth and response to therapy. Because tumorigenesis in NPcis mice is highly dependent on strain background (Reilly et al. 2000, 2004, 2006), we have generated a new reporter mouse on an inbred C57BL/6J strain to measure tumor growth on a controlled genetic background.
FIGURE 1.—
Diagram of using bioluminescent systems to screen candidate therapeutics. Drug libraries can be screened using a green and red luciferase (G/R-luc) dual-reporter system in NPcis anaplastic astrocytoma cells that distinguishes cytotoxic from antiproliferative agents. Compounds that look promising from the high-throughput screen can then be more specifically tested against a panel of mouse and human tumor lines, compared to normal cells such as astrocytes. Lead com- pounds can then be tested in vivo for toxicology and efficacy against orthotopic tumor models, using tumor lines transfected with luciferase reporters, and spontaneous tumor models, using the ELUX reporter system.
In Vitro Model for Therapeutic Testing
Since primary tumor cells isolated from NPcis astrocytomas show loss of the wild-type copies of Nf1 and Trp53 (Reilly et al. 2000) through large spontaneous deletions on chromo- some 11 (Reilly, unpublished data) and maintain tumor cell characteristics similar to human astrocytoma in vitro (Reilly et al. 2000), NPcis astroctyoma cell lines were used to build an in vitro assay for identifying novel anti-astrocytoma and anti-NF1 therapeutic candidates (Hawes et al. 2008). KR158 grade III NPcis anaplastic astrocytoma cells were stably transfected with a green and red luciferase (G/R-luc) dual-reporter system, where green luciferase is driven by the human E2F1 promoter and red luciferase is driven by the constitutively active cytomegalovirus (CMV) promoter. Dual-reporter cells are plated in 96-well or 384-well format in the presence of growth media with or without experimental compounds, and in starvation medium as a control. Cells in the starvation medium arrest and do not express green luciferase from the E2F1 promoter, but still express the constitutively active red luciferase from the CMV promoter. Compounds that inhibit growth, but do not kill cells, will similarly block green luciferase production but will allow red luciferase to be expressed. In contrast, compounds that kill cells will show a drop in both red and green luciferase expression. The G/R-luc dual-reporter system uses filtered luminescence to simultaneously assess activity of the human E2F1 promoter and cellular cytotoxicity in high-throughput assays.
The G/R-luc dual-reporter system has been used in high-throughput screening of chemically diverse compounds to identify agents with antiproliferative activity in Nf1null;Trp53-null astrocytoma cells (Hawes et al. 2008). Owing to simultaneous detection of two different reporters, this system is able to distinguish cytotoxic compounds from cytostatic compounds in a single assay. This system can also be used to examine the pharmacology of antitumor agents and combinatorial treatments in a high-throughput manner in Nf1null;Trp53-null astrocytoma cells, and then positive hits can be screened against a wider range of human and mouse astrocytoma cell lines (Hawes et al. 2008) and in vivo systems. The G/R-luc dual-reporter system will likely be a valuable tool in the identification and characterization of potential antitumor agents specifically targeting astrocytoma and Nf1-null;Trp53null tumors.
In Vivo Imaging
Detecting and quantifying tumors in vivo will greatly enhance the ability to characterize astrocytoma and therapeutic treatments. Bioimaging of luciferase expression in vivo is much quicker than other imaging modalities (e.g., five mice can be imaged in less than 15 minutes) (for review, see Lyons 2005). In addition, bioluminescent imaging is confined to viable cells and acutely responsive to tumor cell changes. Although magnetic resonance imaging (MRI) can detect tumors in vivo, MRI images include fibrotic and necrotic volumes, require relatively long experiments to visualize changes in tumor volume, and entail long imaging times. Since effective testing of therapeutics in vivo requires highthroughput testing of many test subjects, the speed and sensitivity of in vivo bioluminescence is ideal for high-throughput imaging of large cohorts of animals and determining the response time of tumor cells to treatment in preclinical tests.
Many current preclinical testing models use xenotransplantation of tumor cells into immunosuppressed mice. However, the tumor environment and immune response are critical components of NF1 tumorigenesis (Bajenaru et al. 2003; Daginakatte and Gutmann 2007; Goldbrunner et al. 2000; Riccardi 1981; Yang et al. 2008; Zhu et al. 2002). Therefore, NPcis mice of the C57BL/6J strain (NPcis, B6) that spontaneously develop NF1 tumors are preferable over in vivo tumor models that rely on orthotopic or subcutaneous implantation of exogenous tumorigenic cells into the novel environment of an immunosuppressed animal (see Becher and Holland [2006] and references therein). Furthermore, the high rate of tumor incidence in NPcis B6 mice make them ideal as a model for preclinical testing of antitumor agents for astrocytoma and MPNSTs. Thus, the NPcis model will be a powerful tool for understanding spontaneous NF1 tumorigenesis and identifying effective treatments.
Transgenic mice carrying the ELUX transgene, firefly luciferase driven by the human E2F1 promoter (Uhrbom 2004), were made directly onto the C57BL/6J background and crossed with NPcis mice to generate ELUXTg/+;NPcis (NPcis/ELUX) reporter mice. The human E2F1 promoter is active during normal cellular proliferation in wild-type cells undergoing proliferation. However, promoter activity is greatly enhanced in rapidly proliferating tumor cells, resulting in increased luciferase expression and bioluminescence (Parr et al. 1997).
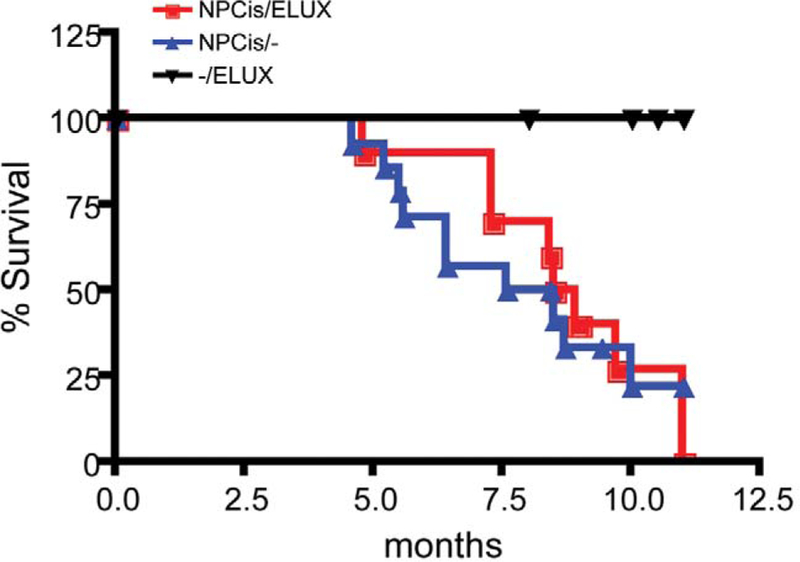
The ELUX transgene does not affect survival of NPcis mice on the C57BL/6J background. Kaplan-Meier survival analysis indicates that there are no significant differences in the timing of tumorigenesis between NPcis and NPcis/ELUX reporter mice (Figure 2). Therefore, the presence of the ELUX reporter transgene does not alter NPcis spontaneous tumor susceptibility.
FIGURE 2.—
The ELUX transgene does not affect the survival of NPcis mice on the C57BL/6J background. Survival curves indicate no significant differences in tumor progression between NPcis (NPcis/—) and NPcis;ELUXTg/+;(NPcis/ELUX) mice. Statistical analysis of survival curves was determined using PRISM Kaplan-Meier log-rank analysis.
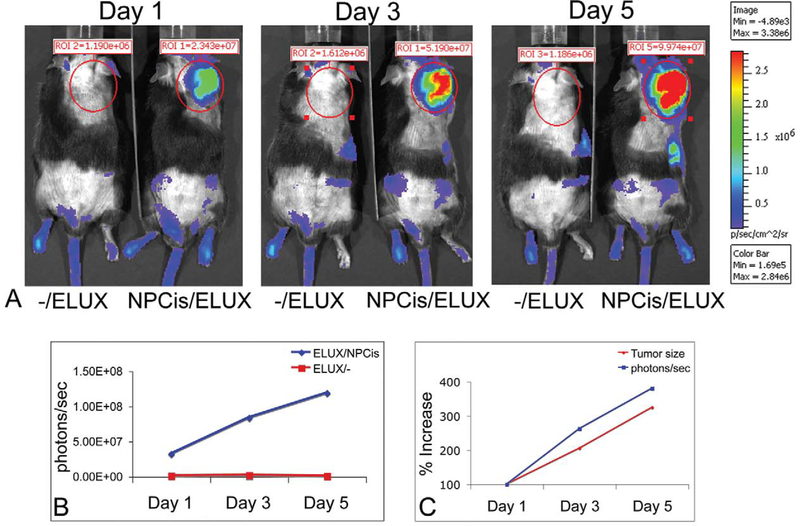
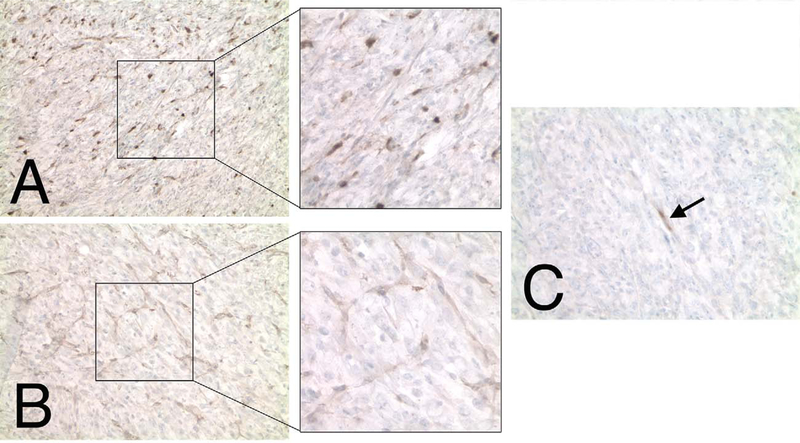
Bioluminescence of spontaneous tumors in NPcis/ELUX mice is highly sensitive and corresponds to tumor growth (Figure 3A). Tumor bioluminescence in NPcis/ELUX spontaneous MPNSTs can be 84-fold higher than background levels in black mice (Figure 3B). Furthermore, in vivo bioluminescence increases with tumor growth and is comparable to tumor size manually measured with calipers (Figure 3C). NPcis/ELUX spontaneous MPSNTs maintain positive S100 and Collagen IV staining that are characteristic of NPcis MPNST tumors (Figure 4), and show little to no staining of muscle markers, distinguishing them from rhabdomyosarcomas (Fig 4C).
FIGURE 3.—
NPcis/ELUX spontaneous MPNST bioluminescence (A). The bioluminescence (photons/sec) in the NPcis/ELUX tumor is 84-fold higher than background by the end of the experiment (Day 5) (B). The increase in tumor bioluminescence correlates with the increase in tumor size over time (C). Day 1 is the first day on which early tumors can be palpated. Tumor growth in this model is highly variable, but serial imaging allows accurate measurement of tumor growth over time. Representative data is shown for one mouse.
FIGURE 4.—
NPcis/ELUX MPNST tumor cells stain positive for S100 (A) and Collagen IV (B) Schwann cell markers. The majority of tumor cells are negative for muscle cell markers, such as Myf4 (shown in C), except for rare cells (black arrow) which may indicate entrapped degenerating muscle cells.
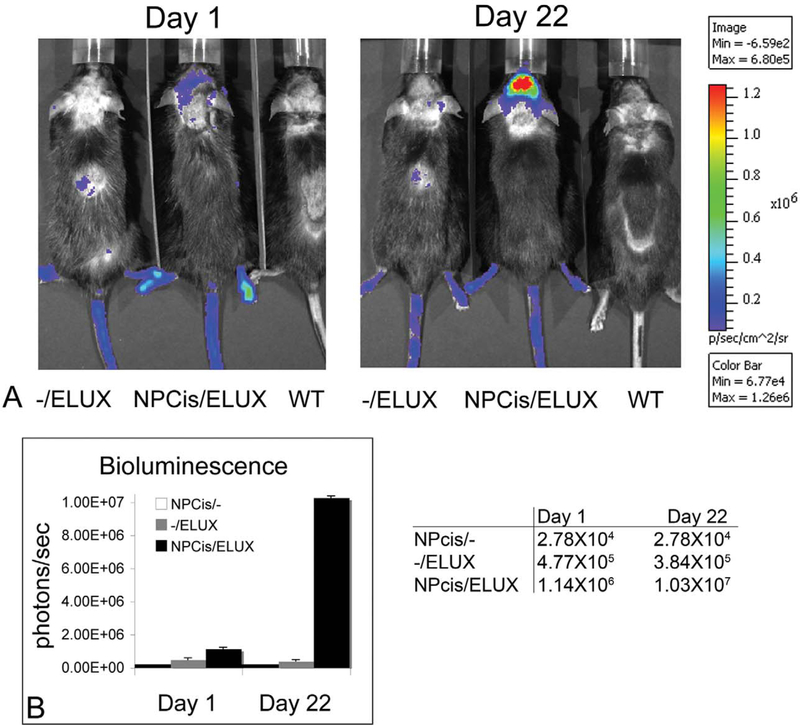
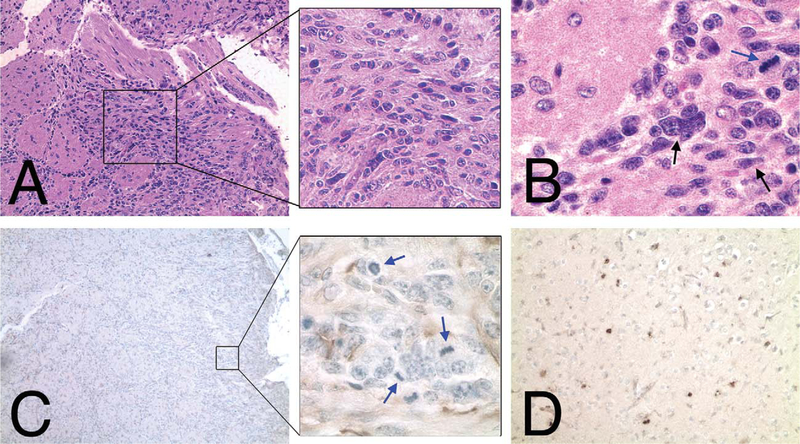
Bioluminescence of spontaneous brain tumors can be detected over background up to two and a half weeks before physical symptoms, such as ataxia, are clearly apparent (Figure 5). A ninefold increase in brain tumor bioluminescence was associated in a grade III astrocytoma that originated in the olfactory bulb and spread throughout the forebrain. NPcis/ ELUX brain tumor pathology is consistent with similar brain tumors described in NPcis mice containing multiple mitotic figures with positive staining for glial fibrillary acidic protein (GFAP) and Ki67 (Figure 6).
FIGURE 5.—
NPcis/ELUX spontaneous brain tumor bioluminescence (A). Brain tumor bioluminescence (photons/sec) is significantly higher over background on Day 1 and increases over ninefold in 3 weeks (B). The mouse was found to have a very subtle uneven gait on Day 1 and was imaged. Clear neurological symptoms of ataxia were not apparent until 2.5 weeks later. This demonstrates the value of using in vivo imaging to confirm the presence of brain tumors before clear neurological symptoms are present.
FIGURE 6.—
NPcis/ELUX spontaneous brain tumor pathology is similar to astrocytoma previously described for the NPcis mouse model (Reilly et al 2000). Hematoxylin and eosin–stained sections of NPcis/ELUX spontaneous brain tumor at the edge of the olfactory bulb and invading into the frontal cortex (A, B) have multiple atypical nuclei (black arrow; B) and mitotic figures (blue arrow; B). Mitotic figures (blue arrows) are associated with areas of glial fibrillary acidic protein–positive staining (C). Clusters of Ki67-positive cells (D) were found throughout the fore- brain (shown), as well as in the region of tumor in the olfactory bulb. Glial fibrillary acidic protein immunohistochemistry for astrocyte-like cells is shown as brown staining in panel C, with nuclear counterstain (hematoxylin) shown in blue. Ki67 immunohistochemistry for proliferating cells is shown as brown staining in panel D, with nuclear counterstain (hematoxylin) shown in blue.
As with any model system, it is important to be aware of the limitations of the model when interpreting data generated from it. Because the ELUX in vivo system relies on measurement of a transcriptional event (the E2F1 promoter driving luciferase) inhibitors that block transcription nonspecifically, or the E2F1 promoter specifically, may appear to show tumor regression when in fact the tumor is no longer expressing luciferase. It is therefore important to confirm results by histology at the end of the experiment. Likewise, the ELUX signal does not distinguish proliferation in tumor cells from proliferation in sur- rounding stromal-derived cells, such as blood vessels or inflammatory cells. Although the reduction in luciferase signal may be a result of the loss of other cell types, such as tumor blood vessels, it remains likely that compounds that cause these effects should be further investigated for anticancer properties. Again, it is crucial to confirm the effects of drugs on the tumor by histological analysis at the end of the experiment. This model system can be expanded to other pertinent tumor promoters (such as those marking tumor stem cells) driving luciferase and used in concert to gain a better understanding of drug effects in vivo.
These data suggest that NPcis/ELUX mice develop MPNSTs and astrocytoma similarly to the previously described NPcis mouse model of NF1. In addition, MPNST and astrocytoma tumor bioluminescence is markedly increased over background and correlates with tumor growth. Furthermore, tumor growth can be detected earlier with bioluminescence before physical symptoms appear, which will be beneficial for studying the effects of treatment intervention at various stages of tumor development.
Material and Methods
ELUX Transgene
The Ef-luc plasmid (ELUX transgene) containing the luciferase gene behind the E2F promotor was a generous gift from Dr. Eric Holland and has been previously described (Uhrbom, Nerio, and Holland 2004). Briefly, cDNA encoding a modified firefly luciferase from the pGL3-Basic vector (Promega, Madison, WI) was cloned into a plasmid behind a 273-bp fragment of the E2F1 promoter and flanked by a polyadenylation sequence.
Animals
All mice were bred and maintained at the National Cancer Institute (NCI)-Frederick according to the guidelines and regulations of the Animal Care and Use Committee. Transgenic mice were generated by the Transgenic Mouse Model Laboratory, Laboratory Animal Sciences Program, SAIC-Frederick. The Ef-luc vector was linearized by digestion with restriction enzymes and purified for microinjection into inbred C57BL/6J zygote pronuclei that were transferred into pseudopregnant females so as to generate founder animals. The presence of the transgene in founder mice was confirmed by polymerase chain reaction (PCR) amplification of DNA obtained from tail biopsies and southern analysis. ELUX founder mice were crossed with wild-type C57BL/6J mice to generate F1 offspring and to verify germline transmission of the transgene. Bioluminescence imaging was used to identify founder mice and F1 progeny with the highest levels of luciferase expression in proliferating cells found in the testes and the skin of the paws.
Generation and characterization of NPcis mice have been previously described (Cichowski et al. 1999; Reilly et al. 2000; Reilly et al. 2004). ELUX mice were crossed with NPcis mice of the C57BL/6J background to generate NPCis;ELUXTg/+ (NPCis;ELUX) progeny.
In Vivo Bioluminescence Imaging:
Mice were anesthetized with 2.5% isofluorene and administered an intraperitoneal injection of 150 mg/g D-Luciferin (Xenogen, Hopkinton, MA). Because black hair from B6 mice can sometimes inhibit the detection of photon emissions in vivo, the dorsal surface of the head and body were shaved. Ten minutes after injection, the animals were placed within the Xenogen CCD imaging apparatus, and images were acquired using the Xenogen Spectrum (Caliper Life Sciences, Hopkinton, MA) system and analyzed using Living Image software (Caliper Life Sciences, version 3.1, Hopkinton, MA, released Nov 13, 2008). The resultant pseudo-color images representing photon counts were pro- jected onto a photographic image for representation. The photon counts per second were measured for tumor and control regions of each mouse. A circular region around the tumor or between the ears for a brain tumor was defined based on the largest final images and set as a standard to compare all images within the same experimental set. Percentage increases were calculated based on the bioluminescence from Day 1 for each individual region measured.
Necropsy and Immunohistochemistry:
Mice were euthanized by CO2 asphyxiation. At the time of harvest, tumors were manually measured with calipers and the size estimated using the ellipsoid formula of height × width × length × 0.5 (mm3) (Tomayko and Reynolds 1989). Fixed brains and tumors were embedded in paraffin for sectioning and stained with hematoxylin and eosin. For immunohistochemistry, tissue sections were pretreated with Trilogy (Cell Marque, Rocklin, CA) in a pressure cooker and endogenous peroxidases were then blocked in 3% hydrogen peroxide for ten minutes at room temperature. Sections were incubated with primary antibodies raised against glial fibrillary acidic protein GFAP (1:300; DakoCytomation, Carpinteria, CA), S100 (1:100; DakoCytomation, Carpinteria, CA), Ki67 (1:25; DakoCytomation, Carpinteria, CA), collagen IV (1:50; MP Biomedical/Cappel, Solon, OH), and Myf4 (1:30; clone L026, Novocastra, Newcastle upon Tyne, UK) overnight at 4 °C. After washing, sections were incubated with anti-rabbit-biotin or anti-mouse IgG-biotin secondary antibodies (Jackson ImmunoResearch Laboratories, West Grove, PA) and detected using the Vector Elite ABC kit and 3,3’-diaminobenzidine (DAB) substrate for peroxidase (Vector Laboratories, Burlingame, CA). Sections were counterstained with hematoxylin to visualize the nuclei. Astrocytomas were positively identified by the presence of atypical nuclei, mitotic figures, and infiltrative boundaries with positive immunostaining for the astrocytic marker GFAP and the proliferation marker Ki67 (Weiss et al. 2002). Malignant peripheral nerve sheath tumors were identified by positive staining for Schwann cell markers S100 and collagen IV, with negative staining for the myofibril muscle cell marker Myf4.
Acknowledgments
This research was supported by the Intramural Research Program of the National Institutes of Health, National Cancer Institute, and with federal funds from the National Cancer Institute, National Institutes of Health, under Contract No. HHSN261200800001E to SAIC, Inc. This research was per- formed while J. J. H. held a National Research Council Research Associateship Award at the National Cancer Institute. Special thanks to K. Fox and E. Truffer for animal care assistance and A. Leeder for bioimaging assistance. Special thanks to L. Feigenbaum and the Transgenic Mouse Model Laboratory, Laboratory Animal Sciences Program, SAIC- Frederick, for generating the ELUX transgenic founder mice. All experiments were conducted in compliance with the current laws of the United States. The content of this publication does not necessarily reflect the views or policies of the Department of Health and Human Services, nor does mention of trade names, commercial products, or organizations imply endorsement by the United States government.
Footnotes
The authors declared that they had no conflicts of interests or financial disclosures with respect to their authorship or the publication of this article.
REFERENCES
- Bajenaru ML, Hernandez MR, Perry A, Zhu Y, Parada LF, Garbow JR, and Gutmann DH (2003). Optic nerve glioma in mice requires astrocyte Nf1 gene inactivation and Nf1 brain heterozygosity. Cancer Res 63 (24), 8573–77. [PubMed] [Google Scholar]
- Becher OJ, and Holland EC (2006). Genetically engineered models have advantages over xenografts for preclinical studies. Cancer Res 66 (7), 3355–58, discussion 3358–59. [DOI] [PubMed] [Google Scholar]
- Cichowski K, Shih T, Schmitt E, Santiago S, Reilly K, McLaughlin ME, Bronson RT, and Jacks T (1999). Mouse models of tumor development in neurofibromatosis type I. Science 286, 2172–76. [DOI] [PubMed] [Google Scholar]
- Daginakatte GC, and Gutmann DH (2007). Neurofibromatosis-1 (Nf1) heterozygous brain microglia elaborate paracrine factors that promote Nf1- deficient astrocyte and glioma growth. Hum Mol Genet 16 (9), 1098–1112. [DOI] [PubMed] [Google Scholar]
- Evans DG, Baser ME, McGaughran J, Sharif S, Howard E, and Moran A (2002). Malignant peripheral nerve sheath tumours in neurofibromatosis 1. J Med Genet 39 (5), 311–14. [DOI] [PMC free article] [PubMed] [Google Scholar]
- Goldbrunner RH, Wagner S, Roosen K, and Tonn JC (2000). Models for assessment of angiogenesis in gliomas. J Neurooncol 50 (1–2), 53–62. [DOI] [PubMed] [Google Scholar]
- Harris CC (1996). p53 tumor suppressor gene: from the basic research laboratory to the clinic—an abridged historical perspective. Carcinogenesis 17 (6), 1187–98. [DOI] [PubMed] [Google Scholar]
- Hawes JJ, Nerva JD, and Reilly KM (2008). Novel dual-reporter preclinical screen for antiastrocytoma agents identifies cytostatic and cytotoxic compounds. J Biomol Screen 13 (8), 795–803. [DOI] [PMC free article] [PubMed] [Google Scholar]
- Ichimura K, Bolin MB, Goike HM, Schmidt EE, Moshref A, and Collins VP (2000). Deregulation of the p14ARF/MDM2/p53 pathway is a prerequisite for human astrocytic gliomas with G1-S transition control gene abnormalities. Cancer Res 60 (2), 417–24. [PubMed] [Google Scholar]
- Lyons SK (2005). Advances in imaging mouse tumour models in vivo. J Pathol 205 (2), 194–205. [DOI] [PubMed] [Google Scholar]
- Martin GA, Viskochil D, Bollag G, McCabe PC, Crosier WJ, Haubruck H, Conroy L, Clark R, O’Connell P, Cawthon RM, et al. (1990). The GAP-related domain of the neurofibromatosis type 1 gene product interacts with ras p21. Cell 63 (4), 843–49. [DOI] [PubMed] [Google Scholar]
- McGillicuddy LT, Fromm JA, Hollstein PE, Kubek S, Beroukhim R, De Raedt T, Johnson BW, Williams SM, Nghiemphu P, Liau LM, Cloughesy TF, Mischel PS, Parret A, Seiler J, Moldenhauer G, Scheffzek K, Stemmer-Rachamimov AO, Sawyers CL, Brennan C, Messiaen L, Mellinghoff IK, and Cichowski K (2009). Proteasomal and genetic inactivation of the NF1 tumor suppressor in gliomagenesis. Cancer Cell 16 (1), 44–54. [DOI] [PMC free article] [PubMed] [Google Scholar]
- McLendon R, et al. (2008). Comprehensive genomic characterization defines human glioblastoma genes and core pathways. Nature 455 (7216), 1061–68. [DOI] [PMC free article] [PubMed] [Google Scholar]
- McLendon RE, and Halperin EC (2003). Is the long-term survival of patients with intracranial glioblastoma multiforme overstated? Cancer 98 (8), 1745–48. [DOI] [PubMed] [Google Scholar]
- Menon A, Anderson K, Riccardi VM, Chung RY, Whaley JM,Yandell DW, Farmer GE, Freiman RN, Lee JK, Li FP, et al. (1990). Chromosome 17p deletions and p53 gene mutations associated with the formation of malignant neurofibrosarcomas in von Recklinghausen neurofibromatosis. Proc Natl Acad Sci U S A 87, 5435–39. [DOI] [PMC free article] [PubMed] [Google Scholar]
- Momota H, and Holland EC (2005). Bioluminescence technology for imaging cell proliferation. Curr Opin Biotechnol 16 (6), 681–86. [DOI] [PubMed] [Google Scholar]
- Ohgaki H (2005). Genetic pathways to glioblastomas. Neuropathology 25 (1), 1–7. [DOI] [PubMed] [Google Scholar]
- Parr MJ, Manome Y, Tanaka T, Wen P, Kufe DW, Kaelin WG Jr., and Fine HA (1997). Tumor-selective transgene expression in vivo mediated by an E2F-responsive adenoviral vector. Nat Med 3 (10), 1145–49. [DOI] [PubMed] [Google Scholar]
- Parsons DW, Jones S, Zhang X, Lin JC, Leary RJ, Angenendt P,Mankoo P, Carter H, Siu IM, Gallia GL, Olivi A, McLendon R, Rasheed BA, Keir S, Nikolskaya T, Nikolsky Y, Busam DA, Tekleab H, Diaz LA Jr., Hartigan J, Smith DR,Strausberg RL, Marie SK, Shinjo SM, Yan H, Riggins GJ, Bigner DD, Karchin R, Papadopoulos N, Parmigiani G, Vogelstein B, Velculescu VE, and Kinzeler KW (2008). An Inte- grated Genomic Analysis of Human Glioblastoma Multiforme. Science 321 (5897), 1807–12. [DOI] [PMC free article] [PubMed] [Google Scholar]
- Pollack IF, Shultz B, and Mulvihill JJ (1996). The management of brainstem gliomas in patients with neurofibromatosis 1. Neurology 46 (6), 1652–60. [DOI] [PubMed] [Google Scholar]
- Reilly KM, Broman KW, Bronson RT, Tsang S, Loisel DA, Christy ES, Sun Z, Diehl J, Munroe DJ, and Tuskan RG (2006). An imprinted locus epistatically influences Nstr1 and Nstr2 to control resistance to nerve sheath tumors in a neurofibromatosis type 1 mouse model. Cancer Res 66 (1), 62–68. [DOI] [PMC free article] [PubMed] [Google Scholar]
- Reilly KM, Loisel DA, Bronson RT, McLaughlin ME, and Jacks T (2000). Nf1;Trp53 mutant mice develop glioblastoma with evidence of strain-specific effects. Nat Genet 26 (1), 109–13. [DOI] [PubMed] [Google Scholar]
- Reilly KM, Tuskan RG, Christy E, Loisel DA, Ledger J, Bronson RT, Smith CD, Tsang S, Munroe DJ, and Jacks T (2004). Susceptibility to astrocytoma in mice mutant for Nf1 and Trp53 is linked to chromosome 11 and subject to epigenetic effects. Proc Natl Acad Sci U S A 101 (35), 13008–13. [DOI] [PMC free article] [PubMed] [Google Scholar]
- Riccardi VM (1981). Cutaneous manifestation of neurofibromatosis: cellular interaction, pigmentation, and mast cells. Birth Defects Orig Artic Ser 17 (2), 129–45. [PubMed] [Google Scholar]
- Sorensen SA, Mulvihill JJ, and Nielsen A (1986). Long-term follow-up of von Recklinghausen neurofibromatosis. Survival and malignant neoplasms. N Engl J Med 314 (16), 1010–15. [DOI] [PubMed] [Google Scholar]
- Tomayko MM, and Reynolds CP (1989). Determination of subcutaneous tumor size in athymic (nude) mice. Cancer Chemother Pharmacol 24 (3), 148–54. [DOI] [PubMed] [Google Scholar]
- Uhrbom L, Nerio E, and Holland EC (2004). Dissecting tumor maintenance requirements using bioluminescence imaging of cell proliferation in a mouse glioma model. Nat Med 10 (11), 1257–60. [DOI] [PubMed] [Google Scholar]
- Vogel KS, Klesse LJ, Velasco-Miguel S, Meyers K, Rushing EJ, and Parada LF (1999). Mouse tumor model for neurofibromatosis type 1. Science 286 (5447), 2176–79. [DOI] [PMC free article] [PubMed] [Google Scholar]
- Walrath JC, Fox K, Truffer E, Gregory Alvord W., Quin˜ones OA, and Reilly KM (2009). Chr 19(A/J) modifies tumor resistance in a sex- and parent-of-origin-specific manner. Mamm Genome 20 (4), 214–23. [DOI] [PMC free article] [PubMed] [Google Scholar]
- Watanabe K, Sato K, Biernat W, Tachibana O, von Ammon K, Ogata N, Yonekawa Y, Kleihues P, and Ohgaki H (1997). Incidence and timing of p53 mutations during astrocytoma progression in patients with multiple biopsies. Clin Cancer Res 3 (4), 523–30. [PubMed] [Google Scholar]
- Weinstein JN, Myers TG, O’Connor PM, Friend SH, Fornace AJ Jr., Kohn KW, Fojo T, Bates SE, Rubinstein LV, Anderson NL,Buolamwini JK, van Osdol WW, Monks AP, Scudiero DA, Sausville EA, Zaharevitz DW, Bunow B, Viswanadhan VN, Johnson GS, Wittes RE, and Paull KD (1997). An informationintensive approach to the molecular pharmacology of cancer. Science 275 (5298), 343–49. [DOI] [PubMed] [Google Scholar]
- Weiss WA, Israel M, Cobbs C, Holland E, James CD, Louis DN, Marks C, McClatchey AI, Roberts T, Van Dyke T,Wetmore C, Chiu IM, Giovannini M, Guha R, Higgins RJ, Marino S, Radovanovic I, Reilly K, and Aldape K (2002). Neuropathology of genetically engineered mice: consensus report and recommendations from an international forum. Oncogene 21 (49), 7453–63. [DOI] [PubMed] [Google Scholar]
- Yang FC, Ingram DA, Chen S, Zhu Y, Yuan J, Yang X, Knowles S,Horn W, Li Y, Zhang S, Yang Y, Vakili ST, Yu M, Burns D, Robertson K, Hutchins G, Parada LF, and Clapp DW (2008). Nf1-dependent tumors require a microenvironment containing Nf1+/− and c-kit-dependent bone marrow. Cell 135 (3), 437–48. [DOI] [PMC free article] [PubMed] [Google Scholar]
- Zhu Y, Ghosh P, Charnay P, Burns DK, and Parada LF (2002). Neurofibromas in NF1: Schwann cell origin and role of tumor environment. Science 296 (5569), 920–22. [DOI] [PMC free article] [PubMed] [Google Scholar]
- Zhu Y, Guignard F, Zhao D, Liu L, Burns DK, Mason RP, Messing A, and Parada LF (2005). Early inactivation of p53 tumor suppressor gene cooperating with NF1 loss induces malignant astrocytoma. Cancer Cell 8 (2), 119–30. [DOI] [PMC free article] [PubMed] [Google Scholar]


