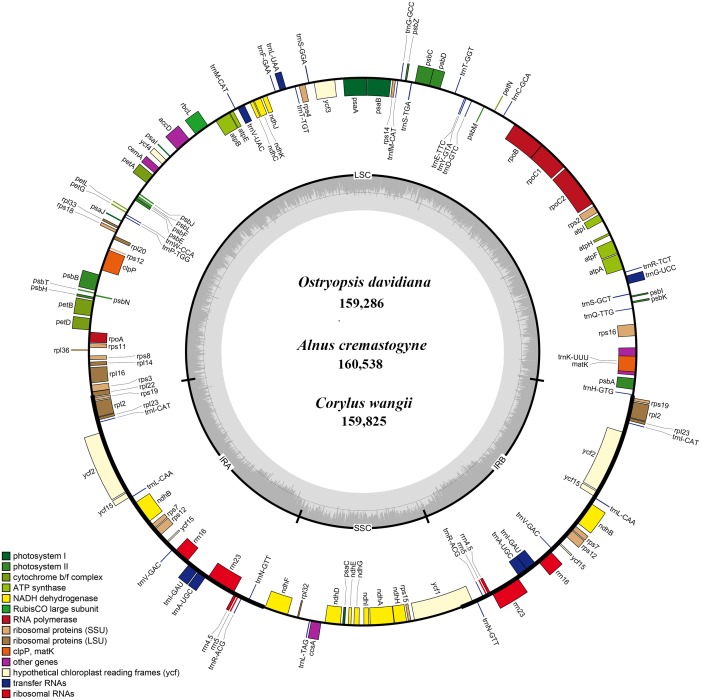
Figure 1. The genome maps of three Betulaceae chloroplast genomes.
The genes outside and inside of the circle are transcribed in the counterclockwise and clockwise directions, respectively. Different colors indicate the genes belonging to different functional groups. The thicknesses denote the extent of IRs (IRa and IRb) that separate the cp genomes into LSC and SSC regions.

