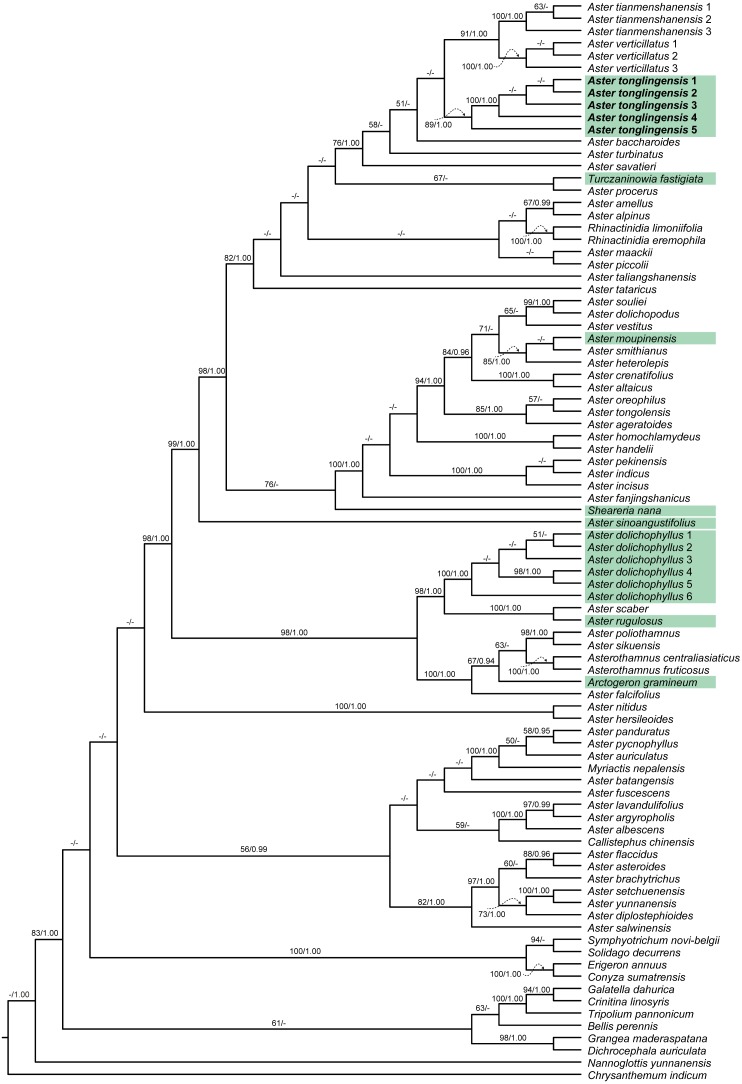
Figure 1. Cladogram of the maximum likelihood (ML) phylogenetic tree of Aster.
Phylogenetic tree based on combined data (ITS, ETS and trnL-F), showing the position of Aster tonglingensis (in bold) and the species with narrowly lanceolate leaf (with green background). Values above branch represent bootstrap values (BS) and Bayesian posterior probabilities (PP), respectively; the dash (–) indicates BS < 50% or PP < 0.90.

