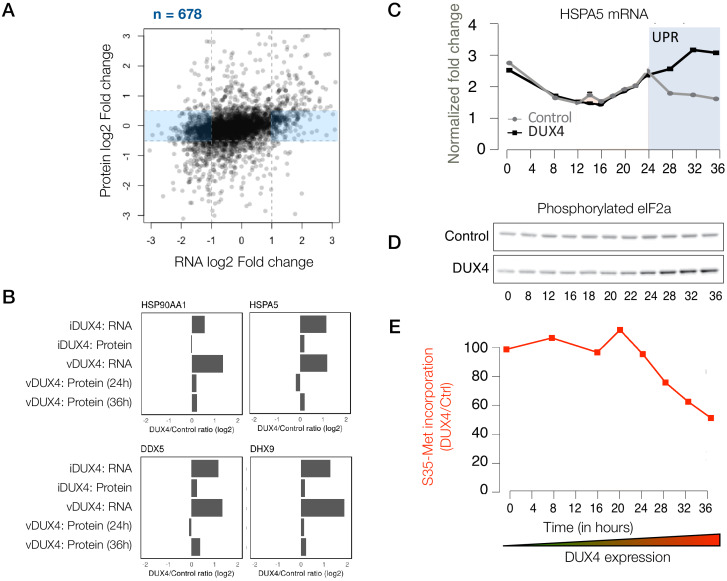
Figure 3. Extensive post-transcriptional buffering of stress-response genes in DUX4-expressing cells.
(A) Scatter plot of log2 fold change in RNA levels (DUX4/control) versus log2 fold change in protein levels (DUX4/control). Genes that are upregulated at the RNA level but no significant change at the protein level fall within the blue rectangle. (B) RNA and protein fold change across the different datasets for representative genes that show post-transcriptional buffering. (C) Changes in the RNA levels of the chaperone HSPA5 over the duration of vDUX4 expression (or control expression) as measured by qRT-PCR. The region shaded in blue represents the region where the vDUX4 sample significantly deviates from the Control because of the induction of the unfolded protein response (UPR). (D) Levels of phosphorylated eIF2α in control cells versus DUX4-expressing cells over an expression time course as detected by immunoblots. (E) Percentage of [35S]-Methionine incorporation (representing translation efficiency) in DUX4-expressing cells normalized over control cells during the time course of DUX4 expression.

