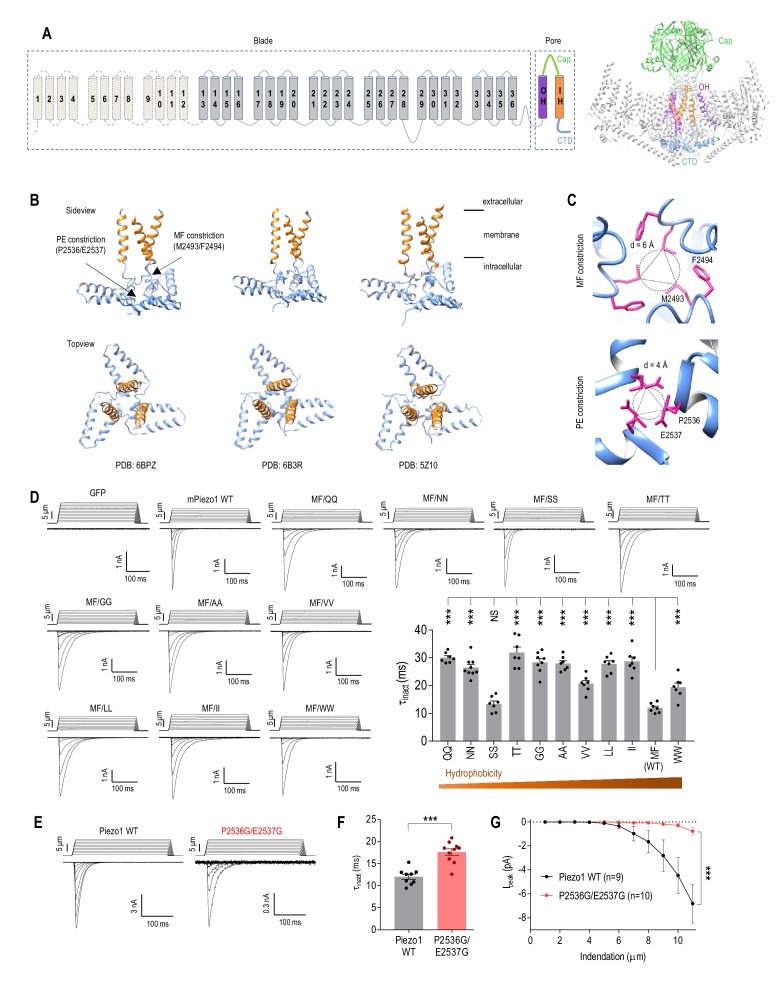
Figure 1. Physical constrictions in the CTD play only moderate roles in Piezo1 inactivation.
(A) Topology diagram and cryo-EM structure of Piezo1 (PDB: 6BPZ). IH, inner pore helix; OH, outer pore helix. (B) Side view and top view of the Piezo1 pore region from three cryo-EM structures showing the location of the MF and PE constrictions. (C) Top view close-up of the MF and PE constrictions in Piezo1 (PDB: 6BPZ). (D) Representative whole-cell MA current traces and quantification of MA current inactivation rate (τinact) in HEK293TΔP1 cells expressing Piezo1 with mutations at the M2493 F2494 (MF) site (n = 7–9 cells). Ehold = −80 mV. ***p<0.001; NS, not significant, p>0.05, one-way ANOVA with Holm-Sidak’s correction. (E and F) Representative whole-cell MA current traces and quantification of MA current inactivation for WT Piezo1 and P2536G/E2537G mutant. **p<0.001, unpaired t-test. (G) Quantification of peak MA current amplitude (Ipeak) at different indentation depths for WT Piezo1 and P2536G/E2537G mutant. ***p<0.001, two-way ANOVA. Data are mean ± SEM.


