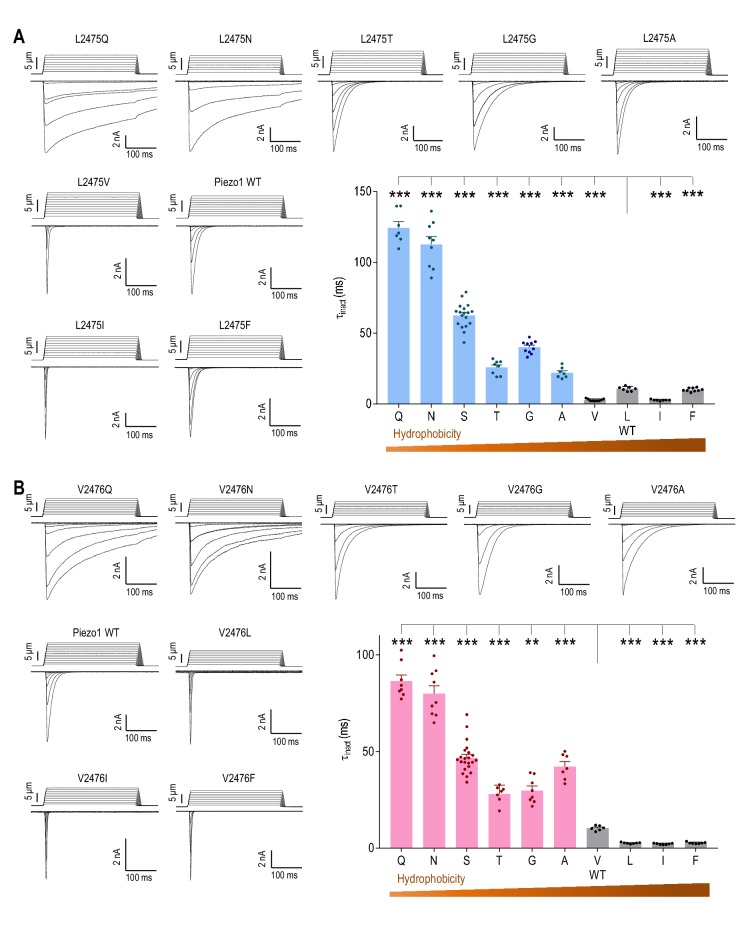
Figure 3. The hydrophobicity of L2475 and V2476 determines the rate of Piezo1 inactivation.
(A and B) Representative whole-cell MA current traces and quantification of MA current inactivation rate (τinact) in HEK293TΔP1 cells expressing Piezo1 with indicated mutations of variable hydrophobicity at L2475 (A, n = 7–18 cells) and V2476 (B, n = 6–22 cells). Ehold = −80 mV. **p<0.01, ***p<0.001, one-way ANOVA with Holm-Sidak’s correction. Data are mean ± SEM.

