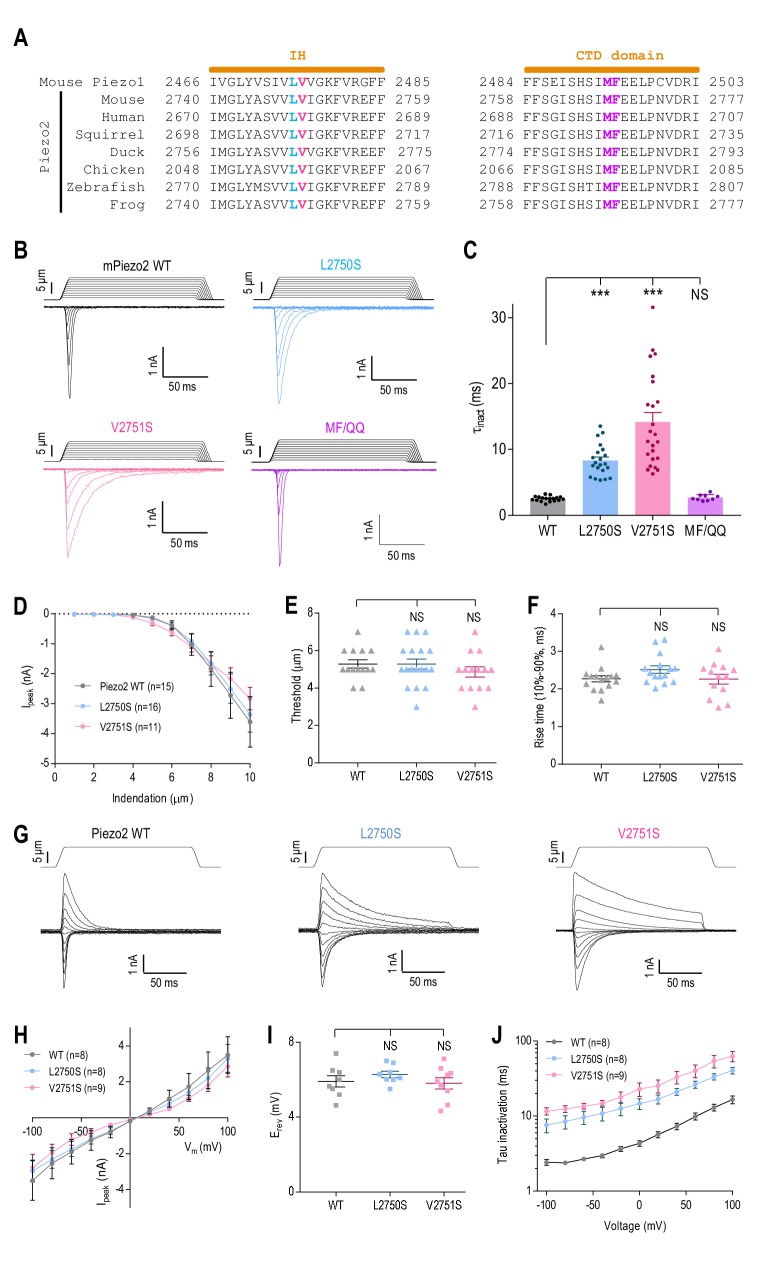
Figure 5. The putative inner helix inactivation gate is functionally conserved in Piezo2.
(A) Amino acid sequence alignments of the IH and part of CTD between mouse Piezo1 and Piezo2 orthologues from indicated species. The conserved L2475 and V2476 residues in the IH are highlighted in blue and red; M2493 and F2494 in the CTD are highlighted purple. (B and C) Representative whole-cell MA current traces of WT and mutant Piezo2 (B), and quantification of MA current inactivation constant (τinact) in HEK293TΔP1 cells (C, n = 9–24 cells). Ehold = −80 mV. Data are mean ± SEM. **p<0.001; NS, not significant, one-way ANOVA with Dunnett’s correction. (D–F) Quantification of peak MA current amplitude (Ipeak) at different indentation depths (D), apparent indentation threshold of MA current activation (E) and MA current rise time (F) for WT and mutant Piezo2 in HEK293TΔP1 cells. Ehold = −80 mV. NS, not significant, p>0.05, one-way ANOVA with Dunnet’s correction. (G and H) Representative current traces (G) and quantification of peak MA current-voltage relationship (H) in response to mechanical indentation at 9 μm for WT or mutant Piezo2, evoked at Ehold ranging from −100 mV to +100 mV, in 20 mV increments. (I) Quantification of the reversal potential (Erev) from current-voltage plots in (H). NS, not significant, p>0.05, one-way ANOVA with Dunnet’s correction. (J) Quantification of MA current inactivation rate for WT or mutant Piezo2 in response to a 9 µm indentation at different voltages. Data are mean ±SEM.

