

Abstract
OBJECTIVE:
Prescription Drug Monitoring Programs (PDMPs) are intended to help reduce prescription drug misuse and opioid overdose, yet little is known about the longitudinal patterns of opioid prescribing that may be associated with mortality. This study investigated longitudinal opioid prescribing patterns among patients with opioid use disorder (OUD) and without OUD in relation to mortality using PDMP data.
METHODS:
Growth modeling was used to examine opioid prescription data from the California PDMP over a 4-year period prior to death or a comparable period ending in 2014 for those remaining from a sample of 7,728 patients (2,576 with OUD, and 5,152 matched non-OUD controls) treated in a large healthcare system.
RESULTS:
Compared to controls, individuals with OUD (alive and deceased) had received significantly more opioid prescriptions, greater number of days’ supply, and steeper increases of opioid dosages over time. For morphine equivalents (ME, in grams), the interaction of OUD and mortality was significant at both intercept (β=10.4, SE=4.4, p<.05) and slope (β=6.0, SE=1.1, p<.001); deceased OUD patients demonstrated the sharpest increase (i.e., an average yearly increment of 7.84 grams over alive patients without OUD) and ended with the highest level of opioids prescribed before they died (i.e., 20.2 grams higher). Older age, public health insurance, cancer, and chronic pain were associated with higher number and dose of opioid prescriptions.
CONCLUSIONS:
Besides the amount of prescriptions, clinicians must be alert to patterns of opioid prescription such as escalating dosage as critical warning signals for heightened mortality risks, particularly among patients with OUD.
Keywords: opioid prescription, PDMP, mortality, opioid use disorder, general healthcare system
Introduction
Escalating rates of opioid use disorder (OUD) and overdose deaths in the United States have become a public health crisis. Opioids were involved in more than 42,000 deaths in 2016, which is five times higher than in 1999 (Centers for Disease Control and Prevention, 2017). To address this public health crisis, considerable efforts are being devoted to better identify risk factors and implement strategies to reduce opioid misuse and mortality.
Prescription drug monitoring programs (PDMPs) are prominent among the major efforts to reduce opioid misuse, diversion, and related morbidity and mortality. PDMPs are state-run electronic databases (U.S. Department of Justice Drug Enforcement Administration, 2016). Although there is variation across states, most PDMPs collect and manage prescription records for controlled substances dispensed by pharmacies. These data provide important information for public health agencies, health systems, and providers on prescribing patterns that can inform clinical practice and public health interventions to prevent substance use disorder. PDMP data can also allow the identification of high-risk patterns of prescription drug use and trends in prescribing patterns. Previous studies have shown that mortality attributable to prescription drugs decreases with declines in the prescribing rates of drugs (Johnson et al., 2014; Rudd et al., 2016). The few existing studies have called for additional investigations of longitudinal prescribing patterns associated with health outcomes, including mortality (Green et al., 2011; Li et al., 2014; Nam et al., 2017; Paulozzi et al., 2011).
In our prior studies based on a sample of 2,576 OUD patients from a large general healthcare system in Los Angeles, California, we found high rates of mortality among OUD patients compared to either the general population (Hser et al., 2017) or a matched sample of 5,152 patients without OUD from the same healthcare system (Liang et al., 2017). Linking individuals’ medical, death, and PDMP records, the present study expands our previous efforts to investigate the longitudinal opioid prescribing patterns among patients with OUD and matched patients without OUD in relation to their mortality.
Methods
Sample
The study included data from 7,728 individuals who had been patients in an academic health center in Los Angeles; data were assembled from an electronic health record (EHR) system utilizing Epic software. Patients (n= 2,576) with OUD were age 18 to 64 at the time of their first OUD diagnosis (as abuse or dependence using International Classifications of Diseases [ICD]-9th Edition-CM codes 304.0x, 304.7x, or 305.5x) during an inpatient or outpatient visit between 2006 to 2014. Patients (n=5,152) who did not have OUD (no abuse or dependence diagnosis) were selected to be matched controls during the same time period. Two controls for each OUD case were selected by the following matching criteria: sex, date of birth (within 3 years), first encounter (within 1 year), and closest cosine similarity by the Elixhauser Comorbidity Index (Elixhauser et al., 1998), which includes 30 patient characteristics associated with hospital mortality.
By 2014, 18% of the OUD patients and 10.4% of the controls were dead (p<.05); the mean age at death was 51.0 (SD= 11.0) among OUD patients and 51.6 (SD= 10.6) among controls, with no difference between the two groups.
Protocols were approved by the Institutional Review Boards at UCLA and the State of California. Data agreements were established, with strict security procedures implemented and followed.
Measures
Data were collected for all patients from the PDMP, mortality records (National Death Index of the Center for Disease Control and Prevention), and medical records (the EHR of the academic health system).
California’s PDMP is called the Controlled Substance Utilization Review and Evaluation System (CURES), maintained by the California Department of Justice (DOJ). CURES is a database of prescription records of Schedule II, III, and IV controlled substance prescriptions dispensed in California. Each prescription record in the PDMP data includes product name, strength, units of measure (number of metric units dispensed), drug formulation (e.g., tablet, transdermal patch, syrup), date filled, days’ supply (estimated number of days the medication will cover) and number of refills. For this study, we included all opioid prescriptions except buprenorphine (as its primary use is for treating OUD). For comparison purposes, the opioid medication was converted to morphine equivalents (ME, in grams) by summing up daily morphine milligram equivalent (MME) per prescription and the number of supply days (National Center for Injury Prevention and Control, 2016) over a year’s time period. Four PDMP outcome measures were considered: number of fills, days of supply, units, and morphine equivalents.
Mortality data, available through the end of 2014, were obtained from the National Death Index (NDI) of the Center for Disease Control and Prevention (CDC). Among the 7,728 patients, 1,002 patients (465 with OUD, 537 controls) passed away. NDI death records include date and cause of death (International Classification of Diseases [ICD-10th revision]) for deaths that occurred as of December 31, 2014.
Covariates were based on medical records. Sociodemographic variables included: sex, race, age, and health insurance. Clinical variables were defined from diagnoses (ICD-9 codes) for physical health or diseases (e.g., cardiovascular disease, cancer, diabetes), substance use disorders (SUDs; tobacco, alcohol, cannabis), and psychiatric or mental health condition (e.g., bipolar disorder, depressive disorder, anxiety disorder). The lists of ICD-9-CM codes utilized in this study have been previously described (Hser et al, 2017a; Hser et al., 2017b) and may be obtained upon request from the corresponding author.
Data analysis
We conducted t-tests (for continuous variables) and chi-square tests (for categorical variables) to examine differences in demographics and diagnoses between patients with OUD versus controls. For longitudinal analysis of opioid prescribing (separately for yearly ME, number of fills, days of supply, units), we used a growth modeling approach (random intercept and random slope models with unstructured covariance structure) to examine group differences by OUD and mortality status at 2014 (and their interaction term), controlling for demographics and physical and mental health conditions. For all participants, 4 years of PDMP data (prior to death, or to a 2014 cutoff for those surviving) were analyzed.
Because not all patients had PDMP records, we conducted sensitivity analyses by applying the same growth models based only on the 5,621 patients who had at least one PDMP record. Because the modeling results (i.e., effects with significance) were similar, we report findings based on the total sample, although the model estimates were generally lower based on the total sample compared to those based on the 5,621 patients who had at least one PDMP.
All statistical tests were based on a significance level of α ≤ .05. Analyses were conducted using SAS 9.4.
Results
Patient Characteristics and Diagnoses
Most study patients were male (60%), white (67%), and most (82%) had private insurance or were designated as self-pay or without insurance (Table 1). Approximately half of the sample had heart disease (52.5%), respiratory disease (49.7%), or mental disorders (57.4%), predominately depression (41.9%).
Table 1.
Demographic Characteristics and Diagnoses (%)
| OUD Patients | Control Patients | Total | |
|---|---|---|---|
| Characteristic | n=2,576 | n=5,152 | n=7,728 |
| Female (%) | 39.9 | 39.9 | 39.9 |
| Ethnicity/race (%)*** | |||
| White | 78.4 | 61.2 | 67.0 |
| Black | 7.6 | 7.7 | 7.7 |
| Hispanic | 2.9 | 4.2 | 3.8 |
| Asian | 1.9 | 6.4 | 4.9 |
| Other/unknown | 9.2 | 20.4 | 16.7 |
| Financial sources (%)*** | |||
| Medicare | 12.5 | 10.4 | 11.1 |
| Medi-Cal | 10.1 | 5.3 | 6.9 |
| Commercial health plans | 19.7 | 34.8 | 29.8 |
| Self-pay/other | 57.7 | 49.5 | 52.2 |
| Physical health and disease (%) | |||
| Heart disease | 53.3 | 52.1 | 52.5 |
| Respiratory disease | 49.7 | 49.7 | 49.7 |
| Sleep disorder | 16.5 | 16.9 | 16.8 |
| Liver disease | 20.0 | 18.3 | 18.8 |
| Cancer | 14.1 | 13.0 | 13.3 |
| Diabetes | 13.1 | 12.8 | 12.9 |
| Sexually Transmitted Disease | 1.1 | 1.1 | 1.1 |
| HIV** | 2.3 | 1.3 | 1.6 |
| HCV*** | 22.2 | 9.8 | 13.9 |
| Chronic pain*** | 63.2 | 50.4 | 54.7 |
| Mental disorders (%)*** | 65.3 | 53.5 | 57.4 |
| Psychotic disorder*** | 10.2 | 7.6 | 8.5 |
| Bipolar disorder*** | 12.3 | 6.2 | 8.3 |
| Depression disorder*** | 44.7 | 40.6 | 41.9 |
| Anxiety disorder*** | 32.3 | 25.9 | 28.0 |
| Other mental disorder*** | 33.9 | 22.3 | 26.2 |
| Other substance use disorders (%) | |||
| Tobacco use disorder*** | 19.6 | 7.6 | 11.6 |
| Alcohol use disorder*** | 25.7 | 20.4 | 22.1 |
| Cannabis use disorder*** | 10.8 | 4.1 | 6.3 |
| Amphetamine use disorder*** | 11.2 | 1.9 | 5.0 |
| Cocaine use disorder*** | 13.2 | 2.8 | 6.3 |
| Hallucinogen use disorder*** | 2.8 | 0.3 | 1.2 |
P<0.05,
P<0.01,
P<0.001
While the controls were selected by many variables matched with OUD patients, the two groups still differed significantly in several aspects (Table 1). For example, more OUD patients were white (78.4% vs. 61.2%, p<.001) and had public health insurance (e.g., 10.1% vs. 5.3% with Medi-Cal, and 19.7% vs. 34.8% with commercial health plans) compared to the control patients. The OUD patients also had significantly higher rates of physical health conditions (e.g., HIV [2.3% vs. 1.3%, p<.01], HCV [22.2% vs. 9.8%, p<.001], and chronic pain [63.2% vs. 50.4%, p<.001]), mental disorders (65.3% vs. 53.5%, p<.001), and other substance use disorders, particularly amphetamine use (11.2% vs. 1.9%, p<.001), cocaine use (13.2% vs. 2.8%, p<.001) and tobacco use (19.6% vs. 7.6%, p<.001) disorders.
Longitudinal Opioid Prescribing Patterns
Figure 1 displays the plot of the longitudinal opioid prescribing patterns (yearly, over the past 4 years) for the four outcome measures, by the four groups defined by OUD (yes vs. no) and death at the end of 2014 (yes vs. no). We examined the group differences in opioid prescribing by using ME at the end or the last year of the observation period (i.e., before death or prior to 2014). Both the main effects of dead vs. alive (p<0.001) and OUD vs. non-OUD (p<0.001) and the interaction term of the two (p=0.03) were statistically significant. Patients in the deceased OUD group were receiving an average of 87.1 morphine milligram equivalents (MME) per day prescribed by doctors, as captured in the PDMP system, which is in contrast to 52.2 MME for alive patients with OUD; among the non-OUD group the deceased patients received 19.8 MME and the alive patients received 8.6 MME.
Figure 1.
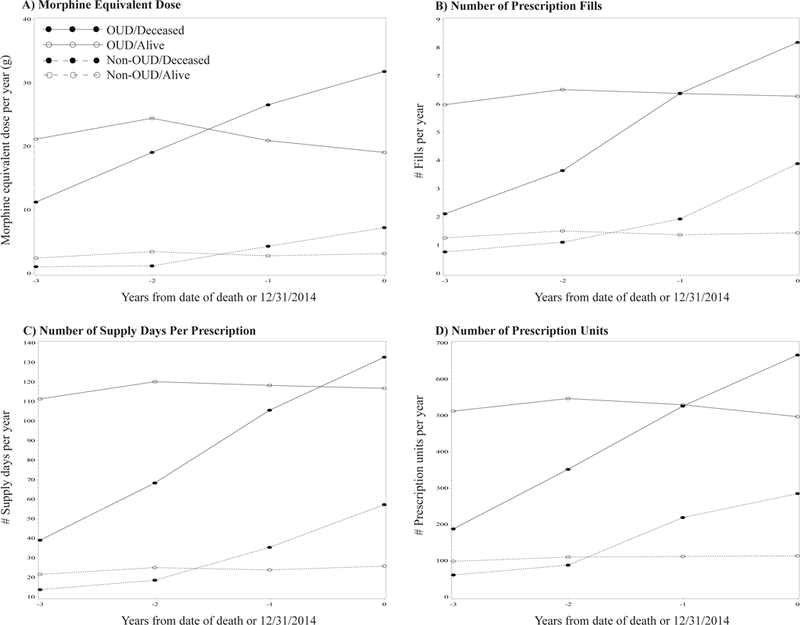
Longitudinal opioid prescribing patterns by OUD diagnosis and mortality status (N=7,726)
Modeling results for the four outcome measures are presented in Table 2. Consistent with the other three outcome measures, individuals with OUD (vs. controls) and those dead (vs. alive) had significantly higher levels of opioid prescription (as ME) at death or 2014, as well as higher escalating rates over the 4 years. For ME, the interaction term of OUD and mortality was also significant at both intercept (β=10.4, SE=4.4, p<.05) and slope (β=6.0, SE=1.1, p<.001); among the four groups, opioid patients who were dead by 2014 demonstrated the sharpest increase of opioid prescription over time, ending at the highest level of opioid prescription (as ME) at death. Compared to the alive non-OUD patients, the deceased OUD patients had used 20.2 more ME grams at the end of observation year (i.e., the death year for deceased patients or at the last observation year for alive patients). The increase of ME dose over the four years of observation period among the deceased OUD patients was 7.84 (grams per year) higher than that among the alive non-OUD patients.
Table 2.
Growth Curve Model of Opioids Prescription Per Year (N=7,726)
| Morphine Equivalent Dose | No. of fills | No. of supply days | No. of units | |||||||||
|---|---|---|---|---|---|---|---|---|---|---|---|---|
| Est | SE | Est | SE | Est | SE | Est | SE | |||||
| Intercept | −7.6 | 3.1 | * | −2.6 | 0.4 | *** | −58.2 | 7.6 | *** | −245.9 | 43.6 | *** |
| OUD (vs. non-OUD) | 14.9 | 1.8 | *** | 4.4 | 0.2 | *** | 84.2 | 4.4 | *** | 355.4 | 25.0 | *** |
| Death (vs. alive) | 2.5 | 3.0 | 1.9 | 0.4 | *** | 25.7 | 7.5 | *** | 144.5 | 42.7 | *** | |
| OUD * Death | 10.4 | 4.4 | * | 0.02 | 0.6 | −8.7 | 11.0 | 15.5 | 62.5 | |||
| Age at death or 12/31/2014 (year) | 0.1 | 0.1 | * | 0.04 | 0.01 | *** | 0.9 | 0.1 | *** | 4.0 | 0.9 | *** |
| Female (vs. male) | 2.4 | 1.5 | 0.7 | 0.2 | *** | 14.4 | 3.8 | *** | 61.4 | 21.7 | ** | |
| Race/ethnicity (vs. white) | ||||||||||||
| Black | −2.2 | 2.8 | 0.9 | 0.4 | * | 9.5 | 7.0 | 41.1 | 39.7 | |||
| Hispanic | −4.5 | 3.9 | −0.4 | 0.5 | −7.2 | 9.7 | −71.4 | 55.2 | ||||
| Asian | −4.2 | 3.5 | −0.7 | 0.5 | −11.9 | 8.6 | −74.4 | 49.0 | ||||
| Other | −1.2 | 2.1 | 0.5 | 0.3 | 7.9 | 5.2 | 14.5 | 29.4 | ||||
| Public insurance (vs. private insurance) | 12.2 | 2.0 | *** | 3.2 | 0.3 | *** | 56.9 | 5.0 | *** | 252.2 | 28.5 | *** |
| Cancer (vs. no cancer) | 7.3 | 2.3 | *** | 1.0 | 0.3 | *** | 20.0 | 5.6 | *** | 151.0 | 32.2 | *** |
| Chronic pain (vs. no chronic pain) | 6.2 | 1.6 | *** | 2.2 | 0.2 | *** | 40.8 | 3.9 | *** | 182.5 | 22.4 | *** |
| Any psychiatric disorder (vs. none) | −0.8 | 1.6 | 0.5 | 0.2 | * | 8.9 | 3.9 | * | 29.3 | 22.4 | ||
| Any other substance use disorder (vs. none) | −1.0 | 1.6 | −0.1 | 0.2 | −6.6 | 4.1 | −35.4 | 23.3 | ||||
| Slope (year) | 1.2 | 0.8 | −0.03 | 0.1 | 1.4 | 2.4 | 10.9 | 13.1 | ||||
| Interaction with slope (year) | ||||||||||||
| OUD (vs. non-OUD) | −1.3 | 0.4 | ** | 0.03 | 0.1 | 0.1 | 1.3 | −13.1 | 7.5 | |||
| Death (vs. alive) | 1.8 | 0.7 | * | 1.0 | 0.1 | *** | 13.8 | 2.3 | *** | 75.6 | 12.8 | *** |
| OUD * Death | 6.0 | 1.1 | *** | 1.0 | 0.2 | *** | 16.9 | 3.4 | *** | 93.6 | 18.8 | *** |
| Age at death or 12/31/2014 (year) | −0.02 | 0.01 | −0.001 | 0.003 | −0.05 | 0.05 | −0.3 | 0.3 | ||||
| Female (vs. male) | −0.04 | 0.4 | 0.02 | 0.1 | 0.9 | 1.2 | 4.1 | 6.5 | ||||
| Race/ethnicity (vs. white) | ||||||||||||
| Black | −1.5 | 0.7 | * | 0.1 | 0.1 | 1.2 | 2.1 | −6.7 | 11.9 | |||
| Hispanic | −0.4 | 1.0 | 0.1 | 0.2 | 1.1 | 3.0 | −9.0 | 16.6 | ||||
| Asian | −0.8 | 0.8 | −0.02 | 0.1 | −0.9 | 2.6 | −8.3 | 14.7 | ||||
| Other | −0.5 | 0.5 | 0.1 | 0.1 | 0.8 | 1.6 | 0.01 | 8.8 | ||||
| Public insurance (vs. private insurance) | 0.1 | 0.5 | 0.1 | 0.1 | 1.7 | 1.5 | 12.6 | 8.6 | ||||
| Cancer (vs. no cancer) | 1.3 | 0.6 | * | 0.1 | 0.1 | 2.4 | 1.7 | 17.9 | 9.7 | |||
| Chronic pain (vs. no chronic pain) | 0.3 | 0.4 | 0.1 | 0.1 | 2.5 | 1.2 | * | 11.4 | 6.7 | |||
| Any psychiatric disorder (vs. none) | −0.1 | 0.4 | 0.02 | 0.1 | −0.6 | 1.2 | −4.1 | 6.7 | ||||
| Any other substance use disorder (vs. none) | −0.2 | 0.4 | −0.04 | 0.1 | −1.0 | 1.3 | −4.1 | 7.0 | ||||
| AIC | 315484.4 | 198497.0 | 375376.4 | 484635.5 | ||||||||
| BIC | 315512.2 | 198524.8 | 375404.2 | 484663.3 | ||||||||
P<0.05,
P<0.01,
P<0.001
Several demographic characteristics and health conditions also varied according to differences in opioid prescribing patterns: older individuals, public health insurance, and those with cancer or chronic pain generally had higher rates of opioid prescriptions and larger dosages
Discussion
The study results revealed that patients with OUD in our sample received more opioid prescriptions and were prescribed opioids at higher doses than controls, and that higher levels of opioid prescription were associated with greater mortality risk. Moreover, the most striking and clinically relevant finding from this study is that escalating prescribing patterns were associated with heightened mortality risk for both OUD patients and controls, significantly more so among the OUD patients. For example, deceased OUD patients were receiving opioid prescriptions at a yearly increment of 7.84 ME grams greater than those received by non-OUD alive patients, ending with an average of 87.1 MME per day (relative to 8.6 to 52.2 MME in other groups) in the last year of observation, as captured in the PDMP system; other potential sources of prescription and non-prescription opioids (e.g., illicitly obtained opioids, heroin use) could not be ascertained. Additionally, patients with older age, public health insurance, and cancer or chronic pain were more likely to have received more opioid prescriptions over the four years of the observation period.
The study had several limitations. The first limitation is that the California PDMP system does not include opioid prescriptions for all patients; exclusions include, for example, the Veterans Affairs (until recently), military, inpatient hospitals settings, methadone clinics, out-of-state pharmacies, and Internet sources. Approximately 72.8% of the study sample had a record in the California PDMP database. In this article, we have reported our results based on the total sample given that sensitivity analyses based on those who had at least one record in the PDMP system showed similar patterns of significant effects. However, the reported modeling estimates should be considered conservative given that they are generally lower than those based on the sample with at least one PDMP.
Another limitation is that the study is based on patients seen in a single health system serving predominantly white patients living in the Los Angeles area of the United States, which may limit the study’s generalizability. Our findings are also dependent on the extent, accuracy, and validity of the data available in the EHR and PDMP datasets. For example, routine screening for SUDs is not standardized or mandatory in the health system, leaving room for undercounts of SUDs and inconsistent documentation of these conditions, particularly in cases of less severe disorders.
While we have used a matched control study design, causality underlying the observed findings in this study cannot be ascertained. For example, it may be that end–of-life palliative care leads to escalating opioid prescribing for comfort and not that escalating opioid prescribing leads to mortality. Relative to non-OUD patients, OUD patients had higher rates of chronic pain (63.2% vs. 50.4%) but equivalent rates of cancer (13.0% to 14.0%). In our previous study (Liang et al., 2017) on causes of death among this sample, cancer deaths accounted for similar percentages of death (16.8% vs. 16.9% of all deaths) among patients with or without OUD, while overdose deaths were much higher among OUD patients (16.8%) than non-OUD patients (3.2%). Therefore, end-of-life care cannot entirely account for the observed association between mortality and escalating opioid prescribing, particularly among OUD patients. Factors associated with rising rates of opioid prescriptions and increasing dosages in the OUD group, including co-prescribing of other central nervous system depressants (e.g., benzodiazepines), other substance use, and medical comorbidities were not addressed in this analysis but warrant further study. Future studies may also examine the role of provider specialty and setting (e.g., primary care, pain clinics) in opioid prescribing patterns associated with mortality.
The present study has several strengths. Foremost, this is the first study that has linked patient medical records, medication prescription records, and mortality to investigate longitudinal opioid prescribing patterns among OUD and non-OUD patients in relation to mortality. Another important strength is that in the examination of the relationship between opioid prescribing patterns and mortality, the study controlled for patient severity of physical and mental conditions by (1) using a matched control sample and (2) incorporating them as covariates in the model. Given the current crisis of OUD and overdose deaths in the United States and urgent needs to better understand the prescribing patterns and patient characteristics in relation to mortality, our findings have important implications for improved policy and clinical practice addressing this public health issue.
The study findings revealed higher rates and doses of opioid prescription among individuals with OUD, relative to non-OUD controls. Most significant is that mortality risks are associated with escalating patterns of opioid prescription regardless of whether the patients had OUD or not. Providers treating patients with OUD need to be alerted to escalating opioid prescribing patterns in light of the finding that the deceased OUD patients demonstrated the sharpest escalation of number of opioid prescriptions and total dosage. To facilitate clinical application, an evolution in the summary and visualization of patient PDMP records should be provided.
There is increasing recognition of the importance of using PDMPs as critical tools for supporting clinical decision-making and for decreasing the risk of multiple prescribers and overdoses. This study also confirms the great value of using PDMP data to advance scientific knowledge as demonstrated in other studies (Sajid et al., 2016; Worley, 2012). For example, by routinely incorporating PDMP data into diagnostic and medical care, these data can be useful for predicting and/or corroborating clinical diagnoses, gauging treatment responses, and monitoring treatment outcomes (Sajid et al., 2016).
Conclusions
The Prescription Drug Monitoring Programs offer important resources useful for monitoring physician and patient behaviors to determine potentially unsafe prescription and usage patterns. The database can also be used to identify patients at risk for misuse and related adverse consequences based on prescriptions received for opioids and other drugs. In addition to high levels of opioid prescriptions, clinicians need to pay special attention to escalating patterns of prescription dosage, which can be a critical warning signal for heightened mortality risks, particularly among OUD patients.
Acknowledgments:
Sincere appreciation to UCLA CareConnect, UCLA Clinical and Institutional Science Institute (CTSI), EMMES Corporation NIDA Data and Statistics Center (DSC), the Center for Clinical Trials Network (CCTN), and the National Institute on Drug Abuse. Special thanks are due to Department of Justice, California Prescription Drug Monitoring Program.
Funding source:
This project has been funded in part with federal funds from the National Institute on Drug Abuse (NIDA), National Institutes of Health, Department of Health and Human Services, under contract HHSN271201400028C. Additional funding was provided by the National Center for Advancing Translational Science (NCATS) through grant number UL1TR001881 to the UCLA CTSI.
Footnotes
Declaration of Interest: Authors disclosing relevant financial interests, activities, relationships, and affiliations are:
Andrew J. Saxon: receives royalties as a section editor for UpToDate.
All other authors report no financial or other possible conflicts of interest.
References
- Centers for Disease Control and Prevention. Opioid overdose: Drug Overdose deaths. 2017. Available at: https://www.cdc.gov/drugoverdose/data/statedeaths.html. Accessed November 26, 2017.
- Elixhauser A, Steiner C, Harris DR, Coffey RM. Comorbidity measures for use with administrative data. Medical Care 1998; 36(1): 8–27. [DOI] [PubMed] [Google Scholar]
- Green TC, Zaller N, Rich J, Bowman S, Friedmann P. Revisiting Paulozzi et al.’s Prescription drug monitoring programs and death rates from drug overdose. Pain Medicine 2011; 12(6): 982–985. [DOI] [PubMed] [Google Scholar]
- Hser Y-I, Mooney LJ, Saxon AJ, et al. High mortality among patients with opioid use disorder in a large healthcare system. Journal Of Addiction Medicine 2017; 11(4): 315–319. [DOI] [PMC free article] [PubMed] [Google Scholar]
- Hser Y-I, Mooney LJ, Saxon AJ, Miotto K, Bell DS, Huang D. Chronic pain among patients with opioid use disorder: Results from electronic health records data. Journal Of Substance Abuse Treatment. 2017; 77 26–30. [DOI] [PMC free article] [PubMed] [Google Scholar]
- Johnson H, Paulozzi L, Porucznik C, Mack K, Herter B. Decline in drug overdose deaths after state policy changes - Florida, 2010–2012. MMWR. Morbidity and Mortality Weekly Report 2014; 63(26): 569–574. [PMC free article] [PubMed] [Google Scholar]
- Li G, Brady JE, Lang BH, Giglio J, Wunsch H, DiMaggio C. Prescription drug monitoring and drug overdose mortality. Injury Epidemiology 2014; 1(1): 9. [DOI] [PMC free article] [PubMed] [Google Scholar]
- Liang D, Bell D, Follett R, et al. The association between opioid use disorder and death in a general healthcare system: a matched control study. In 2017. CALDAR Summer Institute And International Conference Promoting Global Health 2017 J Neuroimmune Pharmacol 12(Suppl 2): 81 10.1007/s11481-017-9751-8 [DOI] [PubMed] [Google Scholar]
- Nam YH, Shea DG, Shi Y, Moran JR. State prescription drug monitoring programs and fatal drug overdoses. American Journal Of Managed Care 2017; 23(5): 297–303. [PubMed] [Google Scholar]
- National Center for Injury Prevention and Control. CDC compilation of benzodiazepines, muscle relaxants, stimulants, zolpidem, and opioid analgesics with oral morphine milligram equivalent conversion factors. 2016. Available at: http://www.pdmpassist.org/pdf/BJA_performance_measure_aid_MME_conversion.pdf. Accessed August 24, 2017
- Paulozzi LJ, Kilbourne EM, Desai HA. Prescription drug monitoring programs and death rates from drug overdose. Pain Medicine 2011; 12(5): 747–754. [DOI] [PubMed] [Google Scholar]
- Rudd RA, Aleshire N, Zibbell JE, Gladden RM. Increases in drug and opioid overdose deaths--united states, 2000–2014. MMWR. Morbidity and Mortality Weekly Report. 2016; 64(50–51): 1378–1382. [DOI] [PubMed] [Google Scholar]
- Sajid A, Whiteman A, Bell RL, Greene MS, Engleman EA, Chambers RA. Prescription drug monitoring program data tracking of opioid addiction treatment outcomes in integrated dual diagnosis care involving injectable naltrexone. American Journal On Addictions 2016; 25(7): 557–564. [DOI] [PMC free article] [PubMed] [Google Scholar]
- U.S. Department of Justice Drug Enforcement Administration. Prescription drug monitoring programs. 2016. Available at: https://www.deadiversion.usdoj.gov/faq/rx_monitor.htm. Accessed June 27, 2018
- Worley J Prescription drug monitoring programs, a response to doctor shopping: purpose, effectiveness, and directions for future research. Issues In Mental Health Nursing 2012; 33(5): 319–328. [DOI] [PubMed] [Google Scholar]