Abstract
Oxytocin (OT) is a neurohormone that has gained interest recently due to its emerging role in cognition and social/emotional behaviors including possibly depression and autism. OT is commonly measured using enzyme- or radio-based immunoassays (RIA, ELISA), which lack specificity or are complicated to perform and involve hazardous radioactive material. We developed a high resolution accurate-mass (HRAM) liquid chromatography mass spectrometry (LCMS) method that separates interferences and selectively and accurately quantitates native OT from human serum, urine, and saliva after solid phase extraction. The doubly protonated OT ion m/z 562.25503 was selected for quantitation due its high signal intensity. With our method LLOD of 5–25 pg/mL, we measured native OT in serum from pregnant women (16–24 pg/mL) and rats (350 pg/mL), and in serum, urine, and saliva from a healthy male after intranasal (IN) OT application of 100 IU and 20 IU and from a healthy post-menopausal female after IN OT application of 100 IU. Peak levels were detected in serum, urine, and saliva 15–30 minutes after each dose then decreased to below detection limits 1–2 hours thereafter. We were unable to detect native OT in serum from non-pregnant/non-lactating/non-medicated women due to levels known to occur below 5 pg/mL. The fast elimination of OT we found is in excellent agreement with other studies OT’s pharmacokinetics. The effects on the central nervous system occurring after IN OT administration remains to be determined.
Keywords: Oxytocin, traditional orbitrap LCMS, serum, urine, saliva, underivatized
Graphical Abstract
We developed a high resolution accurate-mass LCMS method that separates interferences and selectively and accurately quantitates native OT from human serum, urine, and saliva after extraction. Native OT levels in cord plasma and serum/plasma from non- pregnant/non-lactating/non-medicated subjects were <10 pg/mL. Extremely high levels in saliva were found after intranasal OT administration of 20 – 100 IU. Peak levels were detected in serum, urine, and saliva 15–30 minutes after each dose then decreased to below detection limits 1–2 hours thereafter.
Introduction
Oxytocin (OT) is a neuropeptide synthesized by magnocellular neurons of the hypothalamus where it is released into the central nervous system (CNS) and peripheral circulation [1]. OT is well known for its roles in pregnancy, parturition, and lactation and more recently believed to foster prosocial behaviors such as trust and affiliation between individuals, and modulating fear and anxiety [2,3]. To better understand the roles of OT in humans, reliable and sensitive methods are needed to accurately quantitate OT in biological fluids.
OT is commonly measured by radio- or enzyme- based immunoassays (RIA, EIA/ELISA); [4–6] however, these methods involve hazardous radioactive material and/or lack the specificity and sensitivity to accurately quantitate the very low native levels in non-pregnant/non-lactating/non-medicated mammals [7]. This is due to matrix interferences, which can be largely removed by solid phase extraction (SPE) [7] and liquid chromatography mass spectrometry (LCMS) but requires high resolution accurate-mass (HRAM) capabilities to provide the high selectivity and sensitivity needed for accurate OT quantitation.
Matrices such as serum, plasma, and recently saliva [8] are often assayed as a surrogate for CNS OT activity in humans due to safety concerns connected with collection of cerebrospinal fluid (CSF) or brain tissue [6]. Urine and saliva are preferred matrices for OT analysis due to their non-invasive collection methods [5] but their still unclear correlation to CSF and brain tissue levels needs to be evaluated [8] owing to the controversial views on the relationship between central activity and/or CSF levels (which may not reflect local brain levels) and peripheral OT levels [9–11].
In the current study, we aimed to develop a HRAM orbitrap-based LCMS method to accurately measure native OT in human serum, urine, and saliva after SPE.
Methods
Chemicals and reagents
OT was purchased from Sigma-Aldrich (St. Louis, MO). OT-leucyl-d3-glycinamide-d2 (OT-d5) was used as an internal standard (IS) and purchased from Medical Isotopes (Pelham, NH). Formic acid (FA), phosphoric acid, and all organic high performance liquid chromatography (HPLC) grade solvents including acetonitrile (ACN) and methanol (MeOH) were obtained from Thermo Fisher Scientific (Waltham, MA).
Sample collection
Deidentified pooled serum from non-pregnant/non-lactating/non-medicated premenopausal women (n=12) who participated in a previous intervention study were obtained from Dr. Gertraud Maskarinec from the University of Hawaii Cancer Center (UHCC). Deidentified serum samples from healthy pregnant women (n=4; gestational age 21–36 weeks) and umbilical cord/maternal EDTA-plasma (n=3) obtained after planned cesarean section and collected for unrelated studies after delivery were provided by Dr. Patrick Sluss from Harvard University and by Dr. Men-Jean Lee from Kapiolani Medical Center for Women and Children, respectively, for method development purposes. Pooled Sprague-Dawley rat serum was purchased from Abcam (Cat no. ab7488). In addition, serum, urine, and saliva were obtained from a healthy male volunteer and saliva and urine were obtained from a healthy post-menopausal female volunteer, both extremely experienced health professionals, before (baseline) and after intranasal (IN) OT administration. The male volunteer self-administered IN OT on two occasions using OxyLuv (obtained online at: http://www.pherluv.com/index.php/oxytocin-nasal-spray); this brand was chosen due to its easy online availability that allowed non-regulated ordering. On the first occasion the male volunteer administered 100 IU (5 puffs per nostril, 10 IU per puff) alternating nostrils and waiting approximately 10 seconds between puffs. After administration, serum was collected by a licensed phlebotomist employed at the UHCC, and urine and saliva samples were self-collected at baseline and 15, 30, 60, and 120 minutes thereafter. Additional urine and saliva samples were self-collected at 180 and 240 minutes post administration. On the second occasion following a one week washout, 20 IU (1 puff per nostril, 10 IU per puff) was self-administered and saliva samples were collected at baseline and 15, 30, 60, 120, and 180 minutes post administration. The female volunteer self-administered 100 IU OT intranasally (1 puff per nostril, 50 IU per puff) using a metered dose OT spray formulated by Voshell’s compounding pharmacy (Baltimore, MD; https://www.voshellspharmacy.com/compounding); urine and saliva samples were self-collected at baseline and 15, 30, 60, and 120 minutes post administration. Serum, urine, and saliva samples from each timed interval were collected in one container then aliquoted into 1 mL (serum), 10 mL (urine), or 1 mL (saliva) aliquots with no preservatives then immediately frozen at −80°C until analyzed. All samples were thawed on the day of analysis. All specimen collections were IRB approved by the University of Hawaii Human Studies Program.
Standards and calibration
For urine and saliva analysis, working stock solutions of OT (10 ng/mL in water) and OT-d5 (50 ng/mL in MeOH) were prepared fresh weekly. Calibration standards (1–1000 pg/mL) were prepared by serial dilution in water. For serum, working stock solutions of OT and OT-d5 (both at 100 ng/mL in MeOH/water 1/1, v/v) were prepared fresh weekly. Calibration standards (0.94 – 100 ng/mL) were prepared by serial dilution in water. Urinary creatinine levels were determined using a clinical autoanalyzer (Roche-Cobas MiraPlus) and a kit from Randox Laboratories (cat no. CR 510, Crumlin, UK) based on the Jaffé reaction. Urinary concentrations were adjusted for creatinine levels to account for differences in urine volume.
Sample preparation
Five hundred µL serum were mixed with 10 µL OT-d5 (10 ng/mL in MeOH) then acidified with 600 µL 4% aq. phosphoric acid. Urine was centrifuged at 13,000 x g for 5 minutes. One mL of the supernatant was mixed with 20 µL OT-d5 (50 ng/mL in MeOH) then acidified with 600 µL 4% aq. phosphoric acid followed by mixing and incubating at room temperature in the dark for 15 minutes to release the native OT from the matrix. Saliva was centrifuged at 13,000 x g for 5 minutes and 500 µL of the supernatant were mixed with 10 µL OT-d5 (50 ng/mL in MeOH) then acidified with 600 µL 4% aq. phosphoric acid followed by mixing and incubation in the dark for 15 minutes to release the native OT from the matrix.
Solid phase extraction (SPE)
The above prepared serum, urine, and saliva mixtures were purified and concentrated by SPE as described previously [12] prior to LCMS analysis with slight alterations as described below. Mixtures were vortexed at 2000 rpm for 30 seconds then loaded onto a Sep-Pak C18 SPE 50 mg 1cc (Waters, Milford, MA) preconditioned with 1 mL MeOH and 1 mL water by gravity.
For serum, SPE cartridges were washed (500 µL) by gravity first using 1% aq. phosphoric acid then using 5% aq. ACN. The analytes were eluted (1 mL) with 60% aq. ACN then dried under a nitrogen flow at 50oC until the volume was reduced to 100–150 µL. 50 µL were injected into the LCMS system. For urine and saliva, cartridges were washed 5 times (1 mL) by gravity with the first wash using 1% aq. phosphoric acid, the second wash using 0.1% FA in 5% aq. ACN, and the last 3 washes using 10%, 15%, and 20% aq. ACN, respectively. The analytes were eluted 4 times by gravity (500 µL) by gravity; 25% aq. ACN was used for the first 3 elutions and 40% aq. ACN for the last elution. Each fraction (50 µL) was injected separately and directly for LCMS analysis without concentration.
OT analysis by HRAM orbitrap-based LCMS
LCMS analysis of OT was performed using an Accela HPLC system coupled with a Q-Exactive orbitrap mass spectrometer, which were controlled by Xcalibur software (Thermo Scientific, Waltham, MA). Chromatography was performed with a Kinetex C18 column (150 × 3 mm, 2.6 µm, Phenomenex, Torrance CA) with a Phenomenex UHPLC C18 pre-column (3.0 mm i.d).
The mobile phase consisted of 0.1% FA in water (A) and 0.1% formic acid in ACN (B) operated at a flow rate of 250 µl/minute with the following linear gradient (%B): holding at 5% for 1 minute, increase to 25% in 9 minutes, then to 80% in 1 minute, maintain at 80% for 1 minute, then switch to 5% in 0.1 minute, and equilibrate at this ratio for 5 minutes.
The Orbitrap MS was operated in positive heated ESI mode with targeted SIM scan with a spray voltage at 4.5 kV, capillary temperature of 320°C and in-source CID of 5eV. The AGC target was set at 1e5 and isolation window 1.0 m/z. The divert valve was open to the MS from 4.37 to 8.38 minutes to avoid excess interferences. Quantification of the analytes was set within 3–5 ppm of the theoretical monoisotopic masses (OT+2H+ 504.22551; OTd5+2H+ 506.74120; OT-R/A+2H+ 562.25503; OT-R/A-d5+2H+ 564.77049).
The mass resolution of our Q-Exactive MS was operated at 70,000 (FWHM) at m/z 200. At m/z 504.22551, retention time was 7.63 min (OT+2H+) and at m/z 506.74120, retention time was 7.62 min (OTd5+2H+). We measured an effective resolution of approximately 50,000, which was sufficient to resolve interferences that became apparent when a mass tolerance window of ≥ 8 ppm was applied.
Stability experiments
Human urine and water were spiked identically with both OT and OT-d5 at final concentrations of 9.9, 24.8, 154 and 385 ng/mL and kept at 10OC for variable times to determine the stability of OT over time. These concentrations are 1–50 times higher than native levels in rodent blood (300–500 pg/mL) and were chosen because a rapid degradation was expected to occur. In another experiment, neat and diluted human urine were spiked with OT and OT-d5 (final OT concentration 385 ng/mL and 154 ng/mL) then kept at 110°C for 5 minutes to determine the effect of potential urinary interferences on OT stability. Human serum was incubated at room temperature (~23°C) and 4°C for 24 hours and OT levels after incubation were compared to pre-incubation levels to determine the effect of temperature on OT stability.
Results
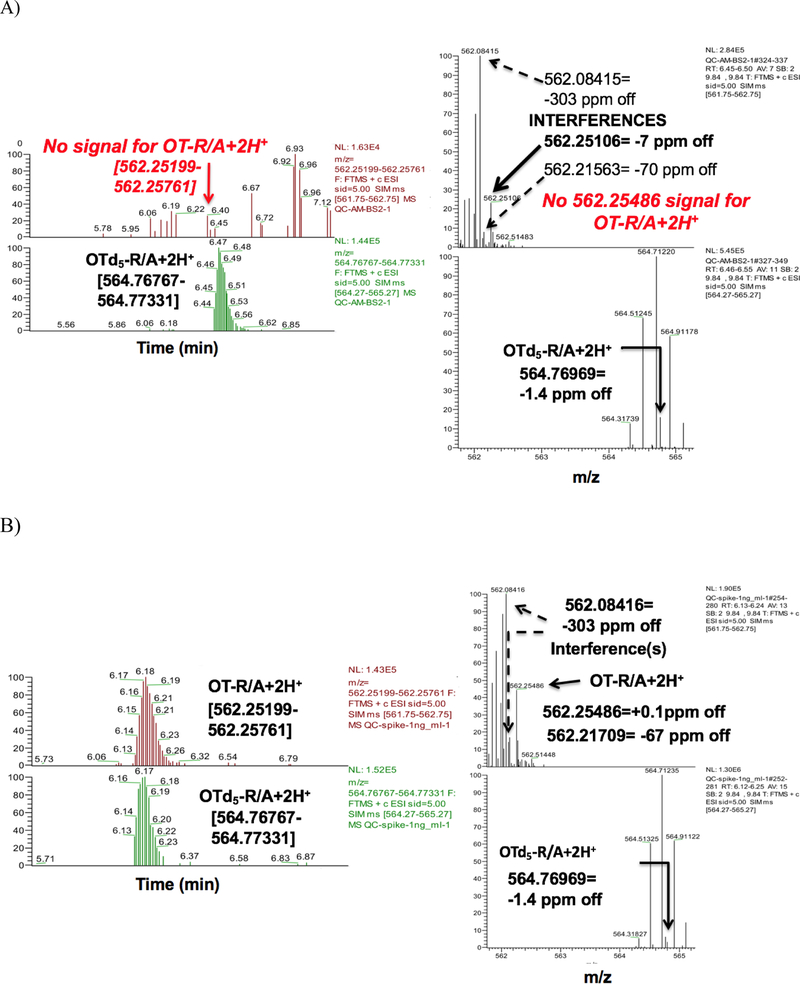
Initially we followed a recently published method measuring reduced and alkylated ‘total OT’ (OT-R/A) [13] by applying a ±8 ppm mass window in our HRAM orbitrap based LCMS system to determine total OT levels in serum from non-pregnant/non-lactating/non-medicated humans. Using this approach we applied a Hypersil Gold C18 (50×3 mm, 3μm) column, which could retain OT and OT-R/A and detect a signal that was within the reported OT range of 500–1200 pg/mL. However, our results had very poor and inconsistent repeatability with broad peak widths and instable retention times (data not shown). After narrowing the mass window to ±3–5 ppm in our LCMS system, we were no longer able to detect any native OT-R/A (Figure 1A, top left panel). Instead, we observed many interferences with masses very similar to the monisotopic OT-R/A mass (Figure 1A, top right panel). OT-R/A was accurately detected only after spiking with OT standards (Figure 1B bottom panels) down to a final concentration of 5 or 10 pg/mL, our method lower limit of detection (LLOD) for neat standards or serum (data not shown).
Figure 1.
Orbitrap LCMS traces of reduced and alkylated oxytocin (OT-R/A) in serum from non-pregnant/non-lactating women without spiking (A) and after spiking with 1 ng/mL OT (B) and applying a 3–5 ppm mass window monitoring in targeted SIM mode
In light of these observations, we developed the current method to measure native, underivatized OT in human serum, saliva, and urine. Analysis was performed using HRAM LCMS and applying a mass window of ±3–5 ppm. A C18 SPE (Sep Pak) was utilized for analyte concentration and purification and additional washing steps (5 total) with increasing ACN proportions (see Methods, SPE section) were performed, which resulted in more OT/OT-d5 being retained on the stationary column. We applied a Kinetex C18 column (150 × 3.0 mm, 2,6 μm), which resulted in sharper peaks with improved retention stability and higher resolution due to core-shell technology and selected the doubly protonated OT ion m/z 562.25503 for MS quantitation due its high signal intensity, which ensured an unambiguous OT signal. This method revealed an intra-day precision of 2–23% and 0% and accuracy of 66~91% and 108~109% at 47.6 and 90.9 pg/mL, respectively. The LLOD was 5 pg/mL for neat standards, 10 pg/mL for serum and saliva, and 25 pg/mL for urine.
Serum, urinary, and salivary OT
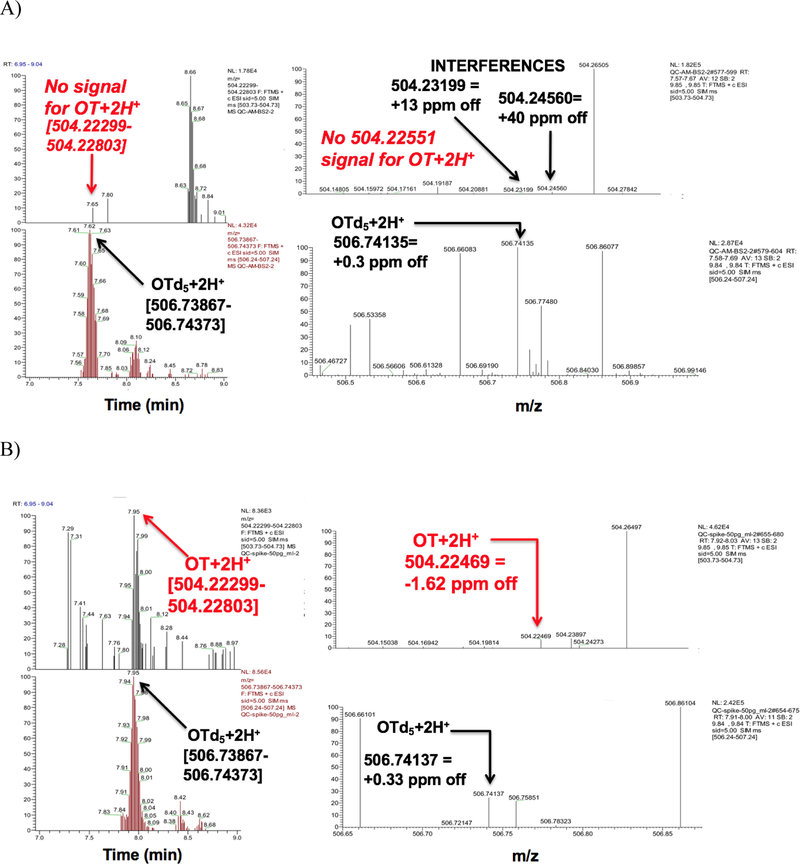
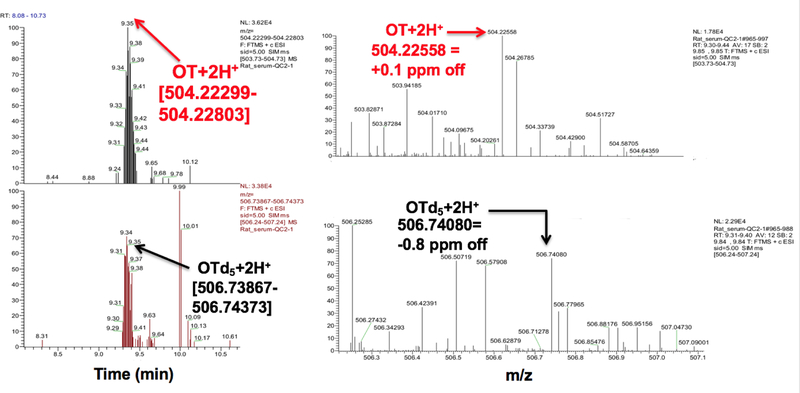
With our serum LLOD of 10 pg/mL, we were unable to detect native, underivatized OT in serum from non-pregnant/non-lactating/non-lactating premenopausal women (Figure 2A) even after including a 10-fold concentration step. We were, however, able to detect OT after spiking down to 10–20 pg/mL (Figure 2B). In contrast, we found OT in serum from pregnant women in the range of 15–20 pg/mL (n=2) at weeks 21–22 gestation age and 25–27 pg/mL (n=2) at weeks 28–36 gestational age (data not shown) and in rats (~350 pg/mL; Figure 3). OT in plasma from mothers after cesarean-section was very close to our LLOD (10 pg/mL) for two samples while the third sample was below our LLOD. We did not detect OT in our cord plasma samples (data not shown).
Figure 2.
Orbitrap LCMS traces of underivatized OT in serum from non-pregnant/non-lactating/non-medicated women without spiking (A) and after spiking with 50 pg/mL OT (B) and applying a 3–5 ppm mass window when monitoring in targeted SIM mode. Differences in retention times are probably due to slight differences in mobile phase composition during gradient elution.
Figure 3.
LCMS traces of underivatized OT in native rat serum (~350 pg/mL) applying a ±3–5 ppm mass window monitoring in targeted SIM mode.
After IN administration of 100 IU OT (5 puffs per nostril, 10 IU per puff), the serum OT level from the male volunteer peaked at 80 pg/mL 15 minutes after dosing followed by a decrease to baseline by 60 minutes (Figure 4A) while the urine excretion peaked at 30 minutes post IN administration (227 pg/mg creatinine; Figure 4B). The urine from the postmenopausal female volunteer peaked 15 minutes after IN administration of a more concentrated OT formulation (100 IU, 1 puff per nostril, 50 IU per puff) at 42,000 pg/mg creatinine (Figure 4B insert). Peak urinary levels from both individuals were followed by a sharp decrease to almost baseline by the next sampling time point (30–60 minutes later; Figure 4B). In saliva from the male volunteer, we found an extremely high OT level (392,000 pg/mL) 15 minutes after IN administration of 100 IU compared to the peak level of 130,000 pg/mL following 20 IU, which also occurred after 15 minutes (Figure 4C). In saliva from the female volunteer, the OT level peaked (1,830 pg/mL) 30 minutes after IN administration of 100 IU and returned to baseline by 60 minutes after dosing (Figure 4C insert). Nasal spray doses were confirmed by LCMS analysis of the 2 nasal spray formulations and by measuring the spray volume (± 5%; data not shown).
Figure 4.
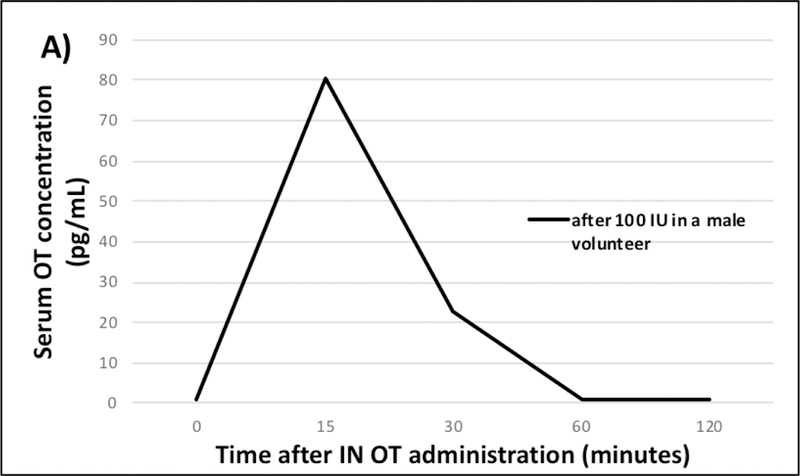
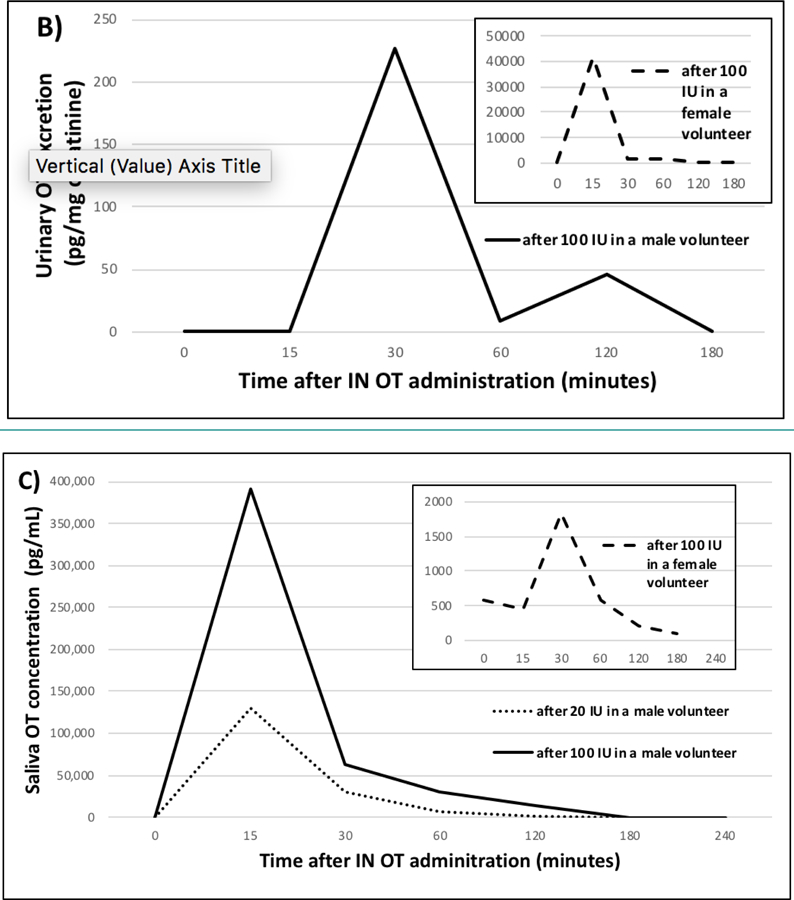
Serum (A), urine (B), and saliva (C) OT levels over time following self-administered intranasal (IN) OT dosing of 100 IU (female volunteer) and 20 IU and 100 IU (male volunteer).
OT stability
OT and OT-d5 added to serum remained relatively stable at 4°C or at room temperature (23°C) when measured up to 24 hours with <15% change in OT and OT-d5 levels compared to pre-incubation levels (data not shown). Similarly, OT and OT-d5 mixtures added to water remained stable regardless of spike concentration or duration of incubation at 10°C when measured up to 5 days (Figure 5). However, when OT and OT-d5 were added to urine, levels dropped by 50–80% immediately (data not shown) after addition and stayed at those low levels regardless of spike concentration or duration of incubation at 10°C when measured up to 5 days (Figure 5). In all experiments the OT / OT-d5 ratio remained relatively constant, which indicated that native and d5-labeled OT behaved identically. We observed a linear inverse relationship between OT or OT-d5 loss in urine and OT or OT-d5 spiking concentration (data not shown); OT and OT-d5 concentrations increased linearly with the extent of urinary dilution with or without heating (Figure 6). Extrapolations of these linear relationships (r=0.98 for OT and r=0.94 for OT-d5 without heating; r=0.91 for OT and r=0.98 for OT-d5 with heating) revealed that the theoretical OT levels as measured in water are reached when non-heated urine is diluted 8-fold. If using heated urine, the theoretical dilution to reach spiked levels in water would be very close (10-fold; data not shown).
Figure 5.
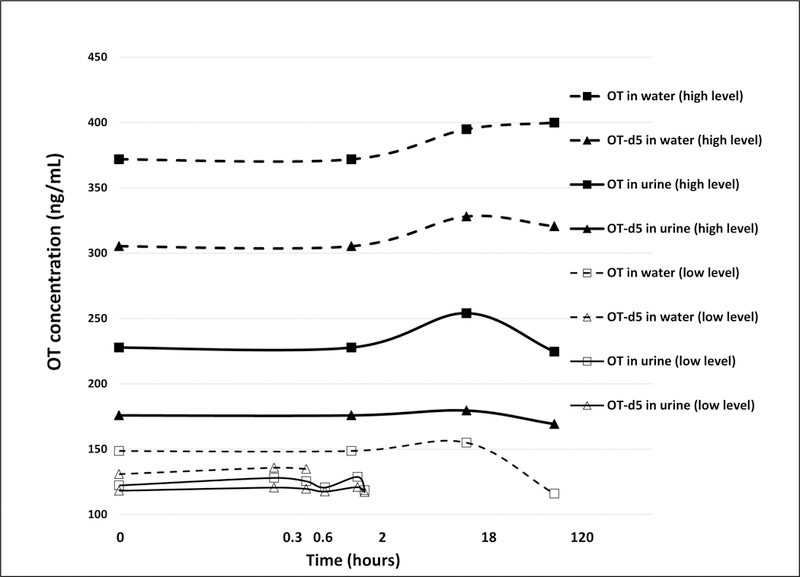
Changes of OT and OT-d5 over time at different initial concentrations in water and in urine. Measured levels differed slightly from theoretical spike amounts due to deviations from the calibration curve (RSD≤4.3%). X-axis is on a log scale.
Figure 6.
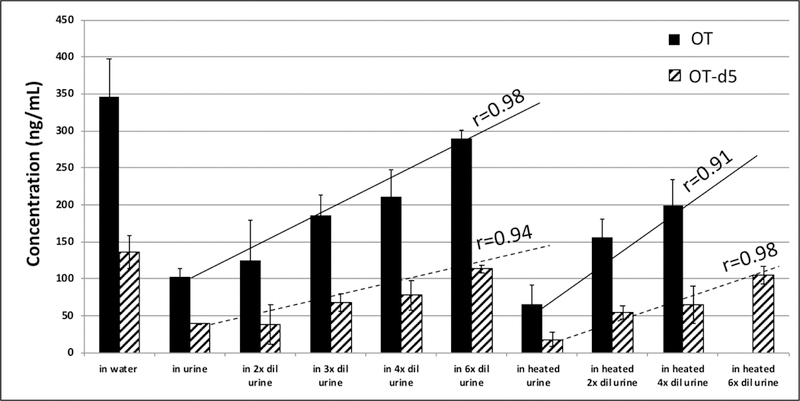
OT and OT-d5 levels in water and in undiluted and diluted urine. Means and standard deviation of LCMS measurements at days 0, 1, and 6. Heated urine was kept at 110°C for 5 minutes. Data for OT in heated 6-fold diluted urine was not available.
Discussion
A tandem LCMS method was recently developed to measure ‘total OT’ (OT-R/A) in blood [13] that involved chemical reduction of OT with 1,4-dithiothreitol that was claimed to disrupt protein binding to OT followed by alkylation with iodoacetamide to stabilize the reduced di-thiol product, which rendered the reaction irreversible. This method reported levels of 500–700 pg/mL total derivatized OT-R/A in plasma of adults. Using this method, even higher levels were reported from non- pregnant/non-lactating humans by others [14,15]. When we followed this method using our HRAM LCMS system with a mass window of 8 ppm, we found average levels of 500–800 pg/mL total derivatized OT-R/A in serum of non-pregnant/non-lactating/non-medicated adults but with very low precision (≥20%). After narrowing our mass window to ±3–5 ppm, we were unable to identify OT-R/A but detected large signals for masses that were ≥ 8ppm different from OT-R/A. Thus, we believe that previous reports involving R/A treatment prior to OT measurement included interferences in their measurements, which would explain the report on startlingly high plasma concentrations (500–1200 pg/mL). This would also explain why our results using this method had poor and inconsistent repeatability.
The resolution of triple-quadrupole MS instruments, such as those used by Brandtzaeg et al. [13], are limited to ‘unit mass’ resolution or approximately 0.6 amu over the entire mass range. Thus, when measuring reduced and alkylated OT (OT-R/A) using this type of MS at its monoisotopic protonated mass all ions will be included in the final signal, which can deviate from the exact mass of OT-R/A+H+ by up to +/− 0.6 amu. Consequently, interferences that have masses within +/− 0.6 amu of OT-R/A+H+ (the target analyte) and occurring at this analyte’s liquid chromatographic retention time cannot be accurately resolved using triple-quadrupole MS. In addition, detection in selected reaction monitoring mode (SRM a.k.a multiple reaction monitoring) allow only parent ions of a single m/z to reach the collision cell. Ion loss occurs during the collisional dissociation/fragmentation process in the collision cell, so that only a fraction of ions from the collision cell are efficiently transferred as product ions of a single (specified) m/z to pass through Q3 for detection. Further, the fragmentation mechanism is diverse—producing a multitude of channels by which the parent molecule can dissociate and, thus, many different fragment ions. Because of this fragmentation diversity, fewer fragment ions representing the analyte are detected in SRM mode compared to targeted SIM (used in our method), which uses all ions of the targeted m/z (representing the analyte) to reach the detector thereby permitting higher specificity because the MS is focused only on collecting data at the specified m/z and higher sensitivity because more time is devoted to looking for the specified m/z values compared to scanning modes such as SRM.
In our current method, underivaized OT was analyzed using an orbitrap MS instrument (Q-Exactive) operated at a mass resolution of 70,000 (FWHM) at m/z 200. The m/z for OT and OT-d5 was 504.22551 (retention time=7.63 minutes) and 506.74120 (retention time=7.62 minutes), respectively, and the measured resolution at these masses were approximately 50,000. Thus, the resolution exceeded 14 ppm and approximately 20 ppm, respectively, for these masses. However, the resolution settings are independent of the ppm mass tolerance window (which is a measure of accuracy of measurement at the apex of the mass peak) and the mass accuracy specification for the Q-Exactive is guaranteed at 3 ppm for all resolutions when calibrated. Our instrument was calibrated before performing the experiment to within 3 ppm of OT’s accurate mass. The applied resolution of approximately 50,000 was sufficient to separate the co-eluting interference(s) from the analyte because the signal of the analyte disappeared entirely in non-spiked serum samples when a mass tolerance of <8 ppm was chosen (Figures 1A and 2A) but appeared at the exact monoisotopic analyte mass after spiking when mass tolerance window of 3–5 ppm was chosen.
Within each run the difference in chromatographic retention time between the apex of an interference and the internal standard was consistently 0.03–0.07 minutes compared to 0.01~0.02 minutes between OT-R/A and its internal standard OTd5-R/A. This indicates that the interference has a distinctly (even though minute) different retention time to the analyte. Slight differences in retention times were observed between our runs, however, this was probably due to slight differences in mobile phase composition during gradient elution. Thus, we can conclude that when using HRAM LCMS (such as Orbitrap) with a 3–5 ppm mass tolerance window, native OT can be accurately measured without interference while analysis with triple-quadrupole tandem MS will include an interference during measurement of OT-R/A.
The routine use of two-dimensional (2D)-LCMS has been applied for native OT measurement in human circulation. [12] However, this method is limited to laboratories possessing the appropriate hardware and software capable of quantifying LC × LC separation data with consistent monitoring. In addition, 2D-LC is time consuming with labor intensive sample workup, requires complex skills for operation, and is not high-throughput making it impractical for fast-turn-around routine analyses. Most importantly, 2D-LC is not sensitive enough to measure native levels in approximately 30% of samples and, therefore, not adequate for OT analysis from non-pregnant/non-lactating/non-lactating individuals.
Our current HRAM LCMS method uses a simple set up with instrumentation readily available in many analytical chemistry laboratories and is able to measure native, underivatized OT using a ±3–5 ppm mass window and monitoring in targeted SIM mode. With a serum LLOD of 10 pg/mL we were unable to detect native OT in serum of non-pregnant/non-lactating/non-medicated women (Figure 2A). This agrees with previous studies reporting very low (<2–10 pg/mL) circulating OT levels in non-pregnant/non-lactating humans using a 2D tandem LCMS method (1–2 pg/mL) where 3 of the 10 subjects had OT levels <LLOD (1 pg/mL) [12] and reports using ELISA after SPE (mean 6.7 pg/mL) [16] or <2 pg/mL using RIA after SPE [17,18].
A recent study measured native, underivatized OT by tandem LCMS also after SPE using MRM transitions 1007->723, 285 and 1012->723, 290 for the singly protonated OT and OT-d5, respectively, and had a LLOD similar to ours (10 pg/mL) [19]. In that study, basal monkey plasma levels were below their LLOD (10 pg/mL), which agrees well with our results in humans. In our rat serum native, underivatized OT levels were much higher (~350 pg/mL; traces shown in Figure 3) than in human serum, which is in agreement with the results obtained by a 2D tandem LCMS method [12].
The low native OT concentrations (≤10 pg/mL) found in our maternal plasma after cesarean-section may be due to its pulsatile release during labor [20], which may have been missed by random sampling or a result of the planned cesarean section birth method, which results in lower OT levels compared to vaginal delivery [21,22]. Native OT levels were not detected in our cord plasma samples possibly due to planned cesarean delivery while other studies have reported cord blood levels to be >10 pg/mL after birth, irrespective of delivery method [22,23]. The latter could also be due to unplanned cesarean delivery, which involves OT administration.
Our experiments with serum and urine suggests that OT is relatively stable in these matrices. Human serum incubated with OT for 24 hours at 4°C and room temperature resulted in ≤15% change compared to pre-incubation levels. This agrees with a previous study [24] that reported little or no OT degradation after a 60 minute incubation at 37°C in plasma from men and non-pregnant women. This provides confidence that the sample workup of our serum/plasma specimens did not contribute considerably to OT degradation and that the decrease in serum OT levels over time following OT IN administration was not due to an experimental artifact. We also found that OT is stable in urine. OT and OT-d5 levels dropped immediately after spiking but remained relatively constant when measured up to 5 days, similar to water spikes (Figure 5). Full scan MS analysis revealed that this OT loss in urine was not due to glycinamide cleavage as previously suggested [25]. We believe that the immediate drop in OT and OT-d5 upon spiking was due to mass spectrometric signal suppression caused by interfering urinary compound(s). This is supported by the identical behavior of neat and d5-labeled OT over time after spiking into urine (Figure 5) and the positive linear trend of increasing OT levels with increasing urine dilution (i.e. decreasing matrix effect). If true, then theoretically diluting urine samples 8-fold or following our sophisticated SPE protocol (see Methods) should avoid any signal suppression by urinary interferences.
Previous studies investigating urine from healthy non-pregnant/non-lactating adults reported mean native OT levels of 17.1±2.4 pg/mL in males/females [26], 11.3±1 pg/mL (assuming 1.2 L urine excretion per day) in males/females [27], 323±209 pg/mL in males and 237±179 pg/mL in females [28], and a range of 5–36, 8–62, and 6–98 pg/mL in males depending on osmolality [29]. These results, however, were based on RIA analyses, which leaves us reason to consider the possibility that an OT metabolite [4] or non-OT immunoreactive species may have also been included in the measurements [7]. If so, then analysis may have led to an overestimation of OT if the metabolite had a higher affinity than the native peptide and was recognized by the applied antibodies [4].
Following IN OT administration the appearance patterns in the male and female volunteer were very similar qualitatively. Urine levels peaked slightly earlier (after 15 minutes) and substantially higher (~42,000 pg/mg creatinine) in the female versus the male after 100 IU (peak after 30 minutes at 227 pg/mg creatinine) (Figure 4B). These differences could be due different IN OT formulations and dosing concentrations. The female administered the 100 IU dose using 1 puff per nostril (50 IU per puff) contributing to a quicker, more concentrated solution per dose compared to the male, who administered the 100 IU dose in 10 sprays using 5 puffs per nostril (10 IU per puff) alternating nostrils between puffs; this would logically explain the faster and higher OT levels found in urine from the female versus male post IN administration. These factors along with others (i.e. type of aerosol distributor [30], particle size of the formulation [31], or interindividual variation, may have contributed to differences in the amount of OT absorbed and subsequently being bioavailable for uptake. Since OT dosage, duration, and frequency of dose (puffs per nostril) have not been standardized for clinical/research applications among [32], these differences could also account for differences in urinary OT levels following IN dosing.
Saliva levels following IN OT administration peaked 15 minutes post administration (Figure 4C) followed by a very rapid elimination to levels below LLOD after 2–3 hours. This fast OT peak could be due to an artificial OT spike caused by unabsorbed spray being brought from the nasal cavity into the mouth when providing a saliva sample, as previously suggested [33]. We propose that after IN administration, OT adhered to the mucus layer of ciliated epithelium present in the nasal cavity and was propelled by cilia via mucociliary clearance towards the nasal pharynx where it was subsequently swallowed [34].
Any OT that was absorbed through the nasal cavity would be deposited into the circulation by nearby blood vessels and eventually penetrate into the CNS or/and be excreted into urine. The latter would be supported by the delayed appearance of peak urine OT levels following 100 IU OT (Figure 4B) at 30 minutes compared to peak serum and saliva OT levels found after 15 minutes (Figures 4A and 4C).
Conceivably, the absorption of OT into the circulation could depend on the rate of mucociliary clearance with a faster [first phase mucociliary] clearance resulting in lower absorption, and vice versa [35]. This would explain why peak saliva levels (with a relatively fast clearance at 15 minutes post administration; Figure 4C) were much higher than peak excretion and serum levels from the male volunteer after 100 IU whereas the opposite was observed from the female volunteer whose peak saliva levels (with a relatively slower clearance at 30 minutes post administration; Figure 4C insert) was much lower than her peak urine excretion after 100 IU (Figure 4B insert). Future pharmacokinetic studies assessing multiple biospecimen types in a larger population may help to provide additional information regarding individual differences in the time course of appearance of OT in saliva, urine and serum after IN administration.
Conclusion
Using our HRAM LCMS method in human specimens we found native, underivatized OT levels in cord plasma and serum/plasma from non- pregnant/non-lactating/non-medicated subjects to be less than 10 pg/mL and undetectable. In contrast, extremely high levels in saliva were found in 2 subjects after IN OT administration of 20 IU or 100 IU and OT levels in urine were higher than those found in serum. Peak levels were detected in serum, urine, and saliva 15–30 minutes after each dose then decreased to below detection limits 1–2 hours thereafter; these fast elimination times following IN administration are in agreement with many other studies. CNS effects occurring after IN OT administration remain to be determined. Improvements for native OT detection in human biological fluids by LCMS via generating derivatives with intelligent chemistry leading to products with higher MS sensitivity are successfully under way in our laboratory.
Acknowledgements
We would like to thank Dr. Patrick Sluss (Harvard University) and Dr. Men-Jean Lee (Kapi’olani Medical Center for Women and Children, Honolulu, Hawaii) for generously providing de-identified serum from healthy pregnant women and cord and maternal plasma. We thank Dr. Gertraud Maskarinec (University of Hawaii Cancer Center) for donating de-identified serum samples from non-pregnant/non-lactating/non-medicated premenopausal women who participated in a previous intervention study (the BEAN study); these samples were used for quality assurance testing. We would also like to thank Laurie Custer (University of Hawaii Cancer Center) for the initial experiments to measure OT by LCMS. We are grateful to Tonya Second and Simon Sheng from Thermo Scientific for their helpful discussions related to orbitrap LCMS.
Funding: National Cancer Institute (P30 CA71789)
Footnotes
Conflict of Interest: none
References
- 1.Brownstein MJ, Russell JT, Gainer H. Synthesis, transport, and release of posterior pituitary hormones. Science 1980,207,373. [DOI] [PubMed] [Google Scholar]
- 2.de Geest K, Thiery M, Piron-Possuyt G, Vanden Driessche R. Plasma oxytocin in human pregnancy and parturition. J Perinat Med 1985,13,3. [DOI] [PubMed] [Google Scholar]
- 3.Lee HJ, Macbeth AH, Pagani JH, Young WS 3rd. Oxytocin: the great facilitator of life. Prog Neurobiol 2009,88,127. [DOI] [PMC free article] [PubMed] [Google Scholar]
- 4.Leng G, Sabatier N. Measuring Oxytocin and Vasopressin: Bioassays, Immunoassays and Random Numbers. J Neuroendocrinol. 2016,28, [DOI] [PMC free article] [PubMed] [Google Scholar]
- 5.McCullough ME, Churchland PS, Mendez AJ. Problems with measuring peripheral oxytocin: can the data on oxytocin and human behavior be trusted? Neurosci Biobehav Rev 2013,37,1485. [DOI] [PubMed] [Google Scholar]
- 6.Christensen JC, Shiyanov PA, Estepp JR, Schlager JJ. Lack of association between human plasma oxytocin and interpersonal trust in a Prisoner’s Dilemma paradigm. PLoS One 2014,9,e116172. [DOI] [PMC free article] [PubMed] [Google Scholar]
- 7.Szeto A, McCabe PM, Nation DA, et al. Evaluation of enzyme immunoassay and radioimmunoassay methods for the measurement of plasma oxytocin. Psychosom Med 2011,73,393. [DOI] [PMC free article] [PubMed] [Google Scholar]
- 8.Martin J, Kagerbauer SM, Gempt J, Podtschaske A, Hapfelmeier A, Schneider G. Oxytocin levels in saliva correlate better than plasma levels with concentrations in the cerebrospinal fluid of patients in neurocritical care. J Neuroendocrinol 2018,e12596. [DOI] [PubMed]
- 9.Valstad M, Alvares GA, Egknud M, et al. The correlation between central and peripheral oxytocin concentrations: A systematic review and meta-analysis. Neurosci Biobehav Rev 2017,78,117. [DOI] [PubMed] [Google Scholar]
- 10.Kagerbauer SM, Martin J, Schuster T, Blobner M, Kochs EF, Landgraf R. Plasma oxytocin and vasopressin do not predict neuropeptide concentrations in human cerebrospinal fluid. J Neuroendocrinol 2013,25,668. [DOI] [PubMed] [Google Scholar]
- 11.Striepens N, Kendrick KM, Hanking V, et al. Elevated cerebrospinal fluid and blood concentrations of oxytocin following its intranasal administration in humans. Sci Rep 2013,3,3440. [DOI] [PMC free article] [PubMed] [Google Scholar]
- 12.Zhang G, Zhang Y, Fast DM, Lin Z, Steenwyk R. Ultra sensitive quantitation of endogenous oxytocin in rat and human plasma using a two-dimensional liquid chromatography-tandem mass spectrometry assay. Anal Biochem 2011,416,45. [DOI] [PubMed] [Google Scholar]
- 13.Brandtzaeg OK, Johnsen E, Roberg-Larsen H, et al. Proteomics tools reveal startlingly high amounts of oxytocin in plasma and serum. Sci Rep 2016,6,31693. [DOI] [PMC free article] [PubMed] [Google Scholar]
- 14.Semba RD, Zhang P, Zhu M, et al. A targeted proteomic assay for the measurement of plasma proteoforms related to human aging phenotypes. Proteomics 2017,17, [DOI] [PMC free article] [PubMed] [Google Scholar]
- 15.Comninos AN, Wall MB, Demetriou L, et al. Kisspeptin modulates sexual and emotional brain processing in humans. J Clin Invest 2017,127,709. [DOI] [PMC free article] [PubMed] [Google Scholar]
- 16.Carson DS, Berquist SW, Trujillo TH, et al. Cerebrospinal fluid and plasma oxytocin concentrations are positively correlated and negatively predict anxiety in children. Mol Psychiatry 2015,20,1085. [DOI] [PubMed] [Google Scholar]
- 17.van Londen L, Goekoop JG, van Kempen GM, et al. Plasma levels of arginine vasopressin elevated in patients with major depression. Neuropsychopharmacology 1997,17,284. [DOI] [PubMed] [Google Scholar]
- 18.Modahl C, Green L, Fein D, et al. Plasma oxytocin levels in autistic children. Biol Psychiatry 1998,43,270. [DOI] [PubMed] [Google Scholar]
- 19.Lee MR, Scheidweiler KB, Diao XX, et al. Oxytocin by intranasal and intravenous routes reaches the cerebrospinal fluid in rhesus macaques: determination using a novel oxytocin assay. Mol Psychiatry 2017,23,115. [DOI] [PMC free article] [PubMed] [Google Scholar]
- 20.Gibbens GL, Chard T. Observations on maternal oxytocin release during human labor and the effect of intravenous alcohol administration. Am J Obstet Gynecol 1976,126,243. [DOI] [PubMed] [Google Scholar]
- 21.Kuwabara Y, Takeda S, Mizuno M, Sakamoto S. Oxytocin levels in maternal and fetal plasma, amniotic fluid, and neonatal plasma and urine. Arch Gynecol Obstet 1987,241,13. [DOI] [PubMed] [Google Scholar]
- 22.Dawood MY, Raghavan KS, Pociask C, Fuchs F. Oxytocin in human pregnancy and parturition. Obstet Gynecol 1978,51,138. [PubMed] [Google Scholar]
- 23.Kumaresan P, Han GS, Anandarangam PB, Vasicka A. Oxytocin in maternal and fetal blood. Obstet Gynecol 1975,46,272. [PubMed] [Google Scholar]
- 24.Leake RD, Weitzman RE, Fisher DA. Pharmacokinetics of oxytocin in the human subject. Obstet Gynecol 1980,56,701. [PubMed] [Google Scholar]
- 25.Walter R, Shlank H. In vivo inactivation of oxytocin. Endocrinology 1971,89,990. [DOI] [PubMed] [Google Scholar]
- 26.Amico JA, Ulbrecht JS, Robinson AG. Clearance studies of oxytocin in humans using radioimmunoassay measurements of the hormone in plasma and urine. J Clin Endocrinol Metab. 1987,64,340. [DOI] [PubMed] [Google Scholar]
- 27.Hermann K, Rittweger R, Ring J. Urinary excretion of angiotensin I, II, arginine vasopressin and oxytocin in patients with anaphylactoid reactions. Clin Exp Allergy 1992,22,845. [DOI] [PubMed] [Google Scholar]
- 28.Fujiwara T, Kubzansky LD, Matsumoto K, Kawachi I. The association between oxytocin and social capital. PLoS One 2012,7,e52018. [DOI] [PMC free article] [PubMed] [Google Scholar]
- 29.Boyd NR, Jackson DB, Hollingsworth S, Forsling ML, Chard T. The development of a radioimmunoassay for oxytocin: the extraction of oxytocin from urine and determination of the excretion rate for exogenous and endogenous oxytocin in human urine. J Endocrinol 1972,52,59. [DOI] [PubMed] [Google Scholar]
- 30.Mygind N, Vesterhauge S. Aerosol distribution in the nose. Rhinology 1978,16,79. [PubMed] [Google Scholar]
- 31.Vidgren MT, Kublik H. Nasal delivery systems and their effect on deposition and absorption. Adv Drug Deliv Rev 1998,29,157. [DOI] [PubMed] [Google Scholar]
- 32.MacDonald E, Dadds MR, Brennan JL, Williams K, Levy F, Cauchi AJ. A review of safety, side-effects and subjective reactions to intranasal oxytocin in human research. Psychoneuroendocrinology 2011,36,1114. [DOI] [PubMed] [Google Scholar]
- 33.Daughters K, Manstead AS, Hubble K, Rees A, Thapar A, van Goozen SH. Salivary Oxytocin Concentrations in Males following Intranasal Administration of Oxytocin: A Double-Blind, Cross-Over Study. PLoS One 2015,10,e0145104. [DOI] [PMC free article] [PubMed] [Google Scholar]
- 34.Merkus FW, Verhoef JC, Schipper NG, Marttin E. Nasal mucociliary clearance as a factor in nasal drug delivery. Adv Drug Deliv Rev 1998,29,13. [DOI] [PubMed] [Google Scholar]
- 35.Veening JG, Olivier B. Intranasal administration of oxytocin: behavioral and clinical effects, a review. Neurosci Biobehav Rev 2013,37,1445. [DOI] [PMC free article] [PubMed] [Google Scholar]


