

Abstract
The atomic-level mechanisms that coordinate ligand release from protein pockets are only known for a handful of proteins. Here, we report results from accelerated molecular dynamics simulations for benzene dissociation from the buried cavity of the T4 lysozyme Leu99Ala mutant (L99A). In these simulations, benzene is released through a previously characterized, sparsely populated room-temperature excited state of the mutant, explaining the coincidence for experimentally measured benzene off rate and apo protein slow-timescale NMR relaxation rates between ground and excited states. The path observed for benzene egress is a multistep ligand migration from the buried cavity to ultimate release through an opening between the F/G-, H-, and I-helices and requires a number of cooperative multiresidue and secondary-structure rearrangements within the C-terminal domain of L99A. These rearrangements are identical to those observed along the ground state to excited state transitions characterized by molecular dynamic simulations run on the Anton supercomputer. Analyses of the molecular properties of the residues lining the egress path suggest that protein surface electrostatic potential may play a role in the release mechanism. Simulations of wild-type T4 lysozyme also reveal that benzene-egress-associated dynamics in the L99A mutant are potentially exaggerations of the substrate-processivity-related dynamics of the wild type.
Introduction
Although receptor flexibility has been acknowledged as important for ligand binding and molecular recognition (1, 2, 3), its importance is less emphasized in studies of ligand release, particularly in cases in which the ligand release occurs on timescales longer than a few hundred microseconds. The development of new molecular dynamics (MD) simulation methodologies and longer simulations enabled through GPU (graphics processing unit) and/or Anton technologies allow for more detailed atom-level investigation of ligand release mechanisms (4, 5, 6, 7, 8, 9).
The T4 lysozyme Leu 99 to Ala mutant (L99A) is a popular model system for studying excited states of proteins and the thermodynamics of ligand binding (10, 11, 12, 13, 14, 15); here, a protein excited state refers to a conformational state of a protein that can be experimentally detected in low population and is higher in energy than the ground state (16). Because the L99A excited state and benzene binding are not observed experimentally for the wild-type (WT) lysozyme, both the excited-state transitioning and ligand-binding events in the L99A mutant are presumed to occur as a result of a buried cavity in the C-terminal domain (Fig. 1). The hydrophobic cavity in the L99A mutant is greater than 100 Å3 and is buried more than 5 Å from the protein surface (15, 17). Despite this large cavity, the backbone of the crystal structure of L99A is identical to the backbone of the crystal structure of the WT protein (Fig. 1). Strikingly, a clear path from solvent to the buried cavity is absent from the crystal structure (18).
Figure 1.
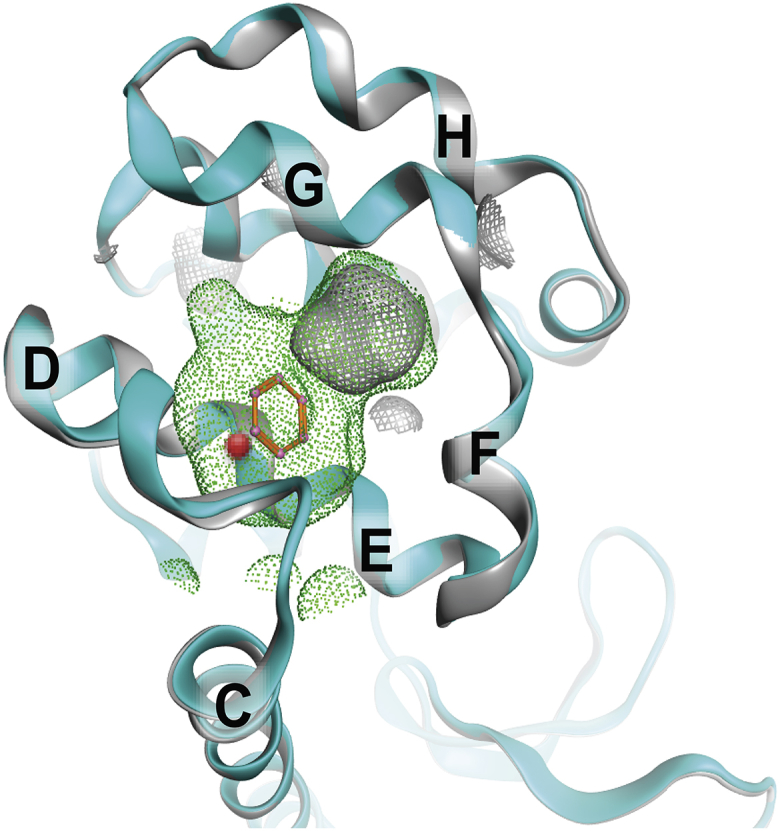
Crystallographic comparison of T4 lysozyme WT∗ and L99A benzene-bound mutant illustrates few differences apart from cavity expansion. The backbone atom superposition of WT T4 lysozyme (PDB: 1L63, gray) and L99A cavity-forming mutant (PDB: 181L, cyan and green cavity) is shown. The Cα of residue 99 is shown as a red sphere on the E-helix positioned behind the benzene ring. To see this figure in color, go online.
Here, we performed accelerated MD (aMD) simulations of the L99A mutant of T4 lysozyme with benzene bound to elucidate the protein motions necessary for ligand dissociation through a method that does not require knowledge of the exit path a priori. This methodology was chosen because the benzene off rate, ∼1 ms at 30°C (19), is longer than conventional MD simulations, and aMD has previously been shown to accurately recapitulate experimentally measured long-lived conformational phenomena such as torsional populations and water-protein exchange (20, 21). Unlike other enhanced sampling techniques that bias a trajectory along a selective path based on collective variables (22), which may not be known a priori, aMD adds energy to the system to raise the energy minima to be closer to the transition energies. By effectively “filling in the valleys” of an energy landscape, higher-energy barrier transitions are observed more frequently or at an earlier time step than a conventional MD trajectory.
Through application of all-atom aMD, we witness and characterize benzene dissociation through a surface between the F/G-, H-, and I-helices (the “FGHI surface”). Chemical-shift back calculations, backbone torsion, and hydrogen-bond distance measurements for the trajectory structural ensemble suggest benzene dissociates from L99A through the NMR-characterized excited state and not the ground state. Other cavity openings are witnessed during trajectories of the mutant in the ground state, the same cavity openings that were previously described in benzene egress with weighted ensemble simulations (23), in O2 unbinding with unbiased MD (12), and in apo simulations with unbiased long-timescale MD on the Anton supercomputer (15). Despite these other cavity openings, benzene was only seen to exit through the high-energy-state FGHI surface with aMD. Although it is possible that benzene could egress through these other cavities, the egress pathway we observe here through the FGHI surface occurs in tandem with excited-state transitioning, explaining the similarities between the experimentally determined rate constants for both of these phenomena. Poisson-Boltzmann calculations for the cavity-opening surfaces between the D- and F/G-helices (DG, where benzene binds), the FGHI surface (where benzene exits), and the other openings previously described (23) suggest that polar surfaces may impact the probability of ligand ingress and egress along various pathways.
Methods
aMD simulations
Three systems were set up for aMD simulations (24) using identical methods described previously (21), with this method aimed at increasing the energy of the energy minima to allow for more opportunities for the protein to transition between energy minima and not altering the transition landscape. The Protein Data Bank (PDB): 1L63, 1L90, and 181L were used for the WT∗ (25), L99A apo mutant ground state (26), and L99A benzene-bound mutant lysozyme ground state (18), respectively. WT∗ refers to a sequence difference from WT in which residue C54T and C97A mutations were made to promote protein stability in vitro and were maintained here in silico for alignment with experiments (27). Proteins were prepared using the Protein Wizard in Small-Molecule Drug Discovery Suite (Schrödinger, New York, NY) with crystallographic pH conditions, 150 mM NaCl (30 Cl− and 21 Na+ ions), and visual inspection for correct side-chain protonation states, including protonation of H33 such that it is positively charged in the simulation. Benzene for the holo system was parameterized using Jaguar (Schrödinger) for geometry optimization and charge calculations, then incorporated into the starting-structure AMBER MD parameter file using GAFF and XLeap. Each system was solvated in a cubic box and contained ∼33,000 atoms. Approximately 1.5 μs of simulation was conducted for each system, performed with NVIDIA GK110 (GeForce GTX Titan; NVIDIA, Santa Clara, CA) GPUs using the CUDA version of PMEMD in AMBER 12. The simulation systems were minimized with the CPU version of AMBER 11 SANDER v. 2010 for the apo and WT∗ systems and with AMBER 12 SANDER v. 2012 for the holo system (28, 29). The TIP4P-Ew water model (30) and the AMBER-ff99SB (31, 32) force field were used for three independently seeded runs of ∼500 ns on each for each system.
50 ns of conventional MD were used as a reference for each system and to calculate dual boost potentials as described previously (21), specifically with NVT (constant number of atoms, volume and temperature) conditions, Langevin thermostat to maintain 300 K, collision frequency of 2 ps, 10 Å cutoff radius for nonbonded interactions, and particle mesh Ewald electrostatics for long-range interactions (33). Boost potentials for the three systems were as follows: WT∗, E(dih-boost) = 2535 kcal/mol, E(PE-boost) = −89,887 kcal/mol; L99A apo, E(dih-boost) = 2540 kcal/mol, E(PE-boost) = −89,829 kcal/mol; L99A holo, E(dih-boost) = 2431 kcal/mol, E(PE-boost) = −90,597 kcal/mol. The signs of the boosts are based on the energy function for aMD (21, 24). More information on how to parameterize the boost potentials for aMD can be found in the AMBER tutorial, http://ambermd.org/tutorials/advanced/tutorial22/index.html, based the published aMD workflow (21). Production runs were carried out on GPU starting from the equilibrated simulation coordinates at the end of the 50 ns conventional MD run with 2 fs time step, SHAKE algorithm set to constrain all bonds involving hydrogen atoms, and snapshots collected every 2 ps.
For all simulation analyses and simulation details of the trajectory, including the dihedral angles, internal distances, and SHIFTX2 chemical-shift differences (34) please see Schiffer et al. (15). Images of protein were taken using VMD (35) and CCG MOE (36). Cpptraj was used to measure the watershells in Figs. S4 and S10 (37). C-terminal domain buried cavity volume calculations were performed with POVME (38).
APBS calculations
The PDB2PQR (39) automated pipeline was used to investigate the electrostatics of buried cavities and pocket openings from the aMD trajectories. A pH of 5.5 was chosen to align with the pH from multiple NMR studies (16, 19). The PARSE force field was chosen for the calculation (40).
Results
Benzene leaves through a transient surface opening in L99A excited state
aMD simulations for the benzene-bound L99A cavity mutant T4 lysozyme (Fig. 1) were performed to survey a potential egress path for benzene. In one of three 500 ns trajectories, benzene unbinds from the protein through a transient opening between the F/G-, H-, and I-helices (FGHI surface, Video S1) in a succession of substates: S1, S2, and S3 (Fig. 2 A). Substate S2 has not been characterized experimentally and is only observed in this trajectory. Volume measurements for the C-terminal domain over the course of benzene release (Fig. 2 B) illustrates significant buried volume expansion as benzene transitions from the L99A pocket to the neighboring pocket (substates S1–S2) and finally a reduction to less than the starting structure as benzene is released. The diminished volume of the L99A cavity results from the phenyl ring of F114 occupying the cavity previously occupied by benzene in a structure that recapitulates the previously determined excited state of L99A (16). Benzene traces the same path that F114 travels in the transition from ground to excited state of L99A, albeit in opposite directions (Fig. S1). Thus, the structure of the L99A mutant that benzene is released from more resembles the experimentally determined high-energy L99A state than the L99A benzene-bound or apo crystallographic structures.
Figure 2.

Benzene egress from L99A. (A) Benzene (orange) samples three substates, S1 (blue), S2 (gold), and S3 (red), on its egress path. L99A ribbon representation shows the structure of L99A after benzene exits. (B) C-terminal buried pocket volume measured using POVME (38) over the benzene release trajectory. The FGHI pocket opens to the surface, with benzene in view (orange), at ∼26,000 aMD time step. To see this figure in color, go online.
Productive versus nonproductive excursions toward benzene egress
The nearly 1.5 μs aMD simulation for holo L99A reveals backbone and side-chain motions that are productive for benzene release and those that are not. Only when the concerted protein motions and final structural state recapitulate the structural hallmarks of the L99A ground state to excited state transition (15) and the previously published structure for the excited state (16) does benzene egress the protein. Fig. 3 illustrates and compares key structural feature measurements throughout our simulations in which benzene remains bound (column A) and egresses from the protein (column B) to those for the published static experimentally determined structures (noted by the orange and blue dots next to each panel). Also shown are the same measurements for the previously published apo L99A Anton simulation in which the protein undergoes a transition from the ground state to excited state (column C).
Figure 3.

Trajectories contain structural hallmarks of excited state L99A during benzene exit and comparisons to ground state. F114 Χ1 (black) and Ψ (blue) angle changes, F153 Χ1 angle change, hydrogen-bond distances between G113 and S117, and back-calculated chemical shifts for the Cα of F114 and V103 are shown over aMD simulation trajectories for stable benzene holo L99A simulation (column A), for the simulation with benzene egress (column B), and for the previously reported ground to excited state L99A simulation (column C) performed on Anton (15). On the right of each figure are shown the population distributions of each measurements. The blue and orange dots indicate the ground-state and excited-state values as measured in the crystal structures (PDB: 3DMV and 2LCB), respectively, for the F114 Χ1 and Ψ, F153 Χ1, L133 Χ1 distance between the backbone of G110 to F114 and G113 to S117. The blue and orange dots indicate the ground-state and excited-state chemical shifts, respectively, for F114, V103, and V111. These chemical shifts represent the largest Cα chemical-shift differences between the ground and excited state for the L99A mutant. To see this figure in color, go online.
For productive benzene release, benzene starts in the ground state in substate S1 (labeled S1, Fig. 2). As benzene egresses (Fig. 3, column B), concerted motions of buried hydrophobic side-chain rotations and secondary-structure changes for the F- and G-helices give rise to similar substates, as witnessed previously in the apo L99A transitions to the excited state (Fig. 3, column C). The F-helix unwinds (Fig. S2) and then refolds to form a single long helix with the G-helix (referred to as F/G-helix). At aMD time step ∼22,000, the F/G-helix rewinds, as evidenced by the backbone hydrogen-bond formation between G113 and S117 (Fig. 3 B), and L121, L133, and F153 side chains rotate to open up an adjacent cavity closer to the H- and J-helices, substate S2 (labeled S2, Fig. 2). Concurrent with this benzene relocation, the F114 phenyl ring moves from a position at the F/I-helix interface into a more buried position filling the cavity created by the L99A mutation, i.e., the excited-state conformation (16), and benzene shifts to a surface hydrophobic patch in substate 3 (Fig. 2; Fig. S3). These visual observations are supported by the torsional angles measured for F114 and F153, and the shortened amide nitrogen to carbonyl oxygen i to i + 4 distance for G110-F114, A112-N116, and G113-S117 (Fig. 3, column B; Fig. S3).
Distinct changes in the water shell as benzene exits through the FGHI surface through S1, S2, and S3 are observed in which the number of waters in the water shells are perturbed during protein structural rearrangements (Fig. S4, Sim 2). The first water shell is defined here to be within 5 Å of the protein, whereas the second water shell is between 5 and 10 Å. A decrease in the number of waters in the first and second water shell around F114 and V111, representing the FGHI and DFG pockets, respectively, occurs in concert with increases in the number of waters in the first and second water shell around benzene, the four-helix pocket (W134), and the HG pocket (Y139) during S3. Once benzene egress from the cavity is complete, the water shell around the DFG pocket, four-helix pocket, and FGHI region remains altered, perhaps reflective of the high-energy conformation relative to the ground-state conformation. No water is seen to enter the buried cavity throughout these transitions.
Nonproductive excursions and path openings within the ground-state structure of L99A, in which benzene remains in the buried L99A cavity, are also seen in the aMD simulations of apo and holo L99A (Fig. 3 B; Figs. S5 and S6). These fluctuations are consistent with an array of experimental observables for these residues: low NMR order parameters (41), lower hydrogen exchange protection factors relative to WT (42, 43), high crystallographic B-factors (44), and propensity to deform upon ligand binding to the nearby cavity (18, 45). These excursions are unproductive in allowing benzene egress, and the residue transitions are not concerted as they are when benzene egresses (compare Fig. 3, A and B). Additionally, changes in the water shells are only seen for the FGHI pocket (F114) and the DFG pocket (V111) (Fig. S4) during these nonproductive excursions and show increased solvation, perhaps preventing further egress.
Electrostatic potential of mobile defects may contribute to benzene egress through the excited state
Upon characterization of the different tunnels observed in these simulations, we were interested to know why benzene only leaves through the high-energy state rather than the more direct path(s) observed for benzene binding (46, 47) or in the other substates described previously for ABMD simulations (48). Although the egress of benzene through other cavity openings may not have been witnessed with our current amount of sampling, we had anticipated that egress would be governed solely by the opening of a path with an appropriate shape and volume to the surface sufficient for benzene to pass. However, our results illustrate that multiple potential paths are available for benzene egress in the ground state within our aMD simulation (Figs. S6 and S8), yet benzene stays bound. Further confounding us is that the opening from which benzene exits, between the F/G-, H-, and I-helices (FGHI), is narrower than openings between the D- and F/G-helices (DG) (Fig. S7) or HJ-helices. In fact, cavity opening at the DG surface is large enough to completely expose benzene to solvent (Fig. S8), and previous adiabatic-biased MD (ABMD) results suggest that an opening at the DG surface is a preferred path of benzene egress (48). We investigated physical explanations for why cavity volume and mobile defects alone may not account for the potential preference of benzene to egress through the FGHI pocket in the aMD simulations.
Electrostatic changes of the protein surface over the trajectory, characterized by the adaptive Poisson-Boltzmann solver (APBS) (39), reveal that electrostatic surface potentials may play a role in benzene binding and release. Fig. 4 shows electrostatic potential of the protein surface at trajectory snapshots in which various cavity openings occur, namely between the DFG-helices (a benzene ingress site (46, 47), the FGHI-helices (benzene egress site), the HJ-helices, and between the four-helix bundle were analyzed with the APBS (Fig. 4; Fig. S9). The electrostatic potential maps illustrate that all other cavity openings are more apolar than the FGHI pocket through which benzene egresses (Fig. 4, A–C). In fact, the FGHI surface has a positive electrostatic potential (blue, Fig. 4 B).
Figure 4.

Electrostatic surface potential of L99A holo pockets. Electrostatic potential (blue = +8, red = −8, VMD (35)) of the pocket formed at (A) the HJ pocket (B), the FGHI pocket, and (C) the DFG pocket opening at the ∼24,000 time step in the unproductive holo simulation (Fig. S8A), as calculated with APBS (see Methods). To see this figure in color, go online.
The slight positive electrostatic potential of the FGHI pocket is due to local F-helix unwinding that exposes backbone amides at the pocket surface. Moreover, although other cavities have charged residues closer to the aqueous surfaces, the FGHI cavity becomes more hydrophobic as the distance from the center of the protein increases (Fig. S9). This subtle change in hydrophobicity could be what enables benzene to escape from the buried cavity because benzene pauses on its egress at this hydrophobic surface at around 26,000 aMD time steps. The change in surface charge of the buried cavity is accompanied by, or perhaps due to, a shift in the location of the cavity closer to the H- and J-helices. It is therefore possible that the mere opening of a path between the core and surface is not sufficient for benzene egress as it is for benzene ingress.
Water density at these different surfaces is also likely to be impacted by the electrostatic potential and in turn affect the benzene egress through these surfaces. When the DFG pocket opens at ∼24,000 aMD timesteps in the unproductive holo simulation (Fig. S4), a large increase in the number of waters in the first and second water shell occurs, possibly combating benzene partitioning to the surface and aqueous interface of the protein. Conversely, when L99A transitions to the excited state, the water shell around the FGHI pocket decreases, likely in part due to the low electrostatic potential on the surface of the FGHI pocket opening, enabling benzene to partition to the surface.
WT∗ T4 lysozyme samples similar yet attenuated plasticity relative to the cavity-expanded mutant
aMD simulations on WT∗ lysozyme were conducted for comparison to aMD simulations on apo L99A and benzene-bound L99A. Concerted motions seen in WT∗ simulations are reminiscent of those seen for the benzene-L99A complex (Fig. 5, A and B). Unlike in L99A, fluctuations within the WT∗ protein quickly relax back to the ground state. The native cavity at A99 is too small to accommodate F114 in WT∗ with a 30 Å buried cavity (16). Rather, in wild type, the concerted motions serve to open the groove between the F/G-, H-, and I-helices, the same groove that binds the peptide portion of the peptidoglycan substrate of T4 lysozyme (Fig. 5, C and D). These motions are also concerted with changes in the number of waters around the water shells around the FGHI pocket, the DFG pocket, the four-helix pocket, and the HG pocket, just as was seen in the productive excursion of benzene from the L99A cavity (Fig. S10). In particular, a sharp decrease in the FGHI pocket is followed by a prolonged decrease in water number around the DFG pocket at 7500 aMD time steps in one of three WT∗ apo simulations.
Figure 5.

WT T4 lysozyme transition from ground state to a high-energy-like state. (A) Concerted side-chain motion and backbone breakages occurring at ∼2600 aMD time steps for the same residues as involved with ground state to high-energy state transition in L99A mutant. (B and C) Structures from the crystal structure (green) compared to the high-energy-like state (cyan) for F114, L133, F153, and V111. (D) Helices F, G, H, and I in the ground state (cyan) and WT∗ high-energy-like state (orange) with the peptidoglycan substrate (purple). To see this figure in color, go online.
Discussion
Here, our results demonstrate the ability of all-atom explicit-solvent aMD simulations to traverse the energy barriers that allow benzene egress from the L99A mutant of T4 lysozyme. These simulations identify benzene egress through the L99A excited state, tracing a path out of the buried cavity that mirrors the path that the phenyl side chain of F114 travels in the transition from the ground to excited state. Although only one ligand-unbinding event was witnessed in the triplicate trajectories and thus sampling for this event is singular, this observation is consistent with the experimental timescales for both of these events being “rare” compared to the MD timescale. Specifically, both the ground to high-energy state exchange for apo L99A lysozyme and the benzene koff occur on the millisecond timescale (16, 19).
The observation of benzene egress in aMD simulations affords us an understanding of the conformational details associated with the event without biased constraints to specific protein or ligand residues. We find the conformational details simulated recapitulate the same torsional and backbone changes as those observed in unbiased long-timescale conventional MD that simulated the transition from ground to excited state for apo L99A (15) and that both agree with experimental conformational parameters. In this study, the transition is accompanied by F/G-helix unwinding and refolding into a single helix, resulting in calculated chemical-shift differences between benzene-bound and unbound states that are consistent with NMR chemical-shift differences between ground and excited states from experiment (Fig. 3) (16). Concerted torsion angle changes in buried residues (V111, F114, and L133) are also observed in both accelerated (holo) and Anton (apo) simulations. Perhaps the only notable exception to the similarity in the conformational changes observed for benzene egress is a torsion flip of W153 at the very onset of the egress that may allow the room for benzene to slide past F114. These results suggest that the benzene off pathway requires a greater degree of conformational cooperativity than the benzene ingress pathway, an observation consistent with the difference in the kon and koff rate constants for benzene differing by approximately three orders of magnitude.
Recently, a number of T4 L99A dynamic simulation studies have investigated the benzene egress (23, 48), including one study in which application of ABMD suggested that the major path of ligand egress occurs through the FGHI pocket (48). In these studies, as in our simulations, multiple tunnels or potential paths are observed for the ground-state ensemble. Nunes-Alves and colleagues (23) have applied high-temperature MD simulations and observed similar tunnels as reported for apo L99A Anton simulations, including four distinct pathways for benzene egress. Additionally, multiple paths for benzene unbinding were possible in the ABMD study. These studies suggest egress mechanisms that are largely controlled by local conformational changes that provide a suitable volume for benzene to escape. Our study differs from those previously reported because these similar tunnels did not provide productive egress; rather, only the excited-state conformational ensemble allowed egress through the FGHI pocket path.
The findings here suggest that the substate’s surface electrostatic potential allows benzene to partition first to a neighboring hydrophobic surface positioned at the FGHI cavity opening, followed by the structural rearrangement to the high-energy state that creates a more polar surface that allows benzene to escape into the aqueous environment. In a related T4 lysozyme cavity mutant, L99G, the FGHI path forms a contiguous path to the cavity formed by the mutation site and more polar pocket (Fig. S11); one in which solvent crystal waters are observed to populate the FGHI pocket (50) and highlighting the potential for solvation differences in this region as a result of subtle conformational changes relative to native lysozyme. Although others have noted the importance and likelihood of the FGHI as the benzene egress path (48) based on the deformability of this region upon binding a series of increasing sized congeneric series of ligands (45) and inherent flexibility of the F-helix and V111 in lysozyme, or through direct observation by ABMD simulations of benzene dissociation (48), our observations for the electrostatic surface consequences caused by the structural changes associated with the ground state to excited state transition enhances our understanding of the selectivity of benzene egress for the FGHI path relative to other tunnels identified here and elsewhere.
It does not appear that benzene induces the conformational changes in L99A because identical motions and tunnels or potential pathways are seen for previously published apo L99A simulations (15, 48). These identical motions and tunnels suggest that the experimental off rate is a consequence of the rate required for cooperative motions to sample the sparsely populated higher-energy state. Additionally, the L99A mutant does not elicit a completely unique set of dynamics but rather appears to exaggerate the breathing and quaking motions (51) intrinsic to WT. In WT T4 lysozyme, the dynamics observed in the F-helix and surrounding residues may be important for the threading of the peptide portion of peptidoglycan out of the active site cleft as part of the enzymatic mechanism of T4 lysozyme (52) and substrate processivity. These results have implications for the design of new proteins from WT proteins and for the engineering of dynamical motions in protein interiors through enlargements of cavities near dynamic protein residues.
In an era in which various enhanced sampling methods are being tested for elucidation of rare, long-timescale cooperative conformational events, the aMD employed here was suitable for recapitulating a rare conformational event that occurs on the millisecond timescale experimentally. The aMD approach has been shown to at times produce unreliable free-energy estimates (53), but it has also recapitulated important millisecond-timescale protein conformational dynamics and ligand binding and unbinding events for an array of proteins (21, 54, 55, 56). Additionally, the dynamics reported here with the aMD approach aligns with previous unbiased (conventional) Anton simulations that captured the rare transition to the excited T4 lysozyme state for the apo protein (15). Of interest, both of these simulations were allowed to sample relevant states through cooperative motions that could not be easily defined by a few collective variables through the I0.36 intermediate state previously reported between the ground and excited states (48). It thus appears that for this mutant protein system, enhanced sampling methods that depend upon the definition of a few collective variables and simulations at higher temperatures cannot adequately capture the rare conformational events necessary for ligand unbinding because the mechanism was not known a priori.
Finally, although multiple other pathways for benzene out of the L99A buried cavity likely exist (23), the rates of benzene binding to and from the same pockets differ by orders of magnitude (16, 19, 49). Additionally, given the experimentally determined slow rate of ligand egress, it is unlikely that benzene exits from multiple pathways that are accessible to the ground state unless benzene exit from these other pathways does not adhere to path symmetry. Although path symmetry is known to hold for ligand binding and unbinding events, this can be violated if one of the end states consists of multiple substates (57). Such is the case here for the benzene egress through the FGHI pocket opening because this egress pathway culminates in the excited state of L99A, which is known to consist of multiple substates. In summary, we do not suggest that benzene only egresses from the FGHI pocket, but rather that benzene egress is most probable through the FGHI pocket excited state, as has been seen previously (48), and this is likely due to the electrostatic potential and concerted defects in the buried cavity through this pathway.
Author Contributions
L.C.T.P. and V.A.F. performed aMD simulations. D.M., N.M., J.M.S., and V.A.F. analyzed the aMD simulations. J.M.S. and V.A.F. wrote the manuscript with input from all other authors. R.E.A. is the leading principal investigator.
Acknowledgments
Special thanks to Robert Malmstrom, Cesar de Oliveira, and Betsy Komives for helpful discussions. The authors thank the Keck II Center at the University of California, San Diego and the National Center for Multiscale Modeling of Biological Systems. During review, two articles noting benzene ingress and egress to and from L99A were published (58, 59). The authors wish to acknowledge their contributions to the scientific discourse on this topic despite their omission from our discussion.
This work was funded in part by the Director’s New Innovator Award Program, National Institutes of Health (NIH) DP2 OD007237 to R.E.A. and by National Institutes of Health GM31749 to J.A.M. Funding and support from the National Biomedical Computation Resource is provided through NIH P41 GM103426. J.M.S. was supported by the NIH Molecular Biophysics Training Grant T32 GM008326. R.E.A. has equity interest in and is a cofounder and on the scientific advisory board of Actavalon. V.A.F. has an equity interest in Actavalon.
Editor: Michael Sattler.
Footnotes
Victoria A. Feher and Jamie M. Schiffer contributed equally to this work.
Eleven figures and one video are available at http://www.biophysj.org/biophysj/supplemental/S0006-3495(18)34462-X.
Contributor Information
Victoria A. Feher, Email: feher@schrodinger.com.
Rommie E. Amaro, Email: ramaro@ucsd.edu.
Supporting Material
References
- 1.Baron R., McCammon J.A. Dynamics, hydration, and motional averaging of a loop-gated artificial protein cavity: the W191G mutant of cytochrome c peroxidase in water as revealed by molecular dynamics simulations. Biochemistry. 2007;46:10629–10642. doi: 10.1021/bi700866x. [DOI] [PubMed] [Google Scholar]
- 2.Karplus M., Gelin B.R., McCammon J.A. Internal dynamics of proteins. Short time and long time motions of aromatic sidechains in PTI. Biophys. J. 1980;32:603–618. doi: 10.1016/S0006-3495(80)84993-9. [DOI] [PMC free article] [PubMed] [Google Scholar]
- 3.Wüthrich K., Wagner G. Internal dynamics of proteins. Trends Biochem. Sci. 1984;9:152–154. [Google Scholar]
- 4.Bortolato A., Deflorian F., Mason J.S. Decoding the role of water dynamics in ligand-protein unbinding: CRF1R as a test case. J. Chem. Inf. Model. 2015;55:1857–1866. doi: 10.1021/acs.jcim.5b00440. [DOI] [PubMed] [Google Scholar]
- 5.Dickson A., Lotz S.D. Multiple ligand unbinding pathways and ligand-induced destabilization revealed by WExplore. Biophys. J. 2017;112:620–629. doi: 10.1016/j.bpj.2017.01.006. [DOI] [PMC free article] [PubMed] [Google Scholar]
- 6.Guo D., Pan A.C., IJzerman A.P. Molecular basis of ligand dissociation from the adenosine A2A receptor. Mol. Pharmacol. 2016;89:485–491. doi: 10.1124/mol.115.102657. [DOI] [PubMed] [Google Scholar]
- 7.Sonoda M.T., Martínez L., Polikarpov I. Ligand dissociation from estrogen receptor is mediated by receptor dimerization: evidence from molecular dynamics simulations. Mol. Endocrinol. 2008;22:1565–1578. doi: 10.1210/me.2007-0501. [DOI] [PMC free article] [PubMed] [Google Scholar]
- 8.Swegat W., Schlitter J., Wollmer A. MD simulation of protein-ligand interaction: formation and dissociation of an insulin-phenol complex. Biophys. J. 2003;84:1493–1506. doi: 10.1016/S0006-3495(03)74962-5. [DOI] [PMC free article] [PubMed] [Google Scholar]
- 9.Long D., Mu Y., Yang D. Molecular dynamics simulation of ligand dissociation from liver fatty acid binding protein. PLoS One. 2009;4:e6081. doi: 10.1371/journal.pone.0006081. [DOI] [PMC free article] [PubMed] [Google Scholar]
- 10.Morton A., Baase W.A., Matthews B.W. Energetic origins of specificity of ligand binding in an interior nonpolar cavity of T4 lysozyme. Biochemistry. 1995;34:8564–8575. doi: 10.1021/bi00027a006. [DOI] [PubMed] [Google Scholar]
- 11.Mobley D.L., Graves A.P., Dill K.A. Predicting absolute ligand binding free energies to a simple model site. J. Mol. Biol. 2007;371:1118–1134. doi: 10.1016/j.jmb.2007.06.002. [DOI] [PMC free article] [PubMed] [Google Scholar]
- 12.Kitahara R., Yoshimura Y., Mulder F.A. Detecting O2 binding sites in protein cavities. Sci. Rep. 2016;6:20534. doi: 10.1038/srep20534. [DOI] [PMC free article] [PubMed] [Google Scholar]
- 13.Mann G., Hermans J. Modeling protein-small molecule interactions: structure and thermodynamics of noble gases binding in a cavity in mutant phage T4 lysozyme L99A. J. Mol. Biol. 2000;302:979–989. doi: 10.1006/jmbi.2000.4064. [DOI] [PubMed] [Google Scholar]
- 14.Ucisik M.N., Zheng Z., Merz K.M. Bringing clarity to the prediction of protein-ligand binding free energies via “blurring”. J. Chem. Theory Comput. 2014;10:1314–1325. doi: 10.1021/ct400995c. [DOI] [PMC free article] [PubMed] [Google Scholar]
- 15.Schiffer J.M., Feher V.A., Amaro R.E. Capturing invisible motions in the transition from ground to rare excited states of T4 lysozyme L99A. Biophys. J. 2016;111:1631–1640. doi: 10.1016/j.bpj.2016.08.041. [DOI] [PMC free article] [PubMed] [Google Scholar]
- 16.Mulder F.A., Mittermaier A., Kay L.E. Studying excited states of proteins by NMR spectroscopy. Nat. Struct. Biol. 2001;8:932–935. doi: 10.1038/nsb1101-932. [DOI] [PubMed] [Google Scholar]
- 17.Eriksson A.E., Baase W.A., Matthews B.W. Response of a protein structure to cavity-creating mutations and its relation to the hydrophobic effect. Science. 1992;255:178–183. doi: 10.1126/science.1553543. [DOI] [PubMed] [Google Scholar]
- 18.Morton A., Matthews B.W. Specificity of ligand binding in a buried nonpolar cavity of T4 lysozyme: linkage of dynamics and structural plasticity. Biochemistry. 1995;34:8576–8588. doi: 10.1021/bi00027a007. [DOI] [PubMed] [Google Scholar]
- 19.Feher V.A., Baldwin E.P., Dahlquist F.W. Access of ligands to cavities within the core of a protein is rapid. Nat. Struct. Biol. 1996;3:516–521. doi: 10.1038/nsb0696-516. [DOI] [PubMed] [Google Scholar]
- 20.Fuglestad B., Gasper P.M., Komives E.A. The dynamic structure of thrombin in solution. Biophys. J. 2012;103:79–88. doi: 10.1016/j.bpj.2012.05.047. [DOI] [PMC free article] [PubMed] [Google Scholar]
- 21.Pierce L.C., Salomon-Ferrer R., Walker R.C. Routine access to millisecond time scale events with accelerated molecular dynamics. J. Chem. Theory Comput. 2012;8:2997–3002. doi: 10.1021/ct300284c. [DOI] [PMC free article] [PubMed] [Google Scholar]
- 22.Abrams C., Bussi G. Enhanced sampling in molecular dynamics using metadynamics, replica-exchange, and temperature-acceleration. Entropy. 2014;16:163–199. [Google Scholar]
- 23.Nunes-Alves A., Zuckerman D.M., Arantes G.M. Escape of a small molecule from inside T4 lysozyme by multiple pathways. Biophys. J. 2018;114:1058–1066. doi: 10.1016/j.bpj.2018.01.014. [DOI] [PMC free article] [PubMed] [Google Scholar]
- 24.Hamelberg D., Mongan J., McCammon J.A. Accelerated molecular dynamics: a promising and efficient simulation method for biomolecules. J. Chem. Phys. 2004;120:11919–11929. doi: 10.1063/1.1755656. [DOI] [PubMed] [Google Scholar]
- 25.Nicholson H., Anderson D.E., Matthews B.W. Analysis of the interaction between charged side chains and the α-helix dipole using designed thermostable mutants of phage T4 lysozyme. Biochemistry. 1991;30:9816–9828. doi: 10.1021/bi00105a002. [DOI] [PubMed] [Google Scholar]
- 26.Eriksson A.E., Baase W.A., Matthews B.W. Similar hydrophobic replacements of Leu99 and Phe153 within the core of T4 lysozyme have different structural and thermodynamic consequences. J. Mol. Biol. 1993;229:747–769. doi: 10.1006/jmbi.1993.1077. [DOI] [PubMed] [Google Scholar]
- 27.Matsumura M., Matthew B.W. Control of enzyme activity by an engineered disulfide bond. Science. 1989;243:792–794. doi: 10.1126/science.2916125. [DOI] [PubMed] [Google Scholar]
- 28.Case D.A., Cheatham T.E., III, Woods R.J. The Amber biomolecular simulation programs. J. Comput. Chem. 2005;26:1668–1688. doi: 10.1002/jcc.20290. [DOI] [PMC free article] [PubMed] [Google Scholar]
- 29.Götz A.W., Williamson M.J., Walker R.C. Routine microsecond molecular dynamics simulations with AMBER on GPUs. 1. generalized born. J. Chem. Theory Comput. 2012;8:1542–1555. doi: 10.1021/ct200909j. [DOI] [PMC free article] [PubMed] [Google Scholar]
- 30.Horn H.W., Swope W.C., Head-Gordon T. Development of an improved four-site water model for biomolecular simulations: TIP4P-Ew. J. Chem. Phys. 2004;120:9665–9678. doi: 10.1063/1.1683075. [DOI] [PubMed] [Google Scholar]
- 31.Hornak V., Abel R., Simmerling C. Comparison of multiple Amber force fields and development of improved protein backbone parameters. Proteins. 2006;65:712–725. doi: 10.1002/prot.21123. [DOI] [PMC free article] [PubMed] [Google Scholar]
- 32.Lindorff-Larsen K., Piana S., Shaw D.E. Improved side-chain torsion potentials for the Amber ff99SB protein force field. Proteins. 2010;78:1950–1958. doi: 10.1002/prot.22711. [DOI] [PMC free article] [PubMed] [Google Scholar]
- 33.Darden T., York D., Pedersen L. Particle mesh Ewald: an Nlog(N) method for Ewald sums in large systems. J. Chem. Phys. 1993;98:10089. [Google Scholar]
- 34.Han B., Liu Y., Wishart D.S. SHIFTX2: significantly improved protein chemical shift prediction. J. Biomol. NMR. 2011;50:43–57. doi: 10.1007/s10858-011-9478-4. [DOI] [PMC free article] [PubMed] [Google Scholar]
- 35.Humphrey W., Dalke A., Schulten K. VMD: visual molecular dynamics. J. Mol. Graph. 1996;14:33–38, 27–28.. doi: 10.1016/0263-7855(96)00018-5. [DOI] [PubMed] [Google Scholar]
- 36.Chemical Computing Group . Montreal, Canada; 2011. Molecular Operating Environment (MOE), version 2011.10. [Google Scholar]
- 37.Roe D.R., Cheatham T.E., 3rd PTRAJ and CPPTRAJ: software for processing and analysis of molecular dynamics trajectory data. J. Chem. Theory Comput. 2013;9:3084–3095. doi: 10.1021/ct400341p. [DOI] [PubMed] [Google Scholar]
- 38.Durrant J.D., de Oliveira C.A., McCammon J.A. POVME: an algorithm for measuring binding-pocket volumes. J. Mol. Graph. Model. 2011;29:773–776. doi: 10.1016/j.jmgm.2010.10.007. [DOI] [PMC free article] [PubMed] [Google Scholar]
- 39.Dolinsky T.J., Nielsen J.E., Baker N.A. PDB2PQR: an automated pipeline for the setup of Poisson-Boltzmann electrostatics calculations. Nucleic Acids Res. 2004;32:W665–W667. doi: 10.1093/nar/gkh381. [DOI] [PMC free article] [PubMed] [Google Scholar]
- 40.Sitkoff D., Sharp K.A., Honig B. Accurate calculation of hydration free energies using macroscopic solvent models. J. Phys. Chem. 1994;98:1978–1988. [Google Scholar]
- 41.Mulder F.A., Hon B., Kay L.E. Flexibility and ligand exchange in a buried cavity mutant of T4 lysozyme studied by multinuclear NMR. Biochemistry. 2000;39:12614–12622. doi: 10.1021/bi001351t. [DOI] [PubMed] [Google Scholar]
- 42.McIntosh L.P., Griffey R.H., Dahlquist F.W. Proton NMR measurements of bacteriophage T4 lysozyme aided by 15N isotopic labeling: structural and dynamic studies of larger proteins. Proc. Natl. Acad. Sci. USA. 1987;84:1244–1248. doi: 10.1073/pnas.84.5.1244. [DOI] [PMC free article] [PubMed] [Google Scholar]
- 43.Xue M., Kitahara R., Mulder F.A. Aberrant increase of NMR signal in hydrogen exchange experiments. Observation and explanation. Biochem. Biophys. Res. Commun. 2016;478:1185–1188. doi: 10.1016/j.bbrc.2016.08.092. [DOI] [PubMed] [Google Scholar]
- 44.Baase W.A., Liu L., Matthews B.W. Lessons from the lysozyme of phage T4. Protein Sci. 2010;19:631–641. doi: 10.1002/pro.344. [DOI] [PMC free article] [PubMed] [Google Scholar]
- 45.Merski M., Fischer M., Shoichet B.K. Homologous ligands accommodated by discrete conformations of a buried cavity. Proc. Natl. Acad. Sci. USA. 2015;112:5039–5044. doi: 10.1073/pnas.1500806112. [DOI] [PMC free article] [PubMed] [Google Scholar]
- 46.Miao Y., Feher V.A., McCammon J.A. Gaussian accelerated molecular dynamics: unconstrained enhanced sampling and free energy calculation. J. Chem. Theory Comput. 2015;11:3584–3595. doi: 10.1021/acs.jctc.5b00436. [DOI] [PMC free article] [PubMed] [Google Scholar]
- 47.Wang K., Chodera J.D., Shirts M.R. Identifying ligand binding sites and poses using GPU-accelerated Hamiltonian replica exchange molecular dynamics. J. Comput. Aided Mol. Des. 2013;27:989–1007. doi: 10.1007/s10822-013-9689-8. [DOI] [PMC free article] [PubMed] [Google Scholar]
- 48.Wang Y., Papaleo E., Lindorff-Larsen K. Mapping transiently formed and sparsely populated conformations on a complex energy landscape. eLife. 2016;5:e17505. doi: 10.7554/eLife.17505. [DOI] [PMC free article] [PubMed] [Google Scholar]
- 49.Mulder F.A., Skrynnikov N.R., Kay L.E. Measurement of slow (micros-ms) time scale dynamics in protein side chains by (15)N relaxation dispersion NMR spectroscopy: application to Asn and Gln residues in a cavity mutant of T4 lysozyme. J. Am. Chem. Soc. 2001;123:967–975. doi: 10.1021/ja003447g. [DOI] [PubMed] [Google Scholar]
- 50.Wray J.W., Baase W.A., Matthews B.W. Structural analysis of a non-contiguous second-site revertant in T4 lysozyme shows that increasing the rigidity of a protein can enhance its stability. J. Mol. Biol. 1999;292:1111–1120. doi: 10.1006/jmbi.1999.3102. [DOI] [PubMed] [Google Scholar]
- 51.Miyashita O., Onuchic J.N., Wolynes P.G. Nonlinear elasticity, proteinquakes, and the energy landscapes of functional transitions in proteins. Proc. Natl. Acad. Sci. USA. 2003;100:12570–12575. doi: 10.1073/pnas.2135471100. [DOI] [PMC free article] [PubMed] [Google Scholar]
- 52.Akhterov M.V., Choi Y., Collins P.G. Observing lysozyme’s closing and opening motions by high-resolution single-molecule enzymology. ACS Chem. Biol. 2015;10:1495–1501. doi: 10.1021/cb500750v. [DOI] [PMC free article] [PubMed] [Google Scholar]
- 53.Wereszczynski J., Mccammon J.A. Using selectively applied accelerated molecular dynamics to enhance free energy calculations. J. Chem. Theory Comput. 2010;6:3285–3292. doi: 10.1021/ct100322t. [DOI] [PMC free article] [PubMed] [Google Scholar]
- 54.Bucher D., Grant B.J., McCammon J.A. Accessing a hidden conformation of the maltose binding protein using accelerated molecular dynamics. PLoS Comput. Biol. 2011;7:e1002034. doi: 10.1371/journal.pcbi.1002034. [DOI] [PMC free article] [PubMed] [Google Scholar]
- 55.Gasper P.M., Fuglestad B., McCammon J.A. Allosteric networks in thrombin distinguish procoagulant vs. anticoagulant activities. Proc. Natl. Acad. Sci. USA. 2012;109:21216–21222. doi: 10.1073/pnas.1218414109. [DOI] [PMC free article] [PubMed] [Google Scholar]
- 56.Galloway D.A., Laimins L.A., Hutchinson F. Accelerated molecular dynamics simulations of ligand binding to a muscarinic G-protein-coupled receptor. 2016;48:87–92. doi: 10.1017/S0033583515000153. [DOI] [PMC free article] [PubMed] [Google Scholar]
- 57.Bhatt D., Zuckerman D.M. Beyond microscopic reversibility: are observable non-equilibrium processes precisely reversible? J. Chem. Theory Comput. 2011;7:2520–2527. doi: 10.1021/ct200086k. [DOI] [PMC free article] [PubMed] [Google Scholar]
- 58.Mondal J., Ahalawat N., Vallurupalli P. Atomic resolution mechanism of ligand binding to a solvent inaccessible cavity in T4 lysozyme. PLoS Comput. Biol. 2018;14:e1006180. doi: 10.1371/journal.pcbi.1006180. [DOI] [PMC free article] [PubMed] [Google Scholar]
- 59.Wang Y., Valsson O., Lindorff-Larsen K. Frequency adaptive metadynamics for the calculation of rare-event kinetics. J. Chem. Phys. 2018;149:072309. doi: 10.1063/1.5024679. [DOI] [PubMed] [Google Scholar]
Associated Data
This section collects any data citations, data availability statements, or supplementary materials included in this article.