

Abstract
Fluorotelomer alcohols (FTOHs), perfluorooctane-sulfonamidoethanols (FOSEs), perfluorooctane-sulfonamides (FOSAs) and other poly- and perfluorinated alkyl substances (PFASs) are common and ubiquitous by-products of industrial telomerization processes. They can degrade into various perfluorinated carboxylic acids, which are persistent organic contaminants of concern. This study assessed the use of polyethylene (PE) passive samplers as a sampling tool for neutral PFAS precursors during field-deployments in air and water. A wide range of neutral PFASs was detected in PE sheets exposed in waste water treatment effluents in August 2017. Equilibration times for most neutral PFASs was on the order of 1–2 weeks. Based on known sampling rates, the partitioning constants between PE and water, KPEw, were derived. Log Kpew values were mostly in the range of 3 – 4.5, with greatest values for 8:2 FTOH, 10:2 FTOH and n-ethyl-FOSE. To test the utility of PE for gas-phase compounds, parallel active and passive sampling was performed in ambient air in Providence (RI, USA) in April 2016. Most PFASs equilibrated within 2–7 days. Greatest concentrations in PE samplers were detected for MeFOSE and EtFOSE. Polyethylene-air partitioning constants, log KpEa, were ~ 7–8 for the FTOHs, and approached 9 for n-methyl-FOSA and n-methyl-FOSE. PE sheets showed promise as a passive sampling approach for neutral PFASs in air and water.
Keywords: PFASs, FTOHs, passive sampler, dissolved concentration, gas-phase
Graphical abstract
INTRODUCTION
Fluorinated compounds have become distributed across the globe over the past half-century, as increasing industrial production of synthetic organic compounds containing fluorine has led to their introduction into the environment (Key et al. 1997). In general, per- and polyfluorinated alkyl substances (PFASs) repel oil and water, and are considered surfactants. These surfactant properties have been applied to a wide number of commercial and industrial applications including paper, textiles, paints, non-stick cookware, polishes, electronics, and water-repellant clothing (Kissa 1994).
Two key PFASs, perfluorooctanesulfonic acid (PFOS) and perfluorooctanoic acid (PFOA) have been targeted as persistent organic pollutants (POPs) due to their physicochemical properties, their global distribution, and demonstrated adverse effects in wildlife and humans. Elevated PFOS concentrations have been found present in wildlife tissue at polar sites in both the Arctic and in the Antarctic (Giesy and Kannan 2001; Houde et al. 2006; Houde et al. 2011). PFOS is ionic at ambient pH and has thus a low vapor pressure and high water solubility compared to other POPs (Giesy and Kannan 2002; Krusic et al. 2005), and would not be expected to be transported long distances via the atmosphere. PFASs have been detected in surface waters of the Arctic Ocean in the range of 100 pg/L, indicating long-range transport is occurring (Yamashita et al. 2008; Yeung et al. 2017). Yet ocean transport is not sufficient to explain observed concentrations in the Arctic Ocean, particularly in the surface ocean (Yeung et al. 2017). A secondary atmospheric source of PFOS and PFOA from the degradation of precursor compounds, such as fluorotelomer alcohols (FTOHs), perfluorinated sulfonamidoethanols (FOSEs) and sulfonamides (FOSAs), has been suggested to account for the presence of ionic PFASs in remote regions (Hurley et al. 2004; Wallington et al. 2006). Hydroxyl radical attack on these precursors is very slow and atmospheric lifetimes range from 10–20 days for FTOHs of varying carbon length and from 20–50 days for selected FOSAs (Stock et al. 2004; Piekarz et al. 2007). The estimated atmospheric residence time for 8:2 FTOH is greater than 50 days (Wania 2007). A 10–50 day lifetime is sufficient to allow for hemispheric transport to the Arctic from primary source regions (Ellis et al. 2004; Wallington et al. 2006).
The majority of studies that observe FTOHs and PFASs in the environment utilize active sampling methods (Jahnke, Huber, et al. 2007; Ahrens, Shoeib, Harner, Lane, et al. 2011; Liu et al. 2013). These methods typically require a large amount of sample media to be collected (e.g. air, water, etc.) to quantify the low (pg range) environmental concentrations that are found. For these experimental set-ups, a large volume of media is pulled through a filter and adsorbent on which the POPs collect over time. Active sampling is expensive and time consuming, prohibiting the widespread monitoring of these compounds.
In recent years, a variety of passive sampling techniques have been developed to measure many POPs in the environment (Harner et al. 2006; Jahnke, Ahrens, et al. 2007; Lohmann et al. 2012). Several studies have relied on passive sampling for the detection of neutral, volatile PFASs. In particular polyurethane foam (PUF) discs, often sorbent-impregnated, have been used repeatedly (Genualdi et al. 2010; Kim et al. 2012; Ahrens et al. 2013; Wang et al. 2018), but also, activated carbon felts (S Oono et al. 2008; Liu et al. 2013), and semi-permeable membrane devices (SPMDs) (Fiedler et al. 2010). In contrast, the use of single phase polymers, such as silicone-rubber based samplers or polyethylene sheets (PE) has not been explored for neutral, volatile PFASs.
PE sampling devices accumulate organic contaminants through diffusion. Due to its reliance on diffusion, PE samplers inherently select only for gaseous compounds in the air and dissolved compounds in the water (Adams et al. 2007). In comparison to many active and passive methods, PE sheets are best at accumulating hydrophobic organic contaminants, cost little, and are easy to handle and use (Lohmann et al. 2012). In addition, the ability to measure both aqueous and atmospheric concentrations at sampling sites provides insight into the transport processes that control a compound’s movement through the environment and the quantification of air-water fluxes (Morgan and Lohmann 2008; Khairy et al. 2014; McDonough et al. 2014). The passive uptake of a water or air contaminant by a passive samplers is a well characterized process (Vrana et al. 2001; Bartkow et al. 2005):
| (1) |
where
Ns is the amount or pollutant absorbed (pg);
Rs is sampling rate (L/day);
t is exposure time (day);
ms is the passive sampler mass (kg);
KPEw is the PE-water partitioning constant (L/kg); and
Ct is the ambient concentration (pg/L).
Initially, the uptake is linear, simply a function of the sampling rate (Rs) and ambient concentration, Ct. As the exposure time increases, the target compounds in the sampler approach equilibrium, and the amount absorbed can be expressed by the PE-water (KPEw) or PE-air partitioning coefficient (KPEa):
| (2) |
where
Cw and Ca are the ambient dissolved or gas-phase concentrations (pg/L).
The uptake stage is dependent on the magnitude of Kpew or KpEa, and environmental mass transfer coefficients.
The overarching goal for this research was the field-testing of PE as a simple sampling technique for the monitoring of neutral PFASs. In particular, our goals were to (i) determine whether PE passive samplers enrich PFASs in air and water sufficiently for detection; (ii) estimate PE-water and PE-air partitioning coefficients, and compare them to predicted values; and (iii) discuss if and how PE samplers can be used for the quantification of volatile, neutral PFASs.
MATERIALS AND METHODS
Target compounds
This study targeted 9 individual neutral PFASs, specifically fluorotelomer alcohols (FTOHs), fluorotelomer acrylates (FTAcrs), perfluorinated sulfonamidoethanols (FOSEs) and sulfonamides (FOSAs), ranging in molecular weight from 364 – 619 g/mol (Table 1). Native and mass-labeled surrogate standards (13C12-6:2 FTOH, 13C12-8:2 FTOH, 13C12-10:2 FTOH, MeFOSA-d3, and MeFOSE-d7) were purchased from Wellington Laboratories (Guelph, Ontario, Canada).
Table 1.
Compounds investigated in this study with corresponding molecular weights and blank concentrations
| Name | Abbrevation | Molecular Weight (g/mol) |
Average PE blank (pg/gPE)a |
Average PUF blank amount (pg)a |
|---|---|---|---|---|
| 6:2 Fluorotelomer alcohol | 6:2 FTOH | 364.10 | 23 ± 16 | 420 ± 240 |
| 8:2 Fluorotelomer alcohol | 8:2 FTOH | 464.12 | 26 ± 17 | 760 ± 640 |
| 10:2 Fluorotelomer alcohol | 10:2 FTOH | 564.13 | 71 ± 28 | 1,800 ± 1,500 |
| N-methyl perfluorooctane sulfonamide | MeFOSA | 513.17 | 210 ± 200 | 190 ± 110 |
| N-ethyl perfluorooctane sulfonamide | EtFOSA | 527.20 | 870 ± 780 | 130 ± 100 |
| N-methyl perfluorooctane sulfonamidoethanol | MeFOSE | 557.22 | 34 ± 21 | 560 ±380 |
| N-ethyl perfluorooctane sulfonamidoethanol | EtFOSE | 571.25 | 49 ± 15 | 360 ±300 |
| 8:2 Fluorotelomer acrylate | 8:2 FTAcr | 518.17 | 24 ± 25 | 160 ± 50 |
| 10:2 Fluorotelomer acrylate | 10:2 FTAcr | 618.19 | 14 ± 11 | 90 ± 40 |
average ± 1 standard deviation
A master solution containing the PFAS surrogates was mixed at 1000 ng/ml in 8:2:1 hexane:DCM:methanol, of which 25 μl (at 50 ng/mL) were added prior to extraction.
Instrumental analysis
All samples were analyzed using gas chromatography/mass spectrometry (GC/MS) on an Agilent 7890B chromatograph coupled with an Agilent 5977A MSD operating in positive chemical ionization (PCI) mode using selected-ion-monitoring (SIM). The ion source was held at 300 °C while the transfer line was held at 250 °C. Aliquots of 2 μL were injected via an autosampler. A splitless intake (270 °C) led into a polar Supelcowax 10 column (60 m, internal diameter 10 μm). Gas flow of the helium carrier gas was held at 1.5 mL/min. The oven-temperature program was derived based on a published method (Xie et al. 2013), and optimized for shorter run times. The program was as follows: 50 °C for 2 min, 3 °C/min to 70 °C, 10 °C to 130 °C, 20 °C/min to 220 °C, 120 °C/in to 275 °C hold for 5 minutes, −10 °C/min to 270 °C hold for 10 minutes.
Polyethylene passive samplers
The passive samplers used in this research consisted of low-density polyethylene (PE), 25 μm (1 mil) in thickness, of around 0.9 g each for air (~ 10 cm × 40 cm), and ~ 1.6 g for WWTP deployments (~ 15 cm × 45 cm). The PE was manufactured by a commercial sheeting company (Covalence Plastics, IN., Minneapolis, MN, USA). PE samplers were cleaned by sequential extractions using acetone, dichloromethane, and twice hexane for 24 hours per solvent.
Sample processing and analysis took place in a clean lab at the University of Rhode Island (URI). All glassware was rinsed with acetone, hexane, and DCM (~10 mL each) and then baked for at least 8 hours at 450 °C. XAD (Sigma-Aldrich) and XAD sandwiched between 2 PUF plugs (8 cm length × 9 cm diameter, Tisch Environmental, Cleves, OH, USA) sandwiches were extracted in a Soxhlet apparatus using ~150 mL of hexane for 24 hours. PEs were extracted in individual 60 mL amber vials using ~55 mL of hexane for 24 hours. Extracts were concentrated first on a Rotovap to a few mL and then under a mild nitrogen stream to ~200 μL. After which, 40 ng p-terphenyl-d14 was added as an injection standard.
Field deployments
Aqueous deployments of PE samplers were performed in September of 2016 at the South Kingston Waste Water Treatment Plant (WWTP), Narragansett, RI, USA. Ambient temperatures ranged from 22 – 24 °C; water flow was around 2 million gallons per day (~ 3,800 m3/day) (see SI Table 2). PE passive samplers were submerged in the effluent outflow of the WWTP (Figure S1) for 1, 2, 4, 7, 14, and 21 days; at which time 3 sheets each were collected, plus a field blank. Prior to extraction, each PE sheet was wiped with Kimwipes to remove the biofouling. Active sampling using a pump filtered ~ 20 L per day through a filter-PUF plug combination. The PUF plugs were Soxhlet extracted, followed by a silica gel column clean-up, but poor chromatography prevented the quantification of PFASs in these samples. Sampling rates (Rs) for aqueous PE-samplers were derived based on loss of performance reference compounds (PRCs) (Booij et al. 2002). Three deuterated PAHs (fluorene-d10, pyrene-d10 and benzo(a)pyrene-d12) were used as PRCs; average PRC losses were 97% for fluorene-d10, 61% for pyrene-d10 and 2% for benzo(a)pyrene-d12. Sampling rates (Rs) were calculated as detailed in previous studies (Carrie A McDonough et al. 2016). In the WWTP deployments performed here, Rs averaged 28.1 ± 4.4 L/day.
Air sampling site was performed at an active monitoring site for the RI Department of Environmental Management in eastern Providence, (RI, USA) in April 2016. A pump-operated high volume air sampler (TE-PNY-1123, Tisch Environmental, USA) was deployed on the roof of a 4-storey building using two PUF plugs with XAD sandwiched in-between to collect targets PFASs (Figure S3). Passive air samplers were co-located and deployed on top of the roof at a height of 1 meter. Each passive sampler consisted of a PE sheet placed inside an inverted, pre-cleaned stainless steel bowl (Figure S4). The PE sheet was oven onto a stainless steel wire, which was used to fasten the sheet to the rope holding the stainless steel in-place. Passive PE sheets were deployed for 2, 4, 8, 16 and 32 days. Active air samples were sampled continuously for 48 hours each during the 32 day experiment. Temperatures averaged 13–19 °C; wind speed varied from 7–12 m/s (see SI Table 3). The average high-volume sampling rate was 24 m3/hour (based on flow measurements at the beginning and end of each sample). Passively and actively collected sample media, plus field blanks, were wrapped in baked aluminum foil, placed in an airtight bag and stored in a cooler surround with ice packs during transport. Samples were transported to the URI Bay Campus and placed in a 0 °C refrigerator until analysis.
Quality control
A 5-point standard calibration curve for the native compounds and surrogate compounds was created and used to derive relative response factors (linear, non-weighed regression, r2 ranged from 0.94–0.99). Results were recovery-corrected to the nearest surrogate standard (6:2 FTOH-d4 for 6:2 FTOH, 8:2 FTOH-d4 for 8:2 FTOH, 10:2 FTOH-d4 for 10:2 FTOH, MeFOSA-d3 for MeFOSA and EtFOSA, and MeFOSE-d7 for MeFOSE and EtFOSE). Recoveries of the surrogate standards were 80 ±48% for 13C12-6:2 FTOH, 72 ±23% for 13C12-8:2 FTOH, 75 ±32% for 13C12-10:2 FTOH, 88 ±29% for MeFOSA-d3, and 87 ±32% for MeFOSE-d7. Recoveries tended to be greater for active sampling media (PUFs: 70–123%; PEs: 27–121%).
Detection limits
Instrumental detection limits (IDLs) based on the least detectable amount on the GC were ≤ 30 pg on column (except for 6:2 and 8:2 FTOHs with 100 and 400 pg, see SI Table 1). Average blank values were below 0.1 ng/g PE, except for MeFOSA (0.4 ng/g PE) and EtFOSA (0.1 ng/g PE) in the WWTP field blanks. PFAS amounts in samples exceeded blanks typically by at least 10-fold, so results were not blank-corrected. Method detection limits (MDLs) for PE samplers based on mean field blank concentrations + 3 standard deviations (n=10) were around 0.1 ng/g PE, except for MeFOSA (0.8 ng/g PE) and EtFOSA (0.3 ng/g PE) (Table 1). Five PUF-XAD blanks were run to determine blank concentrations (Table 1) and derive MDLs, ranging from 0.1 – 4.6 ng/sample.
Uncertainty of Kpew values
The uncertainty of the KPEw values represents the analytical uncertainty from the replicates at each time point and the reliance of Rs values derived from d-PAHs. There is a systemic deviation of a Rs values for specific compounds, with decreasing Rs for increasing molecular weight (MW) or molar volume (Vm) (e.g., (Lohmann et al. 2012). All neutral PFASs considered here possess larger MW and Vm than the d-PAHs used as PRCs. Relative to d-pyrene, Rs values of neutral PFASs are lower by an average of 39% (see SI Table 4).
RESULTS AND DISCUSSION
Passive sampling of PFASs in WWTP effluent
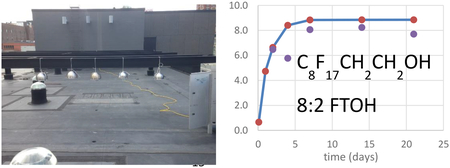
All of the target compounds were detected in the PE passive samplers, at concentrations well above those in blank samplers, except 10:2 FTAcr. The compound detected in the highest concentration throughout the field study was MeFOSA, with the PEs accumulating an average of 140 ng/g PE (Figure 1, SI Table 5), followed by 8:2 FTAcr and 10:2 FTOH at around 30 ng/g PE. Other PFASs were at or below 10 ng/g PE.
Figure 1:

Measured (triplicates) versus modeled (solid line) PE-concentrations (ng/g) of (a) 10:2 FTOH, (b) 8:2 FTOH; (c) EtFOSE and (d) MeFOSE placed in effluents of a wastewater treatment plant over time.
The time-curve of compound uptake by PE samplers displayed increasing concentrations from day 2 to day 21, by 2 to 5-fold, in-line with expectations of accumulation profiles in passive samplers. The notable exception was 8:2 FTOH, which displayed no significant change in concentrations during the deployment period. The measured uptake of 10:2 FTOH followed the theoretical uptake quite well and approached equilibrium (Figure 1). Uptake curves for MeFOSE and EtFOSE showed that they reached equilibrium within the PE samplers within a week (Figure 1).
We experienced problems with determining concentrations from concurrent active sampling of WWTP effluents using PUF plugs (collecting 20 L), with residual water and residues resulting in poor chromatography. The equilibrium partitioning constants between PE and water, Kpew, were thus determined using a different approach. Knowing the sampling rate of the PE sheets from the loss of PRCs, we thus estimated the two remaining unknowns, Kpew and Cw, in Microsoft Excel with the Solver using the least square difference between model curve and measurements. This approach estimated KPEw, as it is solely responsible for the shape of the uptake curve (the Cw, term only affects the maximum concentration accumulated in the sampler, but not the curvature of the modeled uptake curve). Two approaches were used - an unweighed least square regression (LSR) for each sampling time between measured and modeled PE-concentrations, and a weighed LSR approach where the difference between measured and modeled was normalized to the average PE concentrations to give more weight to the initial data points. To account for the discrepancy between the use of d-PAHs as PRCs, and the higher molecular weights of the neutral PFASs, deduced Rs values were reduced by 39% (see SI Table 8).
Derived log Kpew for FTOHs increased from 2.7–3.5 (6:2), 4.3–4.4 (8:2) to 4.5–4.7 (10:2 FTOH) (Table 2). These results imply an average increase of around 0.7 in log Kpew per C2F4 unit. Log Kpew increased from 3.5–3.9 for MeFOSA to 4.1–4.4 for EtFOSA, and from 3.0–3.7 for MeFOSE to 3.1–4.2 for EtFOSE (Table 2). Addition of a CH2-unit (Me to Et-FOSA or-FOSE) increased log Kpew by 0.44 units on average, similar to reported increases of log Kpew by 0.4–0.5 for each additional alkyl carbon (Choi et al. 2013; Reitsma et al. 2013). Derived values of Kpew were 4.3 – 4.8 for 8:2FtAcr (Table 2). The uncertainties of the Kpew values derived (mostly 0.1 log units) here stem from the analytical uncertainty (average 36%).
Table 2. Estimated log Kpew values from this study with single standard deviations, and predicted values based on pp-LFER approaches.
(These values were derived using a 39% reduced sampling rate)
| log KPEw1 | log KPEw2 | pp-LFER3 | |
|---|---|---|---|
| 6:2 FTOH | 3.5 ± 0.1 | 2.7 ± 0.1 | 3.3 |
| 8:2 FTOH | 4.4 ± 0.1 | 4.3 ± 0.1 | 5.0 |
| 10:2 FTOH | 4.6 ± 0.1 | 4.5 ± 0.1 | 6.7 |
| 8:2 FTAcr | 4.8 ± 0.2 | 4.3 ± 0.2 | - |
| 10:2 FTAcr | 5.3$ | 4.7$ | - |
| MeFOSA | 3.9 ± 0.1 | 3.5 ± 0.1 | - |
| EtFOSA | 4.4 ± 0.1 | 4.1 ± 0.1 | - |
| MeFOSE | 3.7 ± 0.1 | 3.0 ± 0.1 | - |
| EtFOSE | 4.2 ± 0.1 | 3.1 ± 0.1 | - |
from unweighed LSR; uncertainty reflects analytical variability
from weighed LSR; uncertainty reflects analytical variability
Kpew for 10:2 FTAcr was estimated relative to 8:2 FTAcr with an increase of 0.5 log units
For comparison, KPEw values were predicted for the FTOHs based on hexadecane-water partitioning using poly-parameter-linear free energy relationships (LFERs) (Endo and Goss 2014a; Endo and Goss 2014b). Predicted Kpew values varied much more than our field-derived data; there is no information available for the other neutral PFASs as far as we know. In a previous comparison of measured versus pp-LFER predicted KPEw values for polar compounds, the prediction via pp-LFER was not as good as other modeling approaches (Hale et al. 2010; Sacks and Lohmann 2011).
Our study is the first to report detectable aqueous concentrations of MeFOSA, EtFOSA, 8:2 FTAcr, MeFOSE, and EtFOSE in a passive sampler deployed in a WWTP outflow. We derived dissolved concentrations for our study site based on the Kpew values above. Dissolved concentrations were at or below 1 ng/L for most compounds. Greater concentrations were derived for 6:2 FTOH (1–3 ng/L) and MeFOSA (14–30 ng/L).
There are only a few studies that have reported values for FTOH concentrations in WWTP water effluent (Table 3). The concentrations reported in Duachy et al. 2017 were measured in the WWTP of a fluoropolymer-production plant and as such reflect significantly higher concentrations than would be expected for a residential WWTP. Mahmoud et al. 2009 reported aqueous concentrations similar to what was found in this study. Several studies attempted to measure the concentrations of MeFOSA and EtFOSA in WWTP effluent, but in all cases were below detection limits (Ma and Shih 2010; Arvaniti et al. 2012; Stasinakis et al. 2013). For FTOHs, 8:2 FTAcr and MeFOSA, dissolved concentrations derived here were in the range previously reported from other locations around the world, while we found no data to compare to for MeFOSE and EtFOSE (Table 3).
Table 3.
Comparison of aqueous concentrations of neutral PFASs (ng/L) in WWTP effluents from selected studies (based on active sampling) to results from this study using passive samplers.
| Sampling Location | France | South Korea | China | Yamato, Japan | South Kingston, RI |
|---|---|---|---|---|---|
| Reference | (Dauchy et al. 2017) | (Kwon et al. 2017) | (Chen et al. 2017) | (Mahmoud et al. 2009) | this study using passive samplers1 |
| Water type | Raw effluent from WWTP flotation tank with fluorochemical industry influents | Effluent from 81 Korean WWTPs | Effluent from 12 Chinese WWTPs | River water and WWTP effluents | WWTP effluent |
| 6:2 FTOH | 11–110 | N/A | 0.64 (0.49–0.98) | N/A | 1.0 – 3.2 |
| 8:2 FTOH | 13–4300 | N/A | 5.3 (3.1–12) | 1.4±1.1 | 0.35 – 0.40 |
| 10:2 FTOH | 14–1800 | N/A | 1.1 (<0.03–4.6) | 1.2±2.0 | 0.71 – 0.94 |
| 8:2 FTAcr | N/A | N/A | N/A | 0.1±0.1 | 0.63 – 1.0 |
| EtFOSA | < 20 | ~ 0.7 | N/A | N/A | 0.39 – 0.58 |
| MeFOSA | < 20 | N/A | N/A | N/A | 14 – 30 |
| EtFOSE | N/A | N/A | N/A | N/A | 0.11 – 0.52 |
| MeFOSE | N/A | N/A | N/A | N/A | 0.35 – 1.2 |
N/A - not analyzed
best-fitted results from unweighed or weighed LSR.
Neutral PFASs from active air sampling
Gas-phase concentrations of volatile PFASs in Providence were dominated by the FTOHs, each around 10 pg/m3, followed by MeFOSE and EtFOSE at around 1–2 pg/m3. MeFOSA was detected mostly below 1 pg/m3, while EtFOSA was < IDL throughout. Traces of the 10:2 FtAcr were detected, close to the IDL at around 0.1 pg/m3, with 8:2 FtAcr always < IDL (Table 3). Within the FTOHs, 8:2 FTOH displayed greatest average concentrations (16 pg/m3), followed by 6:2 FTOH (11 pg/m3) and 10:2 FTOH (9.9 pg/m3). FTOHs varied in their concentrations by an order of magnitude across the study, but they all exhibit minimum values during the middle of the sampling period. The relative abundances of the FTOHs varied throughout the sampling campaign, though 8:2 FTOH was always more abundant than 10:2 FTOH, but the ratio of 6:2 to 8:2 FTOH varied from 2:1 to 1:3.
The atmospheric concentrations found in eastern Providence (RI, USA) for FTOHs using active sampling tended to be lower than several other urban studies (SI Table 7) by a wide range. Concentrations from Providence were lower by a factor of 2 compared to 2006 results for Toronto (Canada), but 5–20 times lower than 2005 results from Manchester (UK). The relationship between the various FTOHs, 6:2 : 8:2 : 10:2, differed in this study compared to others. In Providence (RI, USA) the concentrations of all three FTOHs targeted were very similar, while 8:2 FTOH was significantly more prevalent in other studies (Shoeib et al. 2006; Barber et al. 2007; Jahnke, Ahrens, et al. 2007; S. Oono et al. 2008). One possible explanation for the difference in ratios is the addition of PFOS and PFOA to Annex B of the Stockholm convention on persistent organic pollutants in 2009. Already as part of U.S. EPA’s stewardship initiative (U.S. EPA), production of C-8 fluorochemicals was phased out, likely causing a decrease in environmental concentrations of 8:2 FTOH. The production method of fluoropolymers has changed since 2009 with increased use of other non-C-8 length compounds, predominantly C-6, C-10, and C-12 fluorocarbons. This change is reflected in the elevated 6:2 and 10:2 FTOH concentrations in relation to the 8:2 FTOH in this study and others (Ahrens et al. 2012; Wang et al. 2014).
Concentrations of MeFOSE and EtFOSE in Providence were similar to those previously reported for Toronto (Canada), while we detected much smaller concentrations for MeFOSA and EtFOSA (Table 4). There was no data for comparison for the ambient concentration of 10:2 FtAcr (8:2 FTAcr was < IDL).
Table 4.
Atmospheric concentrations measured at Providence sampling site using PUF/XAD active sampling
| Compound | Atmospheric Concentration (pg/m3) | |||||||
|---|---|---|---|---|---|---|---|---|
| 2016/4/11 | 2016/4/13 | 2016/4/15 | 2016/4/18 | 2016/4/20 | 2016/4/25 | 2016/4/27 | 2016/4/29 | |
| 6:2 FTOH | 9.8 | 27 | 12 | 9.4 | 12 | 5.7 | 9.5 | 5.8 |
| 8:2 FTOH | 15 | 19 | 12 | 31 | < IDL | 4.6 | 12 | 16 |
| 10:2 FTOH | 7.1 | 11 | 7.0 | 19 | < IDL | 3.1 | 11 | 11 |
| 8:2 FTAcr | < IDL | < IDL | < IDL | < IDL | < IDL | < IDL | < IDL | < IDL |
| 10:2 FTAcr | < IDL | < IDL | < IDL | 0.1 | < IDL | 0.1 | < IDL | 0.1 |
| EtFOSA | < IDL | < IDL | < IDL | < IDL | < IDL | < IDL | < IDL | < IDL |
| MeFOSA | 0.4 | < IDL | 0.5 | 0.5 | 0.4 | 0.3 | 1.9 | 1.2 |
| EtFOSE | 1.9 | < IDL | < IDL | 1.3 | 1.1 | < IDL | 0.9 | < IDL |
| MeFOSE | 2.8 | 3.9 | 2.4 | 1.2 | 1.7 | 0.9 | < IDL | 1.4 |
< IDL - below instrumental detection limit
Passive sampling of gas-phase PFASs
In contrast to active sampling results, all targeted PFASs were present in the passive samplers (Table S2). Greatest concentrations in PE samplers were detected for MeFOSE and EtFOSE, with mean concentrations greater than 1 ng/g PE, while all other PFASs were < 1 ng/g PE. PE-based FTOH-concentrations were dominated by the 10:2 FTOH and 6:2 FTOH, which were around 0.5 ng/g PE, same as for MeFOSA. Other volatile PFASs were around 0.2 ng/g PE, including the FT Acr, EtFOSA and 8:2 FTOH (SI Table 6).
The time-curve of compound uptake by PE samplers for all three FTOHs, MeFOSE, MeFOSA and EtFOSA, displayed relatively constant concentrations during the field study (Table 4). In contrast, PE-based concentrations of EtFOSA, 8:2 FTAcr and 10:2 FTAcr increased by 23-fold during the deployment. These uptake profiles imply somewhat low affinities of gaseous PFASs for PE samplers, in-line with results predicted by pp-LFERs (Endo and Goss 2014b).
PE - air partitioning constants
The partitioning of neutral PFAS between PE and air (KPEa) was derived as the ratio of passive sampler concentrations to active sampling concentrations sampled over the same time period:
| (3) |
average concentrations of CPE and Cawere used for each sampling period (Table 5). Log KpEa were around 7–8 for the FTOHs, and closer to 9 for MeFOSA, Et/MeFOSE and 10:2 FTAcr. As opposed to KPEw values, no consistent trend appeared with increasing molecular weight for FTOHs.
Table 5.
Estimated log KPEa values from this study, and predicted values based on pp-LFER approaches.
| mean log KPEa | pp-LFERa | |
|---|---|---|
| 6:2 FTOH | 7.6 ± 0.2 | 2.8 |
| 8:2 FTOH | 7.1 ± 0.2 | 5.4 |
| 10:2 FTOH | 7.7 ± 0.4 | 8.0 |
| 8:2 FTAcr | n/a | - |
| 10:2 FTAcr | 9.1 | - |
| EtFOSA | n/a | - |
| MeFOSA | 8.8 ± 0.2 | - |
| EtFOSE | 9.0 ± 0.1 | - |
| MeFOSE | 8.9 ± 0.3 | - |
The comparison with KPEa values predicted by pp-LFER showed good agreement only for 10:2 FTOH (KPEa from pp-LFER prediction 8.0; measured 7.7 ± 0.4); the field-derived values were greater than model-predicted values for the other FTOHs. The pp-LFER-approach might be biased in predicting much greater differences in KPEa values (strictly speaking, the prediction is for Khda, but hexadecane is arguable an ideal proxy for the interactions provided by polyethylene chains). The field-derived values probably lack precision. As neutral PFASs are also surfactants, there might be contribution included in the field measurements of surface adsorption that is not considered by the pp-LFER predictions.
Passive sampler-based water-air gradients
The ratio of target compound concentrations (at equilibrium) in the same passive sampler matrix between water and air was used to derive water to air gradients (chemical activity gradients), and corresponding gaseous air-water exchange fluxes (Liu et al. 2016; Carrie A. McDonough et al. 2016). As ratios were based on PFASs that had equilibrated (day 28 for WWTP effluents, days 16 and 32 for air PEs), the ratios are not influences by Rs or Kpe values. Instead, the PEs functioned as sensors of the PFASs relative chemical activities (Morgan and Lohmann 2008; Gobas et al. 2018). We should note that aqueous and atmospheric sampling were carried out ca 50 km apart, and for different seasons. Atmospheric concentrations are arguably greater in a major town than around a small town’s WWTP, so the gradient derived here will be more conservative. Despite these uncertainties, water-based concentrations of neutral PFASs in PE samplers exceeded those in the gas-phase for most compounds (SI Table 9), indicating net volatilization. Exceptions were Me- and EtFOSE, for which gradients were not significantly different from equilibrium. In our case, there is strong evidence that most of the investigated PFASs are subject to strong volatilization from the WWTP effluent, which is in-line with previous studies in WWTPs using active sampling techniques (Ahrens, Shoeib, Harner, Lee, et al. 2011). This confirms that PE samplers can be used to derive air-water exchange gradients for neutral PFASs, too.
CONCLUSIONS
This study assessed the use of PE passive samplers as a sampling tool for neutral PFAS precursors in air and water. Results show the potential utility of PE samplers for a wide range of neutral PFASs, including 6:2, 8:2 and 10:2 FTOHs, Me/EtFOSE, Me/EtFOSA and 8:2 FTAcr, which were regularly detected both in a WWTP effluent and in the ambient air of Providence (RI). While log Kpew ranged only from 3.5 – 5.0, this was sufficient for a routine detection of neutral PFASs in WWTP effluent. Equilibration times varied between a few days to a couple of weeks for a 25 μm PE sampler placed in the effluent. For gas-phase compounds, all targeted neutral PFASs accumulated in the PE samplers; log KPEA, were ~ 7–8 for the FTOHs, and approached 9 for MeFOSA and MeFOSE. Neutral PFASs equilibrated within days to 1 week with the 25 μm PE sampler. A comparison of PE-based concentrations between WWTP effluent and ambient air implies net volatilization for all compounds. Future work should explore the use of different thicknesses as a tool to verify equilibrium, in addition to classical time-series uptake curves. Now that we have shown that PE can be used as a passive sampler for neutral PFASs, controlled uptake studies, ideally with PFAs used as PRCs, would help confirm the KPE values derived here. The results presented here imply that PE samplers can be used to detect precursor PFASs in sites with elevated concentrations, but it is unclear whether PE samplers can be used for their detection at background and remote sites. Thicker PEs could also be used for gas-phase sampling to accumulate a greater mass of neutral PFASs. As industrial production of PFASs diversifies, it is unclear whether the neutral PFASs targeted here (still) constitute the dominant PFASs in the gas-phase. It would thus be interesting to assess what fraction the targeted PFASs represent of total neutral PFASs in the PE samplers.
Supplementary Material
Acknowledgment
This work was partially supported by the National Institute of Environmental Health Sciences grants P42ES027706. We thank Dr. Carrie McDonough (Colorado School of Mines) for the sampling rate calculations and Dave Adelman, Rachel Miller, and Anna Robuck (all URI) for field sampling support. R.L. acknowledges a Fellowship at the Hanse-Wissenschaftskolleg Institute for Advanced Study, Delmenhorst, Germany, for this work.
Footnotes
Supplemental Data
Additional information on deployments, concentrations and comparison to neutral gas-phase PFAS concentrations from other sites are provided. The Supplemental Data are available on the Wiley Online Library at DOI: 10.1002/etc.xxxx
REFERENCES
- Adams RG, Lohmann R, Fernandez LA, MacFarlane JK. 2007. Polyethylene Devices: Passive Samplers for Measuring Dissolved Hydrophobic Organic Compounds in Aquatic Environments. Environ. Sci. Technol 41:1317–1323. doi: 10.1021/es0621593. [DOI] [PubMed] [Google Scholar]
- Ahrens L, Harner T, Shoeib M, Koblizkova M, Reiner EJ. 2013. Characterization of Two Passive Air Samplers for Per- and Polyfluoroalkyl Substances. Environ. Sci. Technol 47:1402414033. doi: 10.1021/es4048945. [DOI] [PubMed] [Google Scholar]
- Ahrens L, Harner T, Shoeib M, Lane DA, Murphy JG. 2012. Improved Characterization of Gas - Particle Partitioning for Per- and Polyfluoroalkyl Substances in the Atmosphere Using Annular Diffusion Denuder Samplers. Environ. Sci. Technol 46:7199–7206. doi: 10.1021/es300898s. [DOI] [PubMed] [Google Scholar]
- Ahrens L, Shoeib M, Harner T, Lane DA, Guo R, Reiner EJ. 2011. Comparison of annular diffusion denuder and high volume air samplers for measuring per- and polyfluoroalkyl substances in the atmosphere. Anal. Chem 83:9622–8. doi: 10.1021/ac202414w. [DOI] [PubMed] [Google Scholar]
- Ahrens L, Shoeib M, Harner T, Lee SC, Guo R, Reiner EJ. 2011. Wastewater Treatment Plant and Landfills as Sources of Polyfluoroalkyl Compounds to the Atmosphere. Environ. Sci. Technol 45:8098–8105. doi: 10.1021/es1036173. [DOI] [PubMed] [Google Scholar]
- Arvaniti OS, Ventouri EI, Stasinakis AS, Thomaidis NS. 2012. Occurrence of different classes of perfluorinated compounds in Greek wastewater treatment plants and determination of their solid-water distribution coefficients. J. Hazard. Mater 239:24–31. doi: 10.1016/j.jhazmat.2012.02.015. [DOI] [PubMed] [Google Scholar]
- Barber JL, Berger U, Chaemfa C, Huber S, Jahnke A, Temme C, Jones KC. 2007. Analysis of per- and polyfluorinated alkyl substances in air samples from Northwest Europe. J. Environ. Monit 9:530–541. doi: 10.1039/b701417a. [DOI] [PubMed] [Google Scholar]
- Bartkow ME, Booij K, Kennedy KE, Müller JF, Hawker DW. 2005. Passive air sampling theory for semivolatile organic compounds. Chemosphere 60:170–6. doi: 10.1016/j.chemosphere.2004.12.033. [DOI] [PubMed] [Google Scholar]
- Booij K, Smedes F, van Weerlee EM. 2002. Spiking of performance reference compounds in low density polyethylene and silicone passive water samplers. Chemosphere 46:1157–1161. doi: 10.1016/S0045-6535(01)00200-4. [DOI] [PubMed] [Google Scholar]
- Chen H, Peng H, Yang M, Hu J, Zhang Y. 2017. Detection, Occurrence, and Fate of Fluorotelomer Alcohols in Municipal Wastewater Treatment Plants. Env. Sci Technol 51:8953–8961. doi: 10.1021/acs.est.7b00315. [DOI] [PubMed] [Google Scholar]
- Choi Y, Cho Y, Luthy RG. 2013. Polyethylene - Water Partitioning Coefficients for Parent- and Alkylated-Polycyclic Aromatic Hydrocarbons and Polychlorinated Biphenyls. Env. Sci Technol 47:6943–6950. [DOI] [PubMed] [Google Scholar]
- Dauchy X, Boiteux V, Bach C, Colin A, Hemard J, Rosin C, Munoz J. 2017. Science of the Total Environment Mass flows and fate of per- and polyfluoroalkyl substances (PFASs) in the wastewater treatment plant of a fluorochemical manufacturing facility. Sci. Total Environ 576:549–558. doi: 10.1016/j.scitotenv.2016.10.130. [DOI] [PubMed] [Google Scholar]
- Ellis DA, Martin JW, De Silva AO, Mabury SA, Hurley MD, Sulbaek Andersen MP, Wallington TJ. 2004. Degradation of fluorotelomer alcohols: a likely atmospheric source of perfluorinated carboxylic acids. Environ. Sci. Technol 38:3316–3321. [DOI] [PubMed] [Google Scholar]
- Endo S, Goss K-U. 2014a. Applications of polyparameter linear free energy relationships in environmental chemistry. Environ. Sci. Technol 48:12477–91. doi: 10.1021/es503369t. [DOI] [PubMed] [Google Scholar]
- Endo S, Goss K-U. 2014b. Predicting Partition Coefficients of Polyfluorinated and Organosilicon Compounds using Polyparameter Linear Free Energy Relationships (pp-LFERs). Environ. Sci. Technol 48:2776–2784. [DOI] [PubMed] [Google Scholar]
- Fiedler S, Pfister G, Schramm K-W. 2010. Partitioning of fluorotelomer alcohols (FTOH) to semipermeable membrane devices (SPMD). Environ. Sci. Pollut. Res 17:420–428. doi: 10.1007/s11356-009-0237-y. [DOI] [PubMed] [Google Scholar]
- Genualdi S, Lee SC, Shoeib M, Gawor A, Ahrens L, Harner T. 2010. Global Pilot Study of Legacy and Emerging Persistent Organic Pollutants using Sorbent-Impregnated Polyurethane Foam Disk Passive Air Samplers. Environ. Sci. Technol 44:5534–5539. doi: 10.1021/es1009696. [DOI] [PubMed] [Google Scholar]
- Giesy JP, Kannan K. 2001. Global distribution of perfluorooctane sulfonate in wildlife. Environ. Sci. Technol 35:1339–1342. [DOI] [PubMed] [Google Scholar]
- Giesy JP, Kannan K. 2002. Peer Reviewed: Perfluorochemical Surfactants in the Environment. Environ. Sci. Technol 36:146A–152A. doi: 10.1021/es022253t. [DOI] [PubMed] [Google Scholar]
- Gobas FAPC, Mayer P, Parkerton TF, Burgess RM, van den Meent D, Gouin T. 2018. A Chemical Activity Approach to Exposure and Risk Assessment of Chemicals. Environ. Toxicol. Chem 37:1235–1251. doi: 10.1002/etc.4091. [DOI] [PMC free article] [PubMed] [Google Scholar]
- Hale SE, Martin TJ, Goss K-U, Arp HPH, Werner D. 2010. Partitioning of organochlorine pesticides from water to polyethylene passive samplers. Environ. Pollut 158:2511–2517. doi: 10.1016/j.envpol.2010.03.010. [DOI] [PubMed] [Google Scholar]
- Harner T, Shoeib M, Diamond M, Ikonomou M, Stern G. 2006. Passive sampler derived air concentrations of PBDEs along an urban-rural transect: spatial and temporal trends. Chemosphere 64:262–7. doi: 10.1016/j.chemosphere.2005.12.018. [DOI] [PubMed] [Google Scholar]
- Houde M, Martin JW, Letcher RJ, Solomon KR, Muir DCG. 2006. Biological Monitoring of Polyfluoroalkyl Substances: A Review. Environ. Sci. Technol 40:3463–3473. doi: 10.1021/es052580b. [DOI] [PubMed] [Google Scholar]
- Houde M, De Silva AO, Muir DCG, Letcher RJ. 2011. Monitoring of perfluorinated compounds in aquatic biota: an updated review. Environ. Sci. Technol 45:7962–73. doi: 10.1021/es104326w. [DOI] [PubMed] [Google Scholar]
- Hurley MD, Sulbaek Andersen MP, Wallington TJ, Ellis DA, Martin JW, Mabury SA. 2004. Atmospheric Chemistry of Perfluorinated Carboxylic Acids: Reaction with OH Radicals and Atmospheric Lifetimes. J. Phys. Chem. A 108:615–620. doi: 10.1021/jp036343b. [DOI] [Google Scholar]
- Jahnke A, Ahrens L, Ebinghaus R, Temme C. 2007. Urban versus Remote Air Concentrations of Fluorotelomer Alcohols and Other Polyfluorinated Alkyl Substances in Germany. Environ. Sci. Technol 41:745–752. doi: 10.1021/es0619861. [DOI] [PubMed] [Google Scholar]
- Jahnke A, Huber S, Temme C, Kylin H, Berger U. 2007. Development and application of a simplified sampling method for volatile polyfluorinated alkyl substances in indoor and environmental air. J. Chromatogr. A 1164:1–9. doi: 10.1016/j.chroma.2007.06.068. [DOI] [PubMed] [Google Scholar]
- Key BD, Howell RD, Criddle CS. 1997. Fluorinated Organics in the Biosphere. Environ. Sci. Technol 31:2445–2454. doi: 10.1021/es961007c. [DOI] [Google Scholar]
- Khairy M, Muir D, Teixeira C, Lohmann R. 2014. Spatial Trends, Sources, and Air-Water Exchange of Organochlorine Pesticides in the Great Lakes Basin Using Low Density Polyethylene Passive Samplers. Environ. Sci. Technol 48:9315–9324. doi: 10.1021/es501686a. [DOI] [PubMed] [Google Scholar]
- Kim S-K, Shoeib M, Kim K-S, Park J-E. 2012. Indoor and outdoor poly- and perfluoroalkyl substances (PFASs) in Korea determined by passive air sampler. Environ. Pollut 162:144–150. doi: 10.1016/j.envpol.2011.10.037. [DOI] [PubMed] [Google Scholar]
- Kissa E 1994. Fluorinated surfactants: synthesis, properties, applications. M. Dekker; New York. [Google Scholar]
- Krusic PJ, Marchione AA, Davidson F, Kaiser MA, Kao C-PC, Richardson RE, Botelho M, Waterland RL, Buck RC. 2005. Vapor pressure and intramolecular hydrogen bonding in fluorotelomer alcohols. J. Phys. Chem. A 109:6232–41. doi: 10.1021/jp0502961. [DOI] [PubMed] [Google Scholar]
- Kwon H, Kim H, Park Y, Seok K, Oh J, Choi S. 2017. Updated national emission of per fluoroalkyl substances (PFASs) from wastewater treatment plants in South Korea. Environ. Pollut 220:298–306. doi: 10.1016/j.envpol.2016.09.063. [DOI] [PubMed] [Google Scholar]
- Liu W, Takahashi S, Sakuramachi Y, Harada KH, Koizumi A. 2013. Polyfluorinated telomers in indoor air of Japanese houses. Chemosphere 90:1672–7. doi: 10.1016/j.chemosphere.2012.09.062. [DOI] [PubMed] [Google Scholar]
- Liu Y, Wang S, McDonough CA, Khairy M, Muir DCG, Helm PA, Lohmann R. 2016. Gaseous and Freely-Dissolved PCBs in the Lower Great Lakes Based on Passive Sampling: Spatial Trends and Air - Water Exchange. Environ. Sci. Technol 50:4932–4939. doi: 10.1021/acs.est.5b04586. [DOI] [PubMed] [Google Scholar]
- Lohmann R, Booij K, Smedes F, Vrana B. 2012. Use of passive sampling devices for monitoring and compliance checking of POP concentrations in water. Environ. Sci. Pollut. Res 19:1885–1895. doi: 10.1007/s11356-012-0748-9. [DOI] [PubMed] [Google Scholar]
- Ma R, Shih K. 2010. Perfluorochemicals in wastewater treatment plants and sediments in Hong Kong. Environ. Pollut 158:1354–1362. doi: 10.1016/j.envpol.2010.01.013. [DOI] [PubMed] [Google Scholar]
- Mahmoud MAM, Kärrman A, Oono S, Harada KH, Koizumi A. 2009. Polyfluorinated telomers in precipitation and surface water in an urban area of Japan. Chemosphere 74:467–472. doi: 10.1016/j.chemosphere.2008.08.029. [DOI] [PubMed] [Google Scholar]
- McDonough CA, Helm PA, Muir D, Puggioni G, Lohmann R. 2016. Polycyclic Musks in the Air and Water of the Lower Great Lakes: Spatial Distribution and Volatilization from Surface Waters. Environ. Sci. Technol 50:11575–11583. doi: 10.1021/acs.est.6b03657. [DOI] [PubMed] [Google Scholar]
- McDonough CA, Khairy MA, Muir DCG, Lohmann R. 2014. Significance of population centers as sources of gaseous and dissolved PAHs in the lower Great Lakes. Environ. Sci. Technol 48:7789–7797. doi: 10.1021/es501074r. [DOI] [PubMed] [Google Scholar]
- McDonough CA, Puggioni G, Helm PA, Muir D, Lohmann R. 2016. Spatial Distribution and Air - Water Exchange of Organic Flame Retardants in the Lower Great Lakes. Environ. Sci. Technol 50:9133–9141. doi: 10.1021/acs.est.6b02496. [DOI] [PubMed] [Google Scholar]
- Morgan EJ, Lohmann R. 2008. Detecting Air-Water and Surface-Deep Water Gradients of PCBs Using Polyethylene Passive Samplers. Environ. Sci. Technol 42:7248–7253. doi: 10.1021/es800518g. [DOI] [PubMed] [Google Scholar]
- Oono S, Harada KH, Mahmoud MAM, Inoue K, Koizumi A. 2008. Current levels of airborne polyfluorinated telomers in Japan. Chemosphere 73:932–937. doi: 10.1016/j.chemosphere.2008.06.069. [DOI] [PubMed] [Google Scholar]
- Oono S, Matsubara E, Harada KH, Takagi S, Hamada S, Asakawa A, Inoue K, Watanabe I, Koizumi A. 2008. Survey of airborne Polyfluorinated telomers in Keihan area, Japan. Bull. Environ. Contam. Toxicol 80:102–106. [DOI] [PubMed] [Google Scholar]
- Piekarz AM, Primbs T, Field JA, Barofsky DF, Simonich S. 2007. Semivolatile Fluorinated Organic Compounds in Asian and Western U.S. Air Masses. Environ. Sci. Technol 41:82488255. doi: 10.1021/es0713678. [DOI] [PubMed] [Google Scholar]
- Reitsma PJ, Adelman D, Lohmann R. 2013. Challenges of using polyethylene passive samplers to determine dissolved concentrations of parent and alkylated PAHs under cold and saline conditions. Environ. Sci. Technol 47:10429–10437. doi: 10.1021/es402528q. [DOI] [PubMed] [Google Scholar]
- Sacks VP, Lohmann R. 2011. Development and use of polyethylene passive samplers to detect triclosans and alkylphenols in an Urban estuary. Environ. Sci. Technol 45:2270–2277. doi: 10.1021/es1040865. [DOI] [PubMed] [Google Scholar]
- Shoeib M, Harner T, Vlahos P. 2006. Perfluorinated chemicals in the arctic atmosphere. Environ. Sci. Technol 40:7577–7583. doi: 10.1021/es0618999. [DOI] [PubMed] [Google Scholar]
- Stasinakis AS, Thomaidis NS, Arvaniti OS, Asimakopoulos AG, Samaras VG, Ajibola A, Mamais D, Lekkas TD. 2013. Contribution of primary and secondary treatment on the removal of benzothiazoles, benzotriazoles, endocrine disruptors, pharmaceuticals and perfluorinated compounds in a sewage treatment plant. Sci. Total Environ 463:1067–1075. doi: 10.1016/j.scitotenv.2013.06.087. [DOI] [PubMed] [Google Scholar]
- Stock NL, Lau FK, Ellis DA, Martin JW, Muir DCG, Mabury SA. 2004. Polyfluorinated Telomer Alcohols and Sulfonamides in the North American Troposphere. Environ. Sci. Technol 38:991–996. doi: 10.1021/es034644t. [DOI] [PubMed] [Google Scholar]
- U.S. EPA. 2010 – 2015 PFOA Stewardship Program. [accessed 2016 Mar 24]. https://www.epa.gov/assessing-and-managing-chemicals-under-tsca/20102015-pfoa-stewardship-program.
- Vrana B, Popp P, Paschke A, Schüürmann G. 2001. Membrane-Enclosed Sorptive Coating. An Integrative Passive Sampler for Monitoring Organic Contaminants in Water. Anal. Chem 73:5191–5200. doi: 10.1021/ac010630z. [DOI] [PubMed] [Google Scholar]
- Wallington TJ, Hurley MD, Xia J, Wuebbles DJ, Sillman S, Ito A, Penner JE, Ellis DA, Martin J, Mabury SA, et al. 2006. Formation of C7F15COOH (PFOA) and Other Perfluorocarboxylic Acids during the Atmospheric Oxidation of 8:2 Fluorotelomer Alcohol. Environ. Sci. Technol 40:924–930. doi: 10.1021/es051858x. [DOI] [PubMed] [Google Scholar]
- Wang X, Schuster J, Jones KC, Gong P. 2018. Occurrence and spatial distribution of neutral perfluoroalkyl substances and cyclic volatile methylsiloxanes in the atmosphere of the Tibetan Plateau. Atmos. Chem. Phys 18:8745–8755. doi: 10.5194/acp-18-8745-2018. [DOI] [Google Scholar]
- Wang Z, Xie Z, Möller A, Mi W, Wolschke H, Ebinghaus R. 2014. Atmospheric concentrations and gas/particle partitioning of neutral poly- and perfluoroalkyl substances in northern German coast. Atmos. Environ 95:207–213. [Google Scholar]
- Wania F 2007. A Global Mass Balance Analysis of the Source of Perfluorocarboxylic Acids in the Arctic Ocean. Environ. Sci. Technol 41:4529–4535. doi: 10.1021/es070124c. [DOI] [PubMed] [Google Scholar]
- Xie Z, Zhao Z, Möller A, Wolschke H, Ahrens L, Sturm R, Ebinghaus R. 2013. Neutral poly- and perfluoroalkyl substances in air and seawater of the North Sea. Environ. Sci. Pollut. Res. Int 20:7988–8000. [DOI] [PubMed] [Google Scholar]
- Yamashita N, Taniyasu S, Petrick G, Wei S, Gamo T, Lam PKS, Kannan K. 2008. Perfluorinated acids as novel chemical tracers of global circulation of ocean waters. Chemosphere 70:1247–1255. doi: 10.1016/j.chemosphere.2007.07.079. [DOI] [PubMed] [Google Scholar]
- Yeung LWY, Dassuncao C, Mabury S, Sunderland EM, Zhang X, Lohmann R. 2017. Vertical Profiles, Sources, and Transport of PFASs in the Arctic Ocean. Env. Sci Technol 51:6735–6744. doi: 10.1021/acs.est.7b00788. [DOI] [PubMed] [Google Scholar]
Associated Data
This section collects any data citations, data availability statements, or supplementary materials included in this article.