

Abstract
In relapsing‐remitting multiple sclerosis (RRMS) the corpus callosum (CC) is often and early affected by macroscopic lesions when investigated by conventional MRI. We sought to determine to which extent microstructural and effective disconnection of the CC are already present in RRMS patients at the earliest stages of the disease prior to evidence of macroscopic CC lesion. We compared 16 very early RRMS patients (median expanded disability status scale (EDSS), 1.5; range, 0–2.0) to an age‐matched group of healthy controls and focused analysis to the motor CC, i.e. that part of the CC relaying interhemispheric motor information. A combined functional magnetic resonance imaging/diffusion tensor imaging fiber‐tracking procedure was applied to identify the callosal motor fibers (CMFs) connecting the hand areas of the primary motor cortices of the two hemispheres. Fractional anisotropy (FA) within the motor CC (FA‐CC) assessed the CMF microstructural integrity. Bifocal paired transcranial magnetic stimulation (TMS) tested short‐interval interhemispheric inhibition (S‐IHI), an established measure of CMF effective connectivity. FA‐CC and S‐IHI were significantly reduced in early RRMS compared to healthy controls. Furthermore, a significant linear correlation between microstructure (FA‐CC) and function (S‐IHI) in the controls was broken down in the patients. These abnormalities were obtained in the absence of macroscopic CMF lesion in conventional MRI, and whilst motor hand/arm function in the nine‐hole‐peg test and corticospinal conduction time were normal. Findings suggest that reductions in FA and S‐IHI may serve as surrogate markers of motor callosal disconnection at the earliest stages of RRMS prior to development of macroscopic lesion. Hum Brain Mapp, 2011. © 2010 Wiley‐Liss, Inc.
Keywords: motor corpus callosum, diffusion tensor imaging, interhemispheric inhibition, effective connectivity, bifocal transcranial magnetic stimulation, multiple sclerosis
INTRODUCTION
Multiple sclerosis (MS) is the most frequent inflammatory central nervous system (CNS) disorder leading to sustained disability in young people. Inflammatory activity is most prominent at the early stages of MS, and predicts disability along the course of the disease [Fisniku et al.,2008; Losseff et al.,2001], a finding which has provoked a paradigm shift toward early commencement of immune‐modulating therapy [Kappos et al.,2007]. Therefore, establishing valid surrogate markers of early CNS dysfunction is of essential importance. Modern magnetic resonance imaging (MRI) techniques such as diffusion tensor imaging (DTI), magnetization transfer ratio, or MR spectroscopy often reveal pathology in normal appearing white matter (NAWM) and normal appearing grey matter of MS patients, undetected by conventional MRI [Filippi et al.,1999; Miller et al.,2003; Rovaris et al.2005]. Fractional anisotropy (FA), a DTI‐derived measure, assesses white matter integrity at a microstructural level, reflecting degree of myelination, axon size, and axon density [Beaulieu,2002]. FA is reduced in NAWM of MS patients, including the corpus callosum (CC) [Bammer et al.,2000; Bester et al.,2008; Ciccarelli et al.,2003; Filippi et al.,2000; Ge et al.,2004]. However, callosal disconnection at the microstructural and functional level, and relation between structure and function have not been investigated in early stage relapsing‐remitting multiple sclerosis (RRMS) patients who have no macroscopic evidence of CC lesions.
We used FA to examine microstructural pathology in the normal appearing motor CC in early RRMS. We related these data to short‐interval interhemispheric inhibition (S‐IHI) and long‐interval interhemispheric inhibition (L‐IHI), which reflect complementary and functionally distinct aspects of CMF effective connectivity, measured by bifocal paired‐pulse transcranial magnetic stimulation (TMS) [Chen et al.,2003; Ferbert et al.,1992; Ni et al.,2008]. The experimental design was built on our previous multimodal assessment of the motor CC in healthy subjects where we demonstrated a close linear correlation between FA and S‐IHI [Wahl et al.,2007].
MATERIALS AND METHODS
Subjects
Sixteen early RRMS patients (mean age, 32.9 ± 6.8 years, range 22–45 years; mean disease duration, 18.9 ± 14.8 months; median expanded disability status scale [EDSS; [Kurtzke,1983], 1.5, range EDSS, 0–2.0, 12 females) were compared to 12 healthy subjects (mean age, 32.6 ± 9.0 years; range 24–51 years; 5 females). The FA and S‐IHI data of the healthy subjects were reported in an earlier publication [Wahl et al.,2007]. Experimenters, experimental set‐ups, and data analysis procedures were identical, ascertaining direct comparability between the healthy control and RRMS groups. The RRMS patients were diagnosed according to the revised McDonald criteria [Polman et al.,2005]. On clinical examination, none of the patients had motor abnormalities. Twelve of 16 patients were on immune‐modulating treatment at the time of this study (for detailed patient characteristics, see Table I). None of the participants was on treatment with any other CNS active drug. Written informed consent was obtained from all participants. The study conformed to the latest revision of the Declaration of Helsinki and was approved by the ethics committee of the Hospital of the Goethe‐University of Frankfurt/Main. Inclusion criteria were age ≥18 years, right‐handedness as determined by the Edinburgh Handedness Inventory [Oldfield,1971], normal central motor conduction time as tested with TMS [Rothwell et al.,1999], i.e. ≤9.0 ms to the slightly contracting (10–20% of maximum) first dorsal interosseus (FDI) muscle of both hands, and for the patients, EDSS ≤ 2.0. Normal central motor conduction time was employed as an inclusion criterion to exclude the possibility that abnormal corticospinal conduction contaminated the measurements of primary interest of this study on interhemispheric inhibition [Jung et al.,2006]. Exclusion criteria comprised of the usual contraindications for MRI and TMS.
Table I.
Patient characteristics
| Number | Sex | Age (yrs) | EDSS | Duration (months) | Treatment | T2‐Vol (mm3) |
|---|---|---|---|---|---|---|
| 1 | f | 45 | 1.5 | 42 | GLT | 340 |
| 2 | f | 25 | 1.0 | 13 | INF‐ß‐1a | 320 |
| 3 | f | 28 | 0 | 46 | None | 493 |
| 4 | f | 43 | 1.5 | 6 | GLT | 541 |
| 5 | f | 35 | 1.5 | 22 | INF‐ß‐1b | 1250 |
| 6 | f | 29 | 2.0 | 10 | INF‐ß‐1b | 13600 |
| 7 | m | 35 | 0 | 9 | INF‐ß‐1a | 1123 |
| 8 | m | 29 | 1.5 | 1 | None | 959 |
| 9 | f | 34 | 1.5 | 3 | INF‐ß‐1a | 248 |
| 10 | f | 33 | 1.5 | 24 | GLT | 176 |
| 11 | m | 32 | 1.5 | 30 | Natalizumab | 792 |
| 12 | f | 39 | 1.0 | 2 | GLT | 827 |
| 13 | f | 24 | 1.5 | 18 | INF‐ß‐1b | 526 |
| 14 | f | 36 | 1.0 | 43 | None | 999 |
| 15 | m | 39 | 1.0 | 2 | None | 283 |
| 16 | f | 22 | 1.0 | 18 | INF‐ß‐1b | 572 |
Abbreviations: f = female; m = male; GLT = glatiramer acetate; INF‐ß = interferon‐ß; T2‐Vol = Volume of T2‐weighted lesions in the whole brain (note, that all patients were free of T2‐weighted lesions in the callosal motor fibers).
Hand/Arm Motor Performance
Participants performed the Nine‐Hole Peg Test (9‐HPT), a standardized test for unilateral hand/arm function [Mathiowetz et al.,1985]. The test was repeated twice for either hand. The time necessary to complete the test was taken as performance, and conditional averages were calculated for either hand.
Image Acquisition
MRI was performed in a 3‐Tesla Magnetom Trio (Siemens Medical Solutions, Erlangen, Germany). Structural T1‐weighted data were acquired using a magnetization‐prepared rapid‐acquisition gradient echo (MPRAGE) sequence [repetition time (TR) 2250 ms, echo time (TE) 26 ms, inversion time 900 ms, flip angle 9°, 192 sagittal slices, field of view 256 × 256 mm2, voxel size 1 × 1 × 1 mm3). Moreover, fluid‐attenuated inversion recovery (FLAIR) images [repetition time (TR) 6,000 ms, echo time (TE) 353 ms, inversion time (TI) 2,200 ms, sagittal slices, voxel size 1 × 1 × 1 mm3] were acquired. Functional MRI (fMRI) was performed in a block design experiment to identify primary motor cortex (M1) hand representations in both hemispheres as target regions for fiber tractography (see below), using a blood oxygenation level‐dependent (BOLD)‐sensitive echo planar imaging (EPI) sequence (TR 2,640 ms, TE 30 ms, flip angle 90°, 36 transverse slices, 0.75 mm gap, voxel size 3 × 3 × 3 mm3, base resolution 64 × 64). For online EPI distortion correction point spread function mapping was used as described by others [Zaitsev et al.,2004]. A total of 192 scans were acquired while subjects performed a visually instructed simple motor task, consisting of four blocks of rest alternating with flexion movements of the fingers of the left or right hand (21 s per condition) at a self‐paced rate of ∼2 Hz. DTI data were acquired, using a single shot spin‐echo EPI with parallel imaging technique GRAPPA (generalized auto‐calibrating partially parallel acquisitions, acceleration factor 2). The sequence included 12 gradient directions and a b‐value of 700 (TR 7,200 ms, TE 80 ms, voxel size 1.9 × 2.0 × 1.9 mm3, 60 transverse slices, base resolution 128 × 128).
Analysis of T2 Lesion Load
Number and volume of supratentorial brain lesions were determined as revealed by the FLAIR images. Using FSL View (http://www.fmrib.ox.ac.uk/fsl), every single slice was screened for T2‐hyperintensive lesions in the axial plane and lesions were identified and marked voxelwise by manual seeding. Then lesion volume was calculated using fslstats.
FMRI Analysis
Analysis of the fMRI data was performed by using Brain Voyager (Brain Innovation, The Netherlands). Data preprocessing before statistical analysis included interslice scan time correction with sinc interpolation and three‐dimensional (3D) motion correction but revealed no relevant motion artifacts. Using a high‐pass filter of three data points the realigned time series were temporally filtered, and then linear drifts of the signal were removed from each pixel's time course. Alignment of fMRI and 3D anatomical data was done by two‐step coregistration, which included an initial automatic header‐based alignment, followed by a manual fine tuning procedure to adjust rotational and translational parameters. At each voxel, time course correlation of the measured BOLD signal with a hemodynamic reference function was performed to acquire a correlation coefficient r. Thresholds were set at 80% of the maximum correlation coefficient in the M1 hand area and, if necessary, manual threshold adjustments of the correlation coefficient r were performed to obtain circumscribed functional representations of comparable size across subjects and hemispheres. Finally the anatomical and fMRI data were exported as DICOM files. In all patients and controls, functional activation mapped to the hand knob contralateral to hand movement, the anatomical landmark of the M1 hand area [Yousry et al.,1997].
Fiber Tracking
FA maps were calculated on the basis of the DTI data. A semiautomatic rigid registration procedure which utilizes intensity‐based information was used for fusion of T1‐weighted MPRAGE, fMRI, and DTI images (PatXfer 5.1, BrainLab, image fusion software module) [Nimsky et al.,2006]. A tensor deflection algorithm which also considers the trend of currently generated fibers was implemented for fiber tracking [Lazar et al.,2003; Nimsky et al.,2006]. The major eigenvector of each seed was calculated before iteration was initiated bidirectionally until one of the following stop criteria was met: FA < 0.15 or deviation angle >40°. Tracked fibers with a length <50 mm were discarded from analysis. Retained fibers were visualized according to standard direction color encoding [Pajevic and Pierpaoli,1999]. Fiber tracking was performed with a two‐step method as described earlier [Wahl et al.,2007]. First, a large rectangular region of interest (ROI) was defined that covered the hand representations defined by fMRI in the right and left primary motor cortex (M1) to visualize corticofugal fibers originating from M1. In a second step, a smaller rectangular ROI was set within that area of the CC that exhibited fibers after the first tracking step, and fiber tracking was repeated. Both ROIs were adjusted to contain 30,000 seeds, regardless of their size. Because the BOLD signal is largely limited to the grey matter, tracked fibers projecting into or near to the M1 hand representations within the anatomical hand knob as defined by fMRI (for details, see above and [Wahl et al.,2007]) were retained, including at least one more voxel beyond the grey/white matter boundary. To verify the validity and specificity of this two‐step tracking procedure, results were compared with those of a one‐step procedure that started from a ROI covering the entire CC as described previously [Hofer and Frahm,2006; Zarei et al.,2006]. Both procedures revealed identical anatomical location of the CMFs in the CC, but the two‐step tracking showed superior sensitivity, i.e., more fibers were tracked [Wahl et al.,2007].
DTI Quantification
Among the available DTI measures (FA, mean diffusivity, parallel and axial diffusivity), FA is by far the one most extensively studied, and represents an accepted standard as a surrogate marker of microstructural damage in MS [Ciccarelli et al.,2003; Ge et al.,2004]. Therefore, we chose FA for assessment of microstructural pathology in the motor CC of RRMS. Mean FA was calculated for hand CMFs from all voxels within the boundaries of the CC (FA‐CC) rather than from the entire CMF pathway. This restriction to the CC was applied to avoid contamination from crossing fibers, which are absent within the midbody of the CC but present in other parts of the subcortical white matter. To avoid inclusion of partial volumes of surrounding cerebrospinal fluid (CSF), a distance of one voxel to the CC/CSF boundary (indicated by FA < 0.4) was respected.
Motor Evoked Potential (MEP) Recordings
MEPs were recorded by surface electromyography (EMG) from the FDI of both hands, using Ag‐AgCl electrodes, with the active electrode placed over the muscle belly and the reference electrode on the metacarpophalangeal joint of the index finger. The EMG was bandpass filtered (0.02–2 kHz) and amplified (Counterpoint Mk2 Electromyograph, Dantec, Denmark), digitized at a sampling rate of 4 kHz (CED Micro 1401; Cambridge Electronic Design, UK), and stored on a computer for offline analysis. Customized Spike2 software (Cambridge Electronic Design) was used for experimental control, data acquisition and data analysis.
Interhemispheric Inhibition (IHI)
IHI between the hand areas of M1 was tested by using an established bifocal paired TMS protocol [Ferbert et al.,1992]. TMS was delivered through two figure‐of‐eight coils (diameter of each loop, 70 mm), each connected to a Magstim 200 magnetic stimulator with a monophasic current waveform (The Magstim Company, UK). The conditioning coil was placed tangentially over the hand area of the left M1, with the handle pointing laterally so that a lateral‐to‐medial directed current was induced in M1. The test coil was placed over the hand area of the right M1, with the handle pointing backward and 45° away from the midline so that the induced current in this M1 flowed from lateral‐posterior to medial‐anterior. For both coils, the optimal position was determined as the site that elicited largest MEPs in the FDI of the contralateral hand. The resting motor threshold was determined for the conditioning pulse to the nearest 1% of maximum stimulator output and was defined as the minimum stimulus intensity that resulted in small MEPs >50 μV in at least 5 of 10 trials. Magnitude and duration of IHI increase with the intensity of the conditioning stimulus [Ferbert et al.,1992]. Therefore, the intensity of the conditioning stimulus (S1) was varied from 100 to 150% of resting motor threshold in 10% steps (i.e., six different intensities) to obtain a wide range of IHI magnitudes from threshold to maximum. Test pulse intensity was adjusted to produce an unconditioned MEP of on average 1 mV in peak‐to‐peak amplitude. Previous studies suggested a distinction of IHI into two epochs, short‐interval IHI (S‐IHI) and long‐interval IHI (L‐IHI), which reflect complementary and functionally distinct aspects of CMF effective connectivity [Chen et al.,2003; Ni et al.,2008]. Therefore, S‐IHI was tested at an interstimulus interval of 12 ms in one block, and L‐IHI at an interstimulus interval of 40 ms in another block. Each block comprised of eight trials per S1 intensity and eight unconditioned test stimulus trials (i.e., total of 56 trials), applied in randomized order. The intertrial interval varied randomly between 4 and 6 s to reduce anticipation of the next trial. Conditional averages of the single‐trial MEP peak‐to‐peak amplitudes were calculated. For each of the S1 intensities, IHI was expressed by (1 − mean conditioned MEP/mean unconditioned MEP) × 100%. Accordingly, IHI = 0%, IHI = 100%, and IHI < 0% indicate no inhibition, complete inhibition, and interhemispheric facilitation, respectively.
Statistics
Group differences (RRMS vs. healthy subjects) of FA‐CC were assessed by a two‐tailed unpaired Student's t test. Group differences of S‐IHI and L‐IHI were determined by an ANOVA with GROUP (RRMS vs. healthy subjects) as between‐subject effect and S1 INTENSITY (six levels, 100–150% of resting motor threshold in 10% steps) as within‐subject effect. The relation between CMF microstructure (FA‐CC) and effective connectivity (S‐IHI) was assessed by linear regression analysis. Normative limits for FA‐CC and S‐IHI were defined from the group of healthy subjects by mean ± 2.5 S.D. For all tests, statistical significance was assumed if P < 0.05. Data are given as means ± S.E.M, if not stated otherwise.
RESULTS
Central Motor Conduction Time and Hand/Arm Motor Performance in the 9‐HPT
Central motor conduction time was normal in all MS patients (right hand: 7.5 ± 0.8 ms; left hand: 7.4 ± 0.8 ms [means ± S.D.]). Furthermore, performance in the 9‐HPT was not different between groups, neither for the right (RRMS: 19.1 ± 0.7 s vs. healthy subjects: 18.0 ± 0.4 s [means ± S.D.], P = 0.24) nor the left hand (RRMS: 19.8 ± 0.7 s vs. healthy subjects: 18.1 ± 0.6 s [means ± S.D.], P = 0.10). These findings exclude a possible contribution of altered corticospinal tract function to the observed abnormalities in interhemispheric inhibition in the RRMS group (see below).
Macroscopic CMF Lesions
While whole brain lesion load varied considerably between patients (Table I), none of the patients showed any T1 or T2 lesion anywhere in the entire CMF pathway.
Fractional Anisotropy
FA‐CC was significantly lower in RRMS compared to healthy controls (0.790 ± 0.017 vs. 0.852 ± 0.007; P = 0.005, Fig. 1). Six of 16 RRMS patients (37.5%) had a FA‐CC below the lower normal limit (for one representative patient, cf. Fig. 3). There was no correlation between FA‐CC and the EDSS of the RRMS patients (r = 0.13; P = 0.72).
Figure 1.
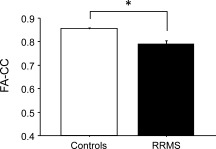
FA of the hand CMFs within the CC (FA‐CC) is significantly reduced in RRMS patients (black bar) compared to healthy subjects (white bar, *P = 0.005). Data are means + 1 S.E.M.
Figure 3.
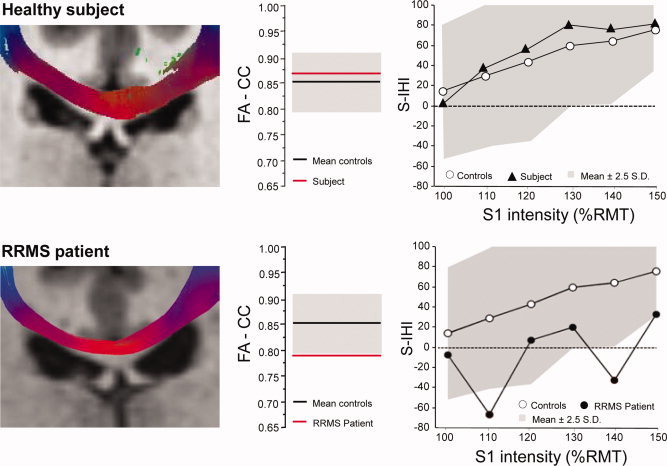
Macrostructural (MRI, DTI), microstructural (FA‐CC) and effective connectivity (S‐IHI) of callosal motor fibers in one representative healthy control (upper row of diagrams) and one representative RRMS patient (lower row of diagrams). Left panels: MRI shows individual hand CMFs as determined by combined fMRI/DTI fiber‐tractography in the coronal plane. Middle panels: the corresponding FA‐CC of the hand CMFs (red lines) are shown in relation to the mean ± 95% CI (black lines and grey areas) of the healthy control group. Right panels: corresponding S‐IHI (1 − conditioned MEP/unconditioned MEP) × 100%, y‐axis) is plotted against S1 intensity (in %RMT, x‐axis) in relation to the mean S‐IHI intensity curve (white circles) and 95% CI (grey area) of the healthy control group. Note normal macroscopic appearance of CMF with DTI tractography, but reduced FA‐CC and S‐IHI in the RRMS patient.
Interhemispheric Inhibition
ANOVA of S‐IHI revealed a significant effect of GROUP (F 1,26 = 4.32, P = 0.047; Fig. 2A) and S1 INTENSITY (F 5,26 = 25.47, P < 0.0001) while the interaction of GROUP with S1 INTENSITY was not significant (F 5,130 = 0.79, P = 0.80). Post hoc testing using Fisher's PLSD revealed reduced S‐IHI at S1 intensities of 130% of resting motor threshold (P = 0.037) and 150% of resting motor threshold (P = 0.021) in the RRMS patients compared to healthy controls (Fig. 2A). Seven of 16 RRMS patients (43.7%) had S‐IHI values below the normal lower limit in at least one of the S1 intensity conditions (for one representative patient, cf. Fig. 3).
Figure 2.
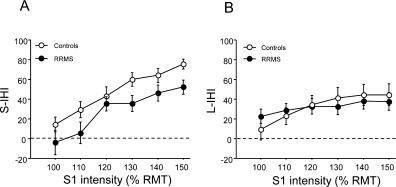
(A) S‐IHI (y‐axis) is given as (1 − conditioned MEP/unconditioned MEP) × 100% and plotted against intensity (in % of the resting motor threshold, RMT) of the conditioning stimulus (x‐axis). All data (white circles: healthy controls; black circles: RRMS patients) are group means ± 1 S.E.M. Note that RRMS patients have a significantly reduced mean S‐IHI intensity curve compared to healthy controls (P = 0.047). (B) In contrast, the mean L‐IHI intensity curve is not different between RRMS patients and healthy controls.
In contrast, the ANOVA of L‐IHI did not show any significant effect of GROUP (F 1,26 = 0.004, P = 0.95) or the interaction of GROUP with S1 INTENSITY (F 5,130 = 0.86, P = 0.51, Fig. 2B).
Correlation Between FA‐CC and S‐IHI
In healthy subjects, FA‐CC correlates directly with S‐IHI [Wahl et al.,2007]. This correlation, which was best when using a S1 intensity of 140% of resting motor threshold (r = 0.65; P = 0.021, cf. regression line in Fig. 4) was absent in RRMS patients (P = 0.54, Fig. 4). Moreover, correlations between FA‐CC and S‐IHI were absent for all other S1 intensities in the patients (data not shown).
Figure 4.

Regression analysis of FA‐CC (x‐axis) with S‐IHI measured at a conditioning stimulus intensity of 140% of resting motor threshold (y‐axis) revealed a significant direct linear correlation for the healthy subjects (white circles, regression line plotted, r = 0.65, P = 0.021). This correlation was absent in the RRMS patients (black circles). Coordinates of group means ± 1 S.E.M. are indicated by colored circles (blue: healthy subjects; red: RRMS patients). Note that the group means of the RRMS patients are shifted towards less FA‐CC and less S‐IHI.
DISCUSSION
The main novel finding from this study was the demonstration of microstructural (FA‐CC) and effective (S‐IHI) connectivity abnormalities in the normal appearing motor corpus callosum of patients with early RRMS. At a time when established conventional imaging (MRI) of the CC, hand/arm motor performance (9‐HPT) and neurophysiological assessment of the corticospinal tract (central motor conduction time) were normal, combined sensitivity analysis of FA‐CC and S‐IHI revealed abnormalities of the motor CC in as many as 9 of 16 (56.3%) of the patients.
Microstructural abnormalities in NAWM are of potentially great diagnostic value in the earliest stages of MS [Bammer et al.,2000; Filippi et al.,2000]. The normal appearing CC is often affected by microstructural pathology in early MS [Bester et al.,2008; Evangelou et al.,2000; Ge et al.,2004; Pelletier et al.,2001] but the functional consequences of this microstructural deficit are not well understood. This led us to perform this multimodal assessment of the motor CC, an important pathway for interhemispheric control of motor cortical output [Duque et al.,2007].
CMF Microstructure in Early RRMS Patients
RRMS patients showed significantly reduced FA‐CC values of the hand CMFs (see Fig. 1) despite absence of macroscopic lesion in conventional MRI. This is consistent with the findings of other studies, which provided evidence that diffusion abnormalities can be present in the CC at the earliest stages of MS before atrophy or macroscopic lesions are detectable by conventional MRI [Ranjeva et al.,2003] and before diffusion abnormalities are detectable in NAWM elsewhere in the brain [Ge et al.,2004]. The CC is the largest fiber tract in the brain, which might be affected earlier and more severely than any other white matter region because it connects large volumes of subcortical white matter between the two hemispheres. A decrease in FA‐CC may reflect not only direct injury of the CC by focal inflammation, but in addition, the pathology in remote but connected brain areas with the consequence of Wallerian axonal degeneration of transcallosal fibers [Ciccarelli et al.,2003]. Furthermore, the CC is a highly organized and densely packed fiber structure, as reflected by higher FA values than in any other white matter region [Alexander et al.,2000]. Therefore, it is likely that FA‐CC is a more sensitive measure of microstructural alteration as compared to other less coherent and crossing fibers containing white matter regions. This contention is supported by our finding that the FA analysis of the entire CMF pathway did no longer reveal a significant difference between RRMS patients and healthy subjects (data not shown).
The biological basis of FA is not entirely understood yet. According to currently prevailing hypothesis, FA reflects various factors such as the degree of myelination, axon size, and axon density [Beaulieu,2002; Le Bihan,2003; Moseley et al.,1990], but crossing fibers and fiber path geometry also contribute. Accordingly, there is limited knowledge as to the exact pathological conditions that result in FA reductions in NAWM of MS patients. According to the known histopathological characteristics of MS lesions, edema, inflammatory cellular infiltration, gliosis, demyelination, and axonal damage may contribute. One possible way of gaining more insight might be combining this microstructural information with electrophysiological measures of CMF effective connectivity.
CMF Effective Connectivity in Early RRMS Patients
Effective connectivity of the hand CMFs in RRMS patients as indexed by S‐IHI was significantly reduced (Figs. 2A and 3). To the best of our knowledge, this is the first time that impaired S‐IHI is demonstrated in RRMS patients by means of the bifocal paired TMS protocol [Ferbert et al.,1992]. These results are in line with previous studies that showed abnormally lengthened onset latency and/or prolonged duration of the ipsilateral silent period, suggestive of [Boroojerdi et al.,1998; Höppner et al.,1999; Schmierer et al.,2000] but not specifically testing a motor callosal conduction deficit in MS patients [Jung et al.,2006]. In contrast, L‐IHI was not affected in RRMS when compared to healthy subjects (Fig. 2B). Previous studies suggested that S‐IHI and L‐IHI are mediated through an excitatory transcallosal glutamatergic pathway that projects onto corticospinal neurones in the opposite hemisphere via inhibitory GABAergic interneurons [Daskalakis et al.,2002; Kukaswadia et al.,2005; Müller‐Dahlhaus et al.,2008]. However, S‐IHI is likely mediated by a different neuronal circuit than L‐IHI because S‐IHI had a higher threshold and could be elicited from a smaller range of cortical areas in the conditioning hemisphere compared to L‐IHI [Ni et al.,2008], the magnitudes of S‐IHI and L‐IHI did not correlate with each other [Kukaswadia et al.,2005], S‐IHI but not L‐IHI was decreased by voluntary contraction of the target muscle [Chen et al.,2003], and S‐IHI vs. L‐IHI showed differential responsiveness to pharmacological modulation of neurotransmission through the GABAB receptor [Irlbacher et al.,2007]. The present data are in line with this distinction. They suggest that S‐IHI but not L‐IHI can serve as a surrogate marker of earliest hand CMF disconnection in RRMS patients. Why L‐IHI was less sensitive can only be speculated upon. L‐IHI has a lower threshold and can be obtained over a larger range of conditioning stimulus intensities and cortical areas in the conditioning hemisphere than S‐IHI [Ni et al.,2008]. This may provide a functional reserve for compensation that will leave L‐IHI unaltered in the presence of focal macrostructural or microstructural pathology of the hand CMFs. Furthermore, slowing of CMF conduction will affect IHI tested at short interstimulus intervals with greater probability than IHI tested at long intervals.
Another important question relates to the meaning of the observed reduction in S‐IHI with respect to the nature of microstructural pathology as measured by FA‐CC. We argued in our previous study in healthy subjects [Wahl et al.,2007] that FA‐CC reflects predominantly fiber density of CMFs: Light and electron microscopic analysis of the fiber composition in the human CC revealed clear regional differences with thin, largely non‐myelinated and densely packed fibers preponderantly in the genu and splenium of the CC, and larger diameter, myelinated and less densely packed fibers concentrated in the posterior midbody of the CC, i.e. the CMF region [Aboitiz et al.,1992]. This regional differentiation of fiber types and densities is paralleled by a regional differentiation of FA‐CC with higher values in the CC regions of predominately thin and densely packed fibers [Hofer and Frahm,2006]. MS patients showed a direct correlation between FA‐CC and CC cross‐sectional area [Cader et al.,2007], and a MS postmortem study revealed a direct correlation between axon density and CC cross‐sectional area [Evangelou et al.,2000]. Therefore, a synthetic view of these MS studies supports the notion that FA‐CC is significantly influenced by axon density. The present study substantiates these arguments to some extent as it demonstrated the expected decrease of S‐IHI magnitude in the presence of pathologically reduced FA‐CC in the RRMS patients (Figs. 2A and 3). On the other hand, the direct linear correlation between FA‐CC and S‐IHI observed in healthy subjects [Wahl et al.,2007] was no longer present in the RRMS patients (see Fig. 4). This suggests that pathology other than axonal damage (reflected by decreased FA‐CC) can result in S‐IHI alteration. One possibility is demyelinating damage along the CMF pathway outside the CC that leaves FA‐CC intact, but likely impairs CMF conduction and in turn affects CMF effective connectivity as measured by S‐IHI.
Our data are in agreement with and extend those of several recent fMRI studies, which showed reduced deactivation or increased activation of the M1 ipsilateral to a unimanual motor task in MS patients [Lee et al.,2000; Manson et al.,2006,2008; Mezzapesa et al.,2008; Pantano et al.,2002a,b; Reddy et al.,2000,2002; Rocca et al.,2004,2005]. However, in all of these studies, it remained unclear to which extent this abnormal activation of the ipsilateral M1 was attributable to adaptive reorganization of the cortical motor network, e.g., by unmasking of ipsilateral corticospinal pathways, or caused by dysfunctional interhemispheric motor inhibition. None of these studies employed electrophysiological techniques to test CMF effective connectivity. Only one previous fMRI study investigated CMF effective connectivity in a sample of relative advanced RRMS patients (disease duration, 7.5 ± 5 years, mean T2 lesion load, 10,993 ± 8,770 mm3) by using the technique of the ipsilateral silent period [Lenzi et al.,2007]. This study demonstrated a significant direct correlation between mean diffusivity of the CC and the amount of ipsilateral motor cortex activation, and an inverse correlation of the duration of the ipsilateral silent period and the amount of ipsilateral motor cortex activation [Lenzi et al.,2007]. However, objectives and methods of that study were clearly different from those of the present study because we were interested in demonstrating prevalence of abnormalities in CMF microstructure and effective connectivity and disordered relation between these two measures at the earliest stages of MS.
Correlation Between FA‐CC and S‐IHI in Early RRMS Patients
Our previous study in healthy subjects demonstrated a direct and topographically specific correlation between FA‐CC and S‐IHI, strongly suggesting a close link between microstructure and function [Wahl et al.,2007]. In the present study we showed that this correlation was lost in RRMS patients (see Fig. 4). Several factors may have accounted for this breakdown between microstructure and function: FA‐CC is limited to the extent of the CC and does not reflect FA of the entire hand CMF pathway. Microstructural pathology in the hand CMF pathway outside the CC may not necessarily result in FA‐CC reduction. In contrast, S‐IHI measures CMF effective connectivity along the entire CMF pathway. However, even when FA calculation was extended to the entire CMF pathway (FA‐CMF), no significant correlation with S‐IHI was found (data not shown). This may be explained by the problem of crossing fibers resulting in less fiber tract specificity of FA‐CMF vs. FA‐CC. Furthermore, in contrast to axonal CMF lesions, demyelinating CMF lesions may leave FA‐CC unaltered but may result in pathological S‐IHI reduction due to chronodispersion and/or slowing of CMF signal conduction. Conversely, reduction of FA‐CC may occur without reduction of S‐IHI if the microstructural pathology affects predominantly fibers in the area of the motor CC not relevant for the expression of S‐IHI.
CONCLUSIONS
Our study demonstrated that FA‐CC and S‐IHI reveal microstructural and effective connectivity abnormalities of the motor CC in a relevant portion of early RRMS patients without evidence of macroscopic motor CC lesion, or altered hand/arm motor function, or altered corticospinal conduction. This suggests a potential role of FA‐CC and S‐IHI as surrogate markers of callosal disconnection at the earliest stages of RRMS prior to development of macroscopic callosal damage. In addition, the close link between microstructure and function (linear correlation between FA‐CC and S‐IHI) is disrupted at these earliest disease stages. Longitudinal studies will have to clarify their value for monitoring and predicting the individual course of the disease.
Acknowledgements
The authors thank George Ogrezeanu and Jörg Magerkurth for technical help.
REFERENCES
- Aboitiz F, Scheibel AB, Fisher RS, Zaidel E ( 1992): Fiber composition of the human corpus callosum. Brain Res 598: 143–153. [DOI] [PubMed] [Google Scholar]
- Alexander AL, Hasan K, Kindlmann G, Parker DL, Tsuruda JS ( 2000): A geometric analysis of diffusion tensor measurements of the human brain. Magn Reson Med 44: 283–291. [DOI] [PubMed] [Google Scholar]
- Bammer R, Augustin M, Strasser‐Fuchs S, Seifert T, Kapeller P, Stollberger R, Ebner F, Hartung HP, Fazekas F ( 2000): Magnetic resonance diffusion tensor imaging for characterizing diffuse and focal white matter abnormalities in multiple sclerosis. Magn Reson Med 44: 583–591. [DOI] [PubMed] [Google Scholar]
- Beaulieu C ( 2002): The basis of anisotropic water diffusion in the nervous system—A technical review. NMR Biomed 15: 435–455. [DOI] [PubMed] [Google Scholar]
- Bester M, Heesen C, Schippling S, Martin R, Ding XQ, Holst B, Fiehler J ( 2008): Early anisotropy changes in the corpus callosum of patients with optic neuritis. Neuroradiology 50: 549–557. [DOI] [PubMed] [Google Scholar]
- Boroojerdi B, Hungs M, Mull M, Topper R, Noth J ( 1998): Interhemispheric inhibition in patients with multiple sclerosis. Electroencephalogr Clin Neurophysiol 109: 230–237. [DOI] [PubMed] [Google Scholar]
- Cader S, Johansen‐Berg H, Wylezinska M, Palace J, Behrens TE, Smith S, Matthews PM ( 2007): Discordant white matter N‐acetylasparate and diffusion MRI measures suggest that chronic metabolic dysfunction contributes to axonal pathology in multiple sclerosis. Neuroimage 36: 19–27. [DOI] [PubMed] [Google Scholar]
- Chen R, Yung D, Li JY ( 2003): Organization of ipsilateral excitatory and inhibitory pathways in the human motor cortex. J Neurophysiol 89: 1256–1264. [DOI] [PubMed] [Google Scholar]
- Ciccarelli O, Werring DJ, Barker GJ, Griffin CM, Wheeler‐Kingshott CA, Miller DH, Thompson AJ ( 2003): A study of the mechanisms of normal‐appearing white matter damage in multiple sclerosis using diffusion tensor imaging—Evidence of Wallerian degeneration. J Neurol 250: 287–292. [DOI] [PubMed] [Google Scholar]
- Daskalakis ZJ, Christensen BK, Fitzgerald PB, Roshan L, Chen R ( 2002): The mechanisms of interhemispheric inhibition in the human motor cortex. J Physiol 543 ( Part 1): 317–326. [DOI] [PMC free article] [PubMed] [Google Scholar]
- Duque J, Murase N, Celnik P, Hummel F, Harris‐Love M, Mazzocchio R, Olivier E, Cohen LG ( 2007): Intermanual differences in movement‐related interhemispheric inhibition. J Cogn Neurosci 19: 204–213. [DOI] [PubMed] [Google Scholar]
- Evangelou N, Esiri MM, Smith S, Palace J, Matthews PM ( 2000): Quantitative pathological evidence for axonal loss in normal appearing white matter in multiple sclerosis. Ann Neurol 47: 391–395. [PubMed] [Google Scholar]
- Ferbert A, Priori A, Rothwell JC, Day BL, Colebatch JG, Marsden CD ( 1992): Interhemispheric inhibition of the human motor cortex. J Physiol (Lond) 453: 525–546. [DOI] [PMC free article] [PubMed] [Google Scholar]
- Filippi M, Tortorella C, Bozzali M ( 1999): Normal‐appearing white matter changes in multiple sclerosis: The contribution of magnetic resonance techniques. Mult Scler 5: 273–282. [DOI] [PubMed] [Google Scholar]
- Filippi M, Iannucci G, Cercignani M, Assunta Rocca M, Pratesi A, Comi G ( 2000): A quantitative study of water diffusion in multiple sclerosis lesions and normal‐appearing white matter using echo‐planar imaging. Arch Neurol 57: 1017–1021. [DOI] [PubMed] [Google Scholar]
- Fisniku LK, Brex PA, Altmann DR, Miszkiel KA, Benton CE, Lanyon R, Thompson AJ, Miller DH ( 2008): Disability and T2 MRI lesions: A 20‐year follow‐up of patients with relapse onset of multiple sclerosis. Brain 131 ( Part 3): 808–817. [DOI] [PubMed] [Google Scholar]
- Ge Y, Law M, Johnson G, Herbert J, Babb JS, Mannon LJ, Grossman RI ( 2004): Preferential occult injury of corpus callosum in multiple sclerosis measured by diffusion tensor imaging. J Magn Reson Imaging 20: 1–7. [DOI] [PubMed] [Google Scholar]
- Hofer S, Frahm J ( 2006): Topography of the human corpus callosum revisited—Comprehensive fiber tractography using diffusion tensor magnetic resonance imaging. Neuroimage 32: 989–994. [DOI] [PubMed] [Google Scholar]
- Höppner J, Kunesch E, Buchmann J, Hess A, Grossmann A, Benecke R ( 1999): Demyelination and axonal degeneration in corpus callosum assessed by analysis of transcallosally mediated inhibition in multiple sclerosis. Clin Neurophysiol 110: 748–756. [DOI] [PubMed] [Google Scholar]
- Irlbacher K, Brocke J, Mechow JV, Brandt SA ( 2007): Effects of GABA(A) and GABA(B) agonists on interhemispheric inhibition in man. Clin Neurophysiol 118: 308–316. [DOI] [PubMed] [Google Scholar]
- Jung P, Beyerle A, Humpich M, Neumann‐Haefelin T, Lanfermann H, Ziemann U ( 2006): Ipsilateral silent period: A marker of callosal conduction abnormality in early relapsing‐remitting multiple sclerosis? J Neurol Sci 250: 133–139. [DOI] [PubMed] [Google Scholar]
- Kappos L, Freedman MS, Polman CH, Edan G, Hartung HP, Miller DH, Montalban X, Barkhof F, Radu EW, Bauer L, Dahms S, Lanius V, Pohl C, Sandbrink R ( 2007): Effect of early versus delayed interferon beta‐1b treatment on disability after a first clinical event suggestive of multiple sclerosis: A 3‐year follow‐up analysis of the BENEFIT study. Lancet 370: 389–397. [DOI] [PubMed] [Google Scholar]
- Kukaswadia S, Wagle‐Shukla A, Morgante F, Gunraj C, Chen R ( 2005): Interactions between long latency afferent inhibition and interhemispheric inhibitions in the human motor cortex. J Physiol 563 ( Part 3): 915–924. [DOI] [PMC free article] [PubMed] [Google Scholar]
- Kurtzke JF ( 1983): Rating neurologic impairment in multiple sclerosis: An expanded disability status scale (EDSS). Neurology 33: 1444–1452. [DOI] [PubMed] [Google Scholar]
- Lazar M, Weinstein DM, Tsuruda JS, Hasan KM, Arfanakis K, Meyerand ME, Badie B, Rowley HA, Haughton V, Field A, Alexander AL ( 2003): White matter tractography using diffusion tensor deflection. Hum Brain Mapp 18: 306–321. [DOI] [PMC free article] [PubMed] [Google Scholar]
- Le Bihan D ( 2003): Looking into the functional architecture of the brain with diffusion MRI. Nat Rev Neurosci 4: 469–480. [DOI] [PubMed] [Google Scholar]
- Lee M, Reddy H, Johansen‐Berg H, Pendlebury S, Jenkinson M, Smith S, Palace J, Matthews PM ( 2000): The motor cortex shows adaptive functional changes to brain injury from multiple sclerosis. Ann Neurol 47: 606–613. [PubMed] [Google Scholar]
- Lenzi D, Conte A, Mainero C, Frasca V, Fubelli F, Totaro P, Caramia F, Inghilleri M, Pozzilli C, Pantano P ( 2007): Effect of corpus callosum damage on ipsilateral motor activation in patients with multiple sclerosis: A functional and anatomical study. Hum Brain Mapp 28: 636–644. [DOI] [PMC free article] [PubMed] [Google Scholar]
- Losseff NA, Miller DH, Kidd D, Thompson AJ ( 2001): The predictive value of gadolinium enhancement for long term disability in relapsing‐remitting multiple sclerosis—Preliminary results. Mult Scler 7: 23–25. [DOI] [PubMed] [Google Scholar]
- Manson SC, Palace J, Frank JA, Matthews PM ( 2006): Loss of interhemispheric inhibition in patients with multiple sclerosis is related to corpus callosum atrophy. Exp Brain Res 174: 728–733. [DOI] [PubMed] [Google Scholar]
- Manson SC, Wegner C, Filippi M, Barkhof F, Beckmann C, Ciccarelli O, De Stefano N, Enzinger C, Fazekas F, Agosta F, Gass A, Hirsch J, Johansen‐Berg H, Kappos L, Korteweg T, Polman C, Mancini L, Manfredonia F, Marino S, Miller DH, Montalban X, Palace J, Rocca M, Ropele S, Rovira A, Smith S, Thompson A, Thornton J, Yousry T, Frank JA, Matthews PM ( 2008): Impairment of movement‐associated brain deactivation in multiple sclerosis: Further evidence for a functional pathology of interhemispheric neuronal inhibition. Exp Brain Res 187: 25–31. [DOI] [PMC free article] [PubMed] [Google Scholar]
- Mathiowetz V, Volland G, Kashman N, Weber K ( 1985): Adult norms for the Box and Block Test of manual dexterity. Am J Occup Ther 39: 386–391. [DOI] [PubMed] [Google Scholar]
- Mezzapesa DM, Rocca MA, Rodegher M, Comi G, Filippi M ( 2008): Functional cortical changes of the sensorimotor network are associated with clinical recovery in multiple sclerosis. Hum Brain Mapp 29: 562–573. [DOI] [PMC free article] [PubMed] [Google Scholar]
- Miller DH, Thompson AJ, Filippi M ( 2003): Magnetic resonance studies of abnormalities in the normal appearing white matter and grey matter in multiple sclerosis. J Neurol 250: 1407–1419. [DOI] [PubMed] [Google Scholar]
- Moseley ME, Cohen Y, Kucharczyk J, Mintorovitch J, Asgari HS, Wendland MF, Tsuruda J, Norman D ( 1990): Diffusion‐weighted MR imaging of anisotropic water diffusion in cat central nervous system. Radiology 176: 439–445. [DOI] [PubMed] [Google Scholar]
- Müller‐Dahlhaus JF, Liu Y, Ziemann U ( 2008): Inhibitory circuits and the nature of their interactions in the human motor cortex a pharmacological TMS study. J Physiol 586: 495–514. [DOI] [PMC free article] [PubMed] [Google Scholar]
- Ni Z, Gunraj C, Nelson AJ, Yeh IJ, Castillo G, Hoque T, Chen R ( 2008): Two phases of interhemispheric inhibition between motor related cortical areas and the primary motor cortex in human. Cereb Cortex 19: 1654–1665. [DOI] [PubMed] [Google Scholar]
- Nimsky C, Ganslandt O, Fahlbusch R ( 2006): Implementation of fiber tract navigation. Neurosurgery 58( 4, Suppl 2):ONS‐292–303; discussion ONS‐303–294. [DOI] [PubMed] [Google Scholar]
- Oldfield RC ( 1971): The assessment and analysis of handedness: The Edinburgh inventory. Neuropsychologia 9: 97–113. [DOI] [PubMed] [Google Scholar]
- Pajevic S, Pierpaoli C ( 1999): Color schemes to represent the orientation of anisotropic tissues from diffusion tensor data: Application to white matter fiber tract mapping in the human brain. Magn Reson Med 42: 526–540. [PubMed] [Google Scholar]
- Pantano P, Iannetti GD, Caramia F, Mainero C, Di Legge S, Bozzao L, Pozzilli C, Lenzi GL ( 2002a): Cortical motor reorganization after a single clinical attack of multiple sclerosis. Brain 125 ( Part 7): 1607–1615. [DOI] [PubMed] [Google Scholar]
- Pantano P, Mainero C, Iannetti GD, Caramia F, Di Legge S, Piattella MC, Pozzilli C, Bozzao L, Lenzi GL ( 2002b): Contribution of corticospinal tract damage to cortical motor reorganization after a single clinical attack of multiple sclerosis. Neuroimage 17: 1837–1843. [DOI] [PubMed] [Google Scholar]
- Pelletier J, Suchet L, Witjas T, Habib M, Guttmann CR, Salamon G, Lyon‐Caen O, Cherif AA ( 2001): A longitudinal study of callosal atrophy and interhemispheric dysfunction in relapsing‐remitting multiple sclerosis. Arch Neurol 58: 105–111. [DOI] [PubMed] [Google Scholar]
- Polman CH, Reingold SC, Edan G, Filippi M, Hartung HP, Kappos L, Lublin FD, Metz LM, McFarland HF, O'Connor PW, Sandberg‐Wollheim M, Thompson AJ, Weinshenker BG, Wolinsky JS ( 2005): Diagnostic criteria for multiple sclerosis: 2005 revisions to the “McDonald Criteria.” Ann Neurol 58: 840–846. [DOI] [PubMed] [Google Scholar]
- Ranjeva JP, Pelletier J, Confort‐Gouny S, Ibarrola D, Audoin B, Le Fur Y, Viout P, Cherif AA, Cozzone PJ ( 2003): MRI/MRS of corpus callosum in patients with clinically isolated syndrome suggestive of multiple sclerosis. Mult Scler 9: 554–565. [DOI] [PubMed] [Google Scholar]
- Reddy H, Narayanan S, Arnoutelis R, Jenkinson M, Antel J, Matthews PM, Arnold DL ( 2000): Evidence for adaptive functional changes in the cerebral cortex with axonal injury from multiple sclerosis. Brain 123 ( Part 11): 2314–2320. [DOI] [PubMed] [Google Scholar]
- Reddy H, Narayanan S, Woolrich M, Mitsumori T, Lapierre Y, Arnold DL, Matthews PM ( 2002): Functional brain reorganization for hand movement in patients with multiple sclerosis: Defining distinct effects of injury and disability. Brain 125 ( Part 12): 2646–2657. [DOI] [PubMed] [Google Scholar]
- Rocca MA, Gallo A, Colombo B, Falini A, Scotti G, Comi G, Filippi M ( 2004): Pyramidal tract lesions and movement‐associated cortical recruitment in patients with MS. Neuroimage 23: 141–147. [DOI] [PubMed] [Google Scholar]
- Rocca MA, Colombo B, Falini A, Ghezzi A, Martinelli V, Scotti G, Comi G, Filippi M ( 2005): Cortical adaptation in patients with MS: A cross‐sectional functional MRI study of disease phenotypes. Lancet Neurol 4: 618–626. [DOI] [PubMed] [Google Scholar]
- Rothwell JC, Hallett M, Berardelli A, Eisen A, Rossini P, Paulus W ( 1999): Magnetic stimulation: Motor evoked potentials. The international federation of clinical neurophysiology. Electroencephalogr Clin Neurophysiol Suppl 52: 97–103. [PubMed] [Google Scholar]
- Rovaris M, Gass A, Bammer R, Hickman SJ, Ciccarelli O, Miller DH, Filippi M ( 2005): Diffusion MRI in multiple sclerosis. Neurology 65: 1526–1532. [DOI] [PubMed] [Google Scholar]
- Schmierer K, Niehaus L, Röricht S, Meyer BU ( 2000): Conduction deficits of callosal fibres in early multiple sclerosis. J Neurol Neurosurg Psychiatry 68: 633–638. [DOI] [PMC free article] [PubMed] [Google Scholar]
- Wahl M, Lauterbach‐Soon B, Hattingen E, Jung P, Singer O, Volz S, Klein JC, Steinmetz H, Ziemann U ( 2007): Human motor corpus callosum: Topography, somatotopy, and link between microstructure and function. J Neurosci 27: 12132–12138. [DOI] [PMC free article] [PubMed] [Google Scholar]
- Yousry T, Schmid U, Alkadhi H, Schmidt D, Peraud A, Buettner A, Winkler P ( 1997): Localization of the motor hand area to a knob on the precentral gyrus. Brain 120: 141–157. [DOI] [PubMed] [Google Scholar]
- Zaitsev M, Hennig J, Speck O ( 2004): Point spread function mapping with parallel imaging techniques and high acceleration factors: Fast, robust, and flexible method for echo‐planar imaging distortion correction. Magn Reson Med 52: 1156–1166. [DOI] [PubMed] [Google Scholar]
- Zarei M, Johansen‐Berg H, Smith S, Ciccarelli O, Thompson AJ, Matthews PM ( 2006): Functional anatomy of interhemispheric cortical connections in the human brain. J Anat 209: 311–320. [DOI] [PMC free article] [PubMed] [Google Scholar]