

Abstract
Background
The appropriate dose of vitamin D supplementation in children is still debated. We calculated that the recommended dose of 600–1000 IU vitamin D3/day is not sufficient to reach a serum 25-hydroxyvitamin D (25-OH-D) level of at least 30 ng/ml (75 nmol/l) in north Italian children > 12 months. The aim of this study was to analyse the effect of seasonal supplementation with 1500 IU (=37.5 μg) vitamin D3/day.
Methods
DINOS (D-vitamIN Oral Supplementation) study was a pilot, monocentric, non-random case-control register study. It was conducted in a paediatric primary care setting near Padova (North Italy, 45°N latitude). The data of 203 children (girls:boys 1:1,33) aged 2–15 years, collected between November 2010 and January 2015, were analysed. Active group A (n = 82) were given 1500 IU vitamin D3/day from November to April; control Group B (n = 121) received no supplementation. The serum 25-OH-D test was part of a laboratory tests panel and performed using a chemiluminescence immunoassay method.
Results
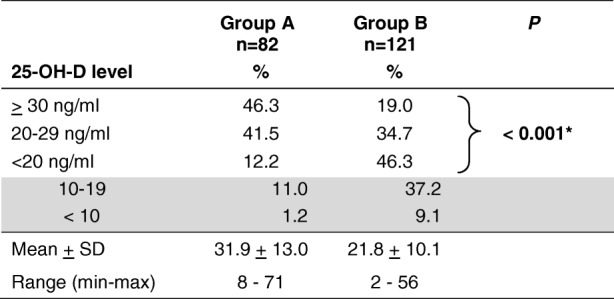
Serum 25-OH-D mean level + standard deviation throughout the period was 32 + 13 ng/ml (80 + 32 nmol/l) in group A vs 22 + 10 ng/ml (55 + 25 nmol/l) in group B. In group A 12% had vitamin D deficiency 25-OH-D < 20 ng/ml (50 nmol/l) and 1.2% severe vitamin D deficiency 25-OH-D < 10 ng/ml (25 nmol/l). In group B 46% had vitamin D deficiency and 9% severe deficiency (P < 0.001). In group A mean levels were normal or near-normal all the year except in May. Group B reached mean 25-OH-D levels close to 30 ng/ml (75 nmol/l) only in late summer. The active group mean 25-OH-D level was normal in preschoolers and schoolers but not in adolescents. Non-white children had a three-times vitamin D deficiency probability despite supplementation.
Conclusions
Vitamin D supplementation with at least 1500 IU vitamin D3/day from November to April was found appropriate for children in North Italy. A prolongation until May could be useful. Higher doses and/or prolonged periods could be more appropriate especially in adolescents and in non-white children.
Study registration
DINOS gained the approval of Padova Ethics Committee (n. 3960/U16/2016).
Electronic supplementary material
The online version of this article (10.1186/s13052-018-0590-x) contains supplementary material, which is available to authorized users.
Keywords: Vitamin D, Vitamin D3, Cholecalciferol supplementation, 25-hydroxycholecalciferol, Hypovitaminosis D, Vitamin D deficiency, Vitamin D insufficiency, Seasonal variation, Paediatric primary care, Family paediatrician
Background
Hypovitaminosis D is highly prevalent worldwide in children and adolescents [1–3], as well as in adults [4]. There are several studies on vitamin D status of children living in North Italy [5–13] but only one was an intervention study, using vitamin D3 (cholecalciferol) [11], and one in paediatric primary care setting [9]. In this research severe vitamin D deficiency (25-OH-D < 10 ng/ml) was rare as in other studies [14–17], but subclinical vitamin D deficiency or insufficiency frequently occurred, as previously described in otherwise healthy people [12, 14, 18, 19].
Various sources recommend 600 IU (1 IU = 25 ng) vitamin D per day for children between 1 and 17 years [20–22]. A recent publication of the Italian Health Minister states that in schoolchildren and adolescents a supplementation is highly recommended if adequate dietary intake and sufficient sun exposure are not guaranteed [23]; this paper suggests an estimate dose of 400–1000 IU per day. The Italian 2015 Consensus recommends 600–1000 IU/day as prophylaxis in children aged 1–17 years at risk of hypovitaminosis D [24].
A recent study on Italian children with moderate vitamin D deficiency (25-OH-D 11–20 ng/ml) demonstrated that a dose of 400 IU vitamin D3/day is insufficient to restore adequate 25-OH-D levels [11]. Assuming that most children living in our research area had less or much less than the minimum desirable level of 25-OH-D [9] and considering that for every supplementary 100 IU/day we can expect an increase of 0.5–1.5 ng/ml in the serum level of 25-OH-D [11, 25–32], we considered that the recommended doses of 600–1000 IU/day would offer no benefit to children with 25-OH-D < 10 ng/ml and even < 20 ng/ml. On this theorical basis, given the high probability of having insufficient or deficient children, to reach the minimum desirable level in most children we decided to prescribe our patients > 12 months 1500 IU (= 37.5 microg) vitamin D3/day from November to April. This dose corresponds to Holick’s suggestion [33] and is about half of the tolerable (safe) upper limit for vitamin D stated by the IOM Committee: 2500 IU/day for children aged 1–3 years, 3000 IU/day for 4–8 years, 4000 for 9 years or older [20]. The European Food Safety Authority (EFSA) has stated a tolerable upper intake level of 2000 IU/day for children from 1 to 10 years of age and of 4000 IU/day for children from 11 to 17 years [34]. The ESPGHAN Committee on Nutrition agreed with this statement [35].
Methods
Patients and methods
DINOS (D-vitamIN Oral Supplementation) study is a pilot, monocentric, non-random case-control register study on vitamin D3 1500 IU/day versus no supplementation. Data of over 1000 children till 15 years of age living in a rural area near Padova (Italy, 45°N latitude) were made available for analysis in the electronic medical record system of a primary care paediatrician (PCP, or family paediatrician). In Italy a PCP provides comprehensive and continuing free health care to children, ordinarily from 0 to 14 years of age, as recommended by the European Academy of Paediatrics [36]. All children having at least one serum 25-OH-D measurement between November 2010 and January 2015 were identified; the 25-OH-D test was part of a panel of laboratory tests prescribed for various clinical reasons (such as suspected anaemia, poor growth, fatigue, etc).
Inclusion criteria
age 2–15 years, and
1500 IU vitamin D3/day from November to April (active group A) or no vitamin D supplementation over the last 12 months (control group B), and
written consent to the study
Exclusion criteria
any disorder known to affect bone metabolism
use of medications inactivating vitamin D
other doses of vitamin D3 than 1500 IU/day
age < 24 months
serious disease potentially interfering with the smooth running of the study.
All eligible children (fulfilling all the mentioned inclusion criteria and having no exclusion criteria) were consecutively enrolled in the study. They were 203 children aged 2–15 years (girls:boys 1:1,33), representing about 20% of those registered in the medical record system. Group B children (n = 121), enlisted since November 2010, had not received any vitamin D supplementation because at that time there was no official Italian NHS vitamin D policy for children older than 1 year. Group A children (n = 82), enlisted since October 2012, had received 1500 IU vitamin D3/day from November to April.
Considering that data from different years were collected, we monitored solar radiation in our area (www.arpaveneto.it).
The used dose of vitamin D3 supplementation was within safety range suggested by scientific societies or authorities [20, 34, 35]. An oral olive oil solution (vitamin D3 10,000 IU/ml, 1 drop = 250 IU) was used.
Parathyroid hormone (PTH), alkaline phosphatase, calcium and phosphorus tests were done only in a few children because the purpose of the study was to analyse the effect of supplementation with 1500 IU vitamin D3/day on vitamin D status and not biochemical consequences of hypovitaminosis D.
All blood samples were obtained between 07:30 am and 09:00 am after an overnight fast. The serum level of 25-OH-D was measured using a chemiluminescence immunoassay method. The laboratory normal minimum was 30 ng/ml (ng/ml × 2.496 = nmol/l), as suggested by several scientific societies [37–41]. Values < 30 ng/ml were considered as hypovitaminosis D. Insufficiency was considered between 20 and 30 ng/ml (this extreme excluded) [39], deficiency as < 20 ng/ml, severe deficiency as < 10 ng/ml [20, 35, 39]. Levels above 100 ng/ml were considered as hypervitaminosis [42]. Vitamin D intoxication is observed with levels > 150 ng/ml [35, 42, 43].
Collected data include age, sex, ethnicity, skin colour, body mass index (BMI) and income. None of the children were vegetarian. In Italy shelf food is generally not fortified with vitamin D. Groups A and B were divided into ages 2–5 (preschoolers), 6–10 (schoolers) and 11–15 years (adolescents). BMI was calculated using the formula weight/square height (kg/m2). Children were divided into four categories considering their age and sex percentile according to the method of Cole and Green [44], the Italian growth charts [45] and the WHO definition of underweight [46]: underweight (< 5th percentile), healthy weight (5th < 85th percentile), overweight (85th < 95th percentile), obese (> 95th percentile).
Low-income families were defined as those exempt from NHS prescription charge.
Statistical analysis
All collected data were statistically described and analysed. Absolute and percent frequencies were used for qualitative variables; mean, standard deviation (SD), range and median were used to summarize quantitative variables. Fisher’s exact test and chi-square test were used to compare the main variables distribution between treated and untreated children or subpopulations (Fisher’s exact test was used to compare sex, race, skin colour and income between treated and untreated children; chi-square was used to compare vitamin D status according to treatment or skin colour). t-test was used to explore the presence of differences in means of the main numerical variables between subpopulations (e.g. mean serum levels of 25-OH-D in age groups). Pearson’s correlation was used to verify the presence of linear correlations. The significance level of 0.05 (P) was used. SAS® software (SAS Institute Inc., Cary, North Carolina, USA) was used for statistical analysis.
25-OH-D levels of groups A and B were compared month to month and quarter to quarter to exclude seasonal effects [6, 9].
Sample size calculation
The minimal sample size for each group was calculated 58. Considered parameters: a) an increase of at least 10 ng/ml in serum 25-OH-D levels; b) a population with a basal mean value 20.0 and SD 16.6 ng/ml [8]; c) a significance level P = 0.05 and a power of 90%.
Results
Demographic and physical characteristics
Between November 2010 and January 2015, serum 25-OH-D level was measured in 203 children. Active group A (n = 82) were given 1500 IU vitamin D3/day from November to April; control group B (n = 121) had not received any vitamin D supplementation over the last 12 months. About 25% of the children were first generation immigrants. See Table 1 for the full description of the demographic and physical characteristics and the ethnic make-up of groups A and B.
Table 1.
Demographic and physical characteristics of children (n = 203)

§ Group A non-Caucasians 11: North Africans 6, Latin Americans 3, and sub-Saharan Africans 2. Group B non-Caucasians 18: North Africans 12, Asians 3, Latin Americans 2, and sub-Saharan African 1
n = number of children in each group
*below P significance level
Prevalence of Hypovitaminosis D
25-OH-D varied from 8 to 71 ng/ml in group A and from 2 to 56 ng/ml in group B; the mean level in groups A and B was 31.9 ng/ml (SD = 13.0 ng/ml; interquartile range 23–38 ng/ml) and 21.8 ng/ml (SD = 10.1 ng/ml; interquartile range 16–27 ng/ml), respectively (P < 0.001). Only 19.0% of group A had a normal level vs. 46.3% of group B. In group A 12.2% had vitamin D deficiency and 1.2% had severe vitamin D deficiency. In group B 46.3% had vitamin D deficiency and 9.1% had severe vitamin D deficiency, these differences being statistically significant (P < 0.001): see Table 2. The datasets concerning children of group A and group B are presented in tabular form in Additional files 1 and 2 respectively.
Table 2.
Distribution of children per 25-OH-D level
n = number of children in each group; * Chi-square test
High 25-OH-D levels
With regard to the upper levels, in active group A 6% had 25-OH-D > 56 ng/ml (the maximum level reached by group B), 5% had a 25-OH-D level > 60 ng/ml and the maximum 25-OH-D level was 71 ng/ml. There were no side effects.
Age effect of vitamin D3 supplementation
In control group B preschoolers, schoolers and adolescents had similar mean 25-OH-D levels around 21–22 ng/ml. In group A only preschoolers and schoolers had a statistically significant higher mean value in comparison to the same age of group B both of them above 30 ng/ml (Table 3). In adolescents 1500 IU vitamin D3/day caused only a slight increase of mean 25-OH-D level in the range of insufficiency, although the deficiency rate passed from 54 to 5%, with normal and insufficient children 25 and 70%, respectively (data not shown in the Table). For every supplementary 100 IU/day we found a rise of serum 25-OH-D of 0.93, 0.59 and 0.33 ng/ml in preschoolers, schoolers and adolescents, respectively (Table 3).
Table 3.
Mean serum levels of 25-OH-D (ng/ml) per age group
| Total | Groups | Rise (ng/ml) | T-test | |||
|---|---|---|---|---|---|---|
| A. Suppl. | B. No suppl. | every extra 100 IU/day | P | |||
| 2–5 years | n | 91 | 38 | 53 | ||
| Mean ± SD | 35.2 ± 14.1 | 21.3 ± 11.4 | 0.93 | < 0.0001* | ||
| 6–10 years | n | 68 | 24 | 44 | ||
| Mean ± SD | 31.1 ± 12.9 | 22.3 ± 8.6 | 0.59 | 0.0013* | ||
| 11–15 years | n | 44 | 20 | 24 | ||
| Mean ± SD | 26.8 ± 8.8 | 21.8 ± 9.8 | 0.33 | 0.0850 | ||
n = number of children in each group
*below P significance level
Vitamin D status according to skin colour
In control group B white children had a significantly higher mean 25-OH-D level in comparison to non-white children (23.1 + 9.8 vs. 14.2 + 7.9 ng/ml; P = 0.001). This difference was not present in group A (white 31.7 + 11.7 vs. non-white 33.7 + 19.8 ng/ml). However, non-white children had a higher vitamin D deficiency probability in comparison to white children (three times in group A: 27.3% vs 9.9%; double in group B: 77.8% vs. 40.8%): see Table 4.
Table 4.
Vitamin D status according to skin colour
| Group A n = 82 | Group B n = 121 | |||
|---|---|---|---|---|
| Non-white n = 11 | White n = 71 | Non-white n = 18 | White n = 103 | |
| 25-OH-D level | % | % | % | % |
| > 30 ng/ml | 45.5 | 46.5 | – | 22.3 |
| 20–29 ng/ml | 27.3 | 43.7 | 22.2 | 36.9 |
| < 20 ng/ml | 27.3 | 9.9 | 77.8 | 40.8 |
| All | 100.0 | 100.0 | 100.0 | 100.0 |
| Chi-square test ( P ) | 0.225 | 0.009* | ||
n = number of children in each group; * below P significance level
None out of the 18 group A non-white children had 25-OH-D > 30 ng/ml. Among non-white children in group B, Africans had the lowest mean value (13.0 + 7.7 ng/ml).
Period of blood withdrawal
The analysis of mean 25-OH-D levels per month is represented in Table 5.
Table 5.
Mean serum levels of 25-OH-D (ng/ml) per month
| Total | Groups | T-test P | |||
|---|---|---|---|---|---|
| A. Suppl. | B. No suppl. | ||||
| 01. January | n | 29 | 14 | 15 | 0.009* |
| Mean | 21.6 | 26.6 | 16.9 | ||
| 02. February | n | 24 | 11 | 13 | 0.007* |
| Mean | 27.8 | 36.0 | 20.8 | ||
| 03. March | n | 16 | 8 | 8 | 0.014* |
| Mean | 25.5 | 36.5 | 14.5 | ||
| 04. April | n | 16 | 2 | 14 | 0.046* |
| Mean | 18.6 | 30.5 | 16.9 | ||
| 05. May | n | 23 | 8 | 15 | 0.861 |
| Mean | 24.8 | 25.4 | 24.5 | ||
| 06. June | n | 21 | 10 | 11 | 0.096 |
| Mean | 23.8 | 28.6 | 19.4 | ||
| 07. July | n | 16 | 9 | 7 | 0.627 |
| Mean | 29.4 | 30.7 | 27.9 | ||
| 08. August | n | 12 | 7 | 5 | 0.574 |
| Mean | 36.8 | 38.4 | 34.6 | ||
| 09. September | n | 10 | 3 | 7 | 0.295 |
| Mean | 30.4 | 36.0 | 28.0 | ||
| 10. October | n | 10 | 4 | 6 | 0.049* |
| Mean | 29.2 | 38.3 | 23.2 | ||
| 11. November | n | 12 | 3 | 9 | 0.476 |
| Mean | 26.0 | 35.0 | 23.0 | ||
| 12. December | n | 14 | 3 | 11 | 0.228 |
| Mean | 26.3 | 32.7 | 24.5 | ||
n = number of children in each group
*below P significance level
Group A had a higher mean 25-OH-D level than group B also outside the supplementation period. Children receiving supplementation showed normal to near-normal 25-OH-D levels in all months except in May. Group B demonstrated deficiency levels in 4 out of the first 6 months of the year and insufficiency in the other 2 months.
Children without supplementation showed a normal or near-normal mean level only in the third quarter of the year (mean level from July to September: 29.7 ng/ml).
The seasonal effect on 25-OH-D levels is represented in Fig. 1 and Table 6.
Fig. 1.
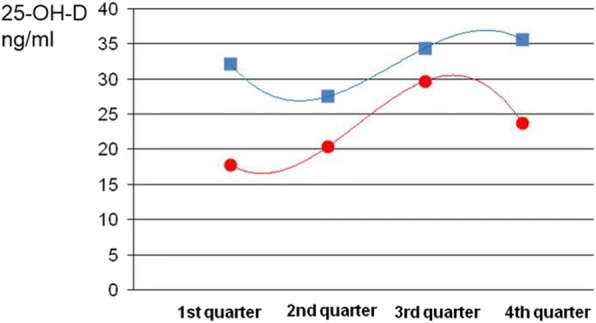
25-OH-D level according to period of blood withdrawal. Blue line: quarterly trend in supplemented children. Red line: quarterly trend in not supplemented children
Table 6.
Serum levels of 25-OH-D (ng/ml) per quarter
| 1st Quarter | 2nd Quarter | 3rd Quarter | 4th Quarter | |||||
|---|---|---|---|---|---|---|---|---|
| January–March | April–June | July–September | October–December | |||||
| Group A | Group B | Group A | Group B | Group A | Group B | Group A | Group B | |
| n | 33 | 36 | 20 | 40 | 19 | 19 | 10 | 26 |
| Mean | 32.1 | 17.8 | 27.5 | 20.4 | 34.4 | 29.7 | 35.6 | 23.7 |
| SD | 14.7 | 6.8 | 11.0 | 11.0 | 10.2 | 11.6 | 14.6 | 7.6 |
| Median | 28.0 | 19.0 | 27.0 | 18.0 | 35.0 | 29.0 | 29.5 | 24.5 |
| Range | 11–71 | 8–37 | 8–61 | 2–56 | 18–56 | 8–50 | 17–62 | 10–41 |
| Interq. range | 21–42 | 12.5–21 | 23–30.5 | 15–25.5 | 28–42 | 21–40 | 27–42 | 16–29 |
| T-test ( P ) | < 0.001* | 0.023* | 0.195 | 0.033* | ||||
n = number of children in each group; SD = standard deviation
*below P significance level
In sunny months mean solar radiation in the four consecutive years of observation was: 22.8 MJ/m2 in 2011, 21.7 in 2012, 21.3 in 2013 and 20.8 in 2014. Spring solar radiation has been relatively stable in these four years except for a slight increase in 2011: 24.2 MJ/m2 in 2011, 21.9 in 2012, 21.2 in 2013 and 22.6 in 2014; summer solar radiation has been relatively stable except for a slight decrease in 2014: 21.4 MJ/m2 in 2011, 21.5 in 2012, 21.4 in 2013 and 19.0 in 2014.
Follow-up of group a
All children in group A were followed up: during the last 12 months prior blood withdrawal they had 1–21 visits (7,1 + 4.1 mean + SD; interquartile range 4–9) and continuing vitamin D3 supplementation was recommended. Nevertheless there was no linear correlation between number of visits and 25-OH-D levels (P = 0.5928; ρ = − 0.05992).
Also children of group B had a similar follow-up.
Discussion
DINOS was conducted in a paediatric primary care setting on 203 children living in a rural area of North Italy near Padova (45°N latitude). The 25% of immigrants in this study was representative of Veneto region (21.7% of births between 1999 and 2011) [47]. Group A children (n = 82) received 1500 IU vitamin D3/day from November to April as seasonal supplementation; control group B (n = 121) received no supplementation. Serum levels of 25-OH-D were measured in children of both groups; this metabolite is considered the best indicator of overall vitamin D status as it reflects total vitamin D from dietary intake and sunlight exposure, in addition to the conversion of vitamin D from adipose stores in the liver [34, 39, 48].
Our prevalence of 9.1% children with severe vitamin D deficiency is similar to those reported in other studies [8, 12, 15]. It could lead to rickets or, more often, to slight hypovitaminosis D with negative health consequences [4, 49–51]. Pettifor has highlighted that also values of 25-OH-D > 10–15 ng/ml can be associated with rickets when calcium intake is poor [52]. In DINOS it is remarkable that four out of five children in group B had hypovitaminosis D and over 46% had serum 25-OH-D < 20 ng/ml, which is the cut-off mostly associated with vitamin D deficiency [17, 20, 35, 37, 48, 53]. Similar prevalences of serum 25-OH-D < 20 ng/ml were reported in a sample of healthy US adolescents [14] and in two Italian studies [8, 12], where non-white children had a higher deficiency risk in comparison to whites, in agreement with our study results.
The major source of vitamin D for humans is the conversion of 7-dehydrocholesterol into previtamin D3 in the skin through sun exposure [43]; a further thermic conversion produces vitamin D3. In the autumn and winter months the skin generates little to no vitamin D at latitudes above 37° N and under 37°S (vitamin D winter area) [54]; just 2° under 45°N (the latitude of our area) no vitamin D is produced during late autumn, winter, and the beginning of spring [55]. Given these seasonal data, we could compare the two groups in different timespans because at 45°N sun exposition is in any case ineffective. With regard to sunny months we must consider that our area is near the sea with a moderate climate and only small fluctuations in seasonal weather, as shown by solar radiation data.
We found that children without vitamin D3 supplementation had a mean level of 25-OH-D < 20 ng/ml in 4 out of the first 6 months of the year and insufficient in the other two months; only in late summer they reached serum 25-OH-D maximum levels about 30 ng/ml. This value may be considered a “natural” level. Also a prolonged or excessive exposure to sunlight does not produce a toxic amount of vitamin D3 because pre-vitamin D3 is rapidly photodegraded to a variety of inactive products and 25-OH-D levels naturally self-regulate [56]. These data suggest that in the absence of valid sun exposure a supplementation is necessary.
In a previous report [9] we have demonstrated that factors consistently associated with a low vitamin D status include non-white skin colour. In our DINOS Study none out of 18 non-white children without vitamin D supplementation had 25-OH-D > 30 ng/ml, in agreement with the literature [8, 12].
Some studies have demonstrated that overweight and obese children are at risk of hypovitaminosis D [57, 58]. In our research children receiving vitamin D3 supplementation had higher levels of 25-OH-D in spite of a significant tendency for being overweight (the composition of groups A and B did not differ except for BMI distribution).
Other factors (e.g. diet and estimated sunlight exposure) were not analysed, However, none of the children were vegetarian and in Italy shelf food is generally not fortified with vitamin D. Furthermore, it is well known that vitamin D status depends minimally on food intake: only 10% of the daily vitamin D requirement is provided by food [59], in the form of vitamin D2 (ergocalciferol, from plants, especially sun-exposed mushrooms) and vitamin D3 (cholecalciferol, from dairy products and fatty fish). For sunlight exposure we considered that our population was rather homogeneous and that children of group A and group B have similar baseline characteristics (age, sex, ethnicity, skin colour and income). Moreover, an Italian study on a larger group of children has demonstrated that lifestyle has a low impact on 25-OH-D levels [11].
The supplementary vitamin D dose depends both on baseline and target serum level of 25-OH-D as well as BMI [11, 60, 61] and genetic factors [61].
There are a few studies on the dose impact of vitamin D supplementation in children. In most of them the rise of 25-OH-D serum levels for every extra 100 IU/day of vitamin D intake varies between 0.5 and 1.5 ng/ml in non-obese children (Table 7).
Table 7.
Vitamin D supplementation: randomised controlled trials with children

*Doses equivalent to 200 IU/day (1400 IU/wk)
**Doses equivalent to 2000 IU/day (14,000 IU/wk)
F females, M Males
aStagi [11]
bAla-Houhala [25]
cSchou [26]
dEl-Hajj Fuleiham [27]
eViljakainen [28]
fMaalouf [29]
gPark [30]
hMølgaard [31]
iAguirre Castaneda [32]
jAbrams [63]
kLewis [67]
lCosenza [68]
mShanely [69]
nSacheck [70]
Generally, lower baseline values of 25-OH-D correlate with a higher increase and vice versa [29, 57, 60]. Furthermore, for a given dose of vitamin D3 we found a higher increase of 25-OH-D in children than in adolescents, as reported by Stagi et al. [11].
NHANES 2001–2006 data have demonstrated that only 10% of children taking vitamin D supplements at doses 100–400 IU/day were deficient and over 50% were insufficient [2]. However, it must be taken into account that in North America food is often fortified with vitamin D. This practice is common also in North European countries but not in Italy.
At the request of the US and Canadian governments the IOM calculated that a Recommended Dietary Allowance (RDA) of 600 IU/day ensures a 25-OH-D serum level of 20 ng/ml to 97.5% of the population aged 1–18 years [20]. Recently, Veugelers and Ekwaru [62] noted that the IOM estimate of 600 IU vitamin D/day as RDA is incorrect because of a statistical error; these authors concluded that with the current recommendation of 600 IU/day, bone health objectives and disease and injury prevention targets will not be met. The same dose of 600 IU/day was recommended by the AAP [21] and Italian LARN [22].
There is accumulating evidence to suggest that vitamin D intake should be in the range of at least 800–1000 IU/day [59, 61, 63]. The evidence-based recommendations by the Endocrine Society’s Clinical Practice Guidelines to prevent vitamin D deficiency states 400–1000 IU/day supplementation for children [64] as does the Italian Health Minister [23]. The Italian 2015 Consensus recommends 600–1000 IU/day in children aged 1–18 years at risk of hypovitaminosis D and 2000 IU/day for 6–8 weeks in children and adolescents with 25-OH-D < 20 ng/ml [24]. This strategy presupposes that we know the level of 25-OH-D in each patient but measurement of the 25-OH-D concentration is not routinely recommended [24]. Also Holick said it could be more cost-effective to implement a vitamin D supplementation program for all children and adults rather than measuring 25-OH-D levels. The cost of a 25-OH-D test corresponds to that of a ten month prophylaxis with 1000 IU vitamin D3/day. In our opinion a possible solution could be to prescribe a high enough dose for all children to correct a potential vitamin D deficiency within the hypervitaminosis safety range.
In our experience a vitamin D3 supplementation with 1500 IU/day for six months ensured a 25-OH-D > 30 ng/ml in about 50% and > 20 ng/ml in 88% of children. Only 6% of children in group A had 25-OH-D > 56 ng/ml, which is the maximum level reached by the control group. The maximum 25-OH-D level in group A was 71 ng/ml, well away from the hypervitaminosis cut-off.
A vitamin D3 dose of 1500 IU/day, as in DINOS, is higher than the indication for Italian children [23], although below the upper safety level, but still 12% of active group A had vitamin D deficiency. Higher doses could be more appropriate, especially in adolescents. In fact for the same dose of vitamin D3 we found a higher increase of serum 25-OH-D in children (preschoolers and schoolers 0.93 and 0.59 ng/ml, respectively, every supplementary 100 IU/day of vitamin D3) than in adolescents (0.33 ng/ml). For adolescents in North Italy 2000 IU vitamin D3/day might be more appropriate, according to Holick’s recommendation of 1500–2000 IU/day from 11 to 19 years of age and 1000–1500 IU/day from 1 to 10 years [33]. Given the 0.33 ng/ml rise of 25-OH-D every extra 100 IU/day found in our adolescents aged 11–15 years (see Table 3), a dose of 2500 IU vitamin D3/day might be prescribed in this age group to reach the minimum desirable level of 25-OH-D. Adolescence, indeed, is a crucial phase for bone development when the most rapid bone accrual occurs [65].
The concept of vitamin D winter area is well known [54], but scientific societies guidelines seldom go into detail on this argument. The Canadian Pediatric Society identifies the period from October to March at the latitude of Edmonton (52° N) [37]. Central Europe guidelines recommend prophylaxis between September and April or throughout the whole year if sufficient skin synthesis of vitamin D is not ensured in the summer [41]. The Italian 2015 Consensus suggests prophylaxis between November and April in children with risk factors of hypovitaminosis D [24]. However, a research on hospitalized children in North Italy found a higher rate of hypovitaminosis D between November and May [6]. In DINOS children receiving supplementation showed normal to near-normal 25-OH-D levels in all months except in May. On this basis we suggest a supplement prolongation until May could be useful. More prolonged periods could be appropriate especially in non-white children. The French Society of Pediatrics recommends vitamin D prohylaxis in non-Caucasian children all through the year [66].
Conclusions
This DINOS Study conducted on 203 children living in North Italy indicates that a daily supplementation with at least 1500 IU cholecalciferol from November to April is appropriate for most children in our region. A prolongation until May could be useful, as do higher doses and/or prolonged periods, especially in adolescents and in non-white children. The 25-OH-D level of 30 ng/ml reached in late summer by children not receiving vitamin D3 supplementation may be considered a “natural” level. Even if the results of our study are concerning North Italy, we think that the prevalence of hypovitaminosis and the effect of vitamin D supplementation are meaningful to others parts of the vitamin D winter area at the same latitude (45°N), from Ottawa (Canada) to Harbin (North China).
We invite for more research in this area. Prospective studies with larger numbers of subjects, possibly multicenter RCTs, are needed to further define vitamin D needs of all children living in North Italy and at the same latitude (45°N) in other countries and elsewhere in the world. It is of interest also to study the clinical advantage of chronic vitamin supplementation versus the burden of a continuous drug administration.
Additional files
Dataset of active group A (n = 82). (XLS 43 kb)
Dataset of control group B (n = 121). (XLS 95 kb)
Acknowledgements
Our heartfelt thanks to Ms. Lucia Macario (our Secretary) for the raw data collection and for having put up with us. Thanks to Dr. Lucia Falciglia for organizing and collecting written consents and to Mr. Paul van Gastel for proofreading this article.
Funding
No funding was received.
Availability of data and materials
All data analysed during this study are included in this published article and its supplementary information files.
Abbreviations
- 25-OH-D
25-hydroxyvitamin D
- AAP
American Academy of Pediatrics
- BMI
Body mass index
- EFSA
European food safety authority
- IOM
Institute of medicine
- LARN
Livelli di Assunzione di Riferimento di Nutrienti
- NHANES
National Health and Nutrition Examination Survey
- NHS
National health service
- PTH
Parathyroid hormone
- RCT
Randomized controlled trial
- SD
Standard deviation
- SIOMMMS
Società Italiana dell’Osteoporosi, del Metabolismo Minerale e delle Malattie dello Scheletro
- WHO
World Health Organization
Authors’ contributions
This study was a collaboration between all authors. Author SM visited the children, conceptualized and designed the study, did acquisition and analysis of the data and drafted the initial manuscript. Author GM participated in the analysis and in the interpretation of the data and in the drafting of the manuscript. Author DT participated in the interpretation of the data and critical evaluation of the manuscript. All authors read and approved the final manuscript.
Ethics approval and consent to participate
DINOS gained the approval of Padova Ethics Committee (n. 3960/U16/2016). The procedures were in accordance with the ethical standards of the Declaration of Helsinki; specific written informed consent from parents and from children over 12 years was obtained.
Consent for publication
Not applicable.
Competing interests
The authors declare that they have no competing interests.
Publisher’s Note
Springer Nature remains neutral with regard to jurisdictional claims in published maps and institutional affiliations.
Contributor Information
Stefano Mazzoleni, Email: stefano.mazzoleni@aulss6.veneto.it.
Giovanna Magni, Email: stat.magni@gmail.com.
Daniela Toderini, Email: daniela.toderini@aulss6.veneto.it.
References
- 1.Prentice A. Vitamin D deficiency: a global perspective. Nutr Rev. 2008;66(Suppl):S153–S164. doi: 10.1111/j.1753-4887.2008.00100.x. [DOI] [PubMed] [Google Scholar]
- 2.Mansbach M, Ginde AA, Camargo CA. Serum 25-Hydroxyvitamin D levels among US children aged 1 to 11 years: do children need more vitamin D? Pediatrics. 2009;124:1404–1410. doi: 10.1542/peds.2008-2041. [DOI] [PMC free article] [PubMed] [Google Scholar]
- 3.Rathi N, Rathi A. Vitamin D and child health in the 21st century. Indian Pediatr. 2011;48:619–625. doi: 10.1007/s13312-011-0107-9. [DOI] [PubMed] [Google Scholar]
- 4.Holick MF, Chen TC. Vitamin D deficiency: a worldwide problem with health consequences. Am J Clin Nutr. 2008;87:1080S–1086S. doi: 10.1093/ajcn/87.4.1080S. [DOI] [PubMed] [Google Scholar]
- 5.Lippi G, Montagnana M, Targher G. Vitamin D deficiency among Italian children. [Letter] Can Med Assoc J. 2007;177:1529–1530. doi: 10.1503/cmaj.1070102. [DOI] [PMC free article] [PubMed] [Google Scholar]
- 6.Marrone G, Rosso I, Moretti R, Valent F, Romanello C. Is vitamin D status known among children living in northern Italy? Eur J Nutr. 2011; [Epub ahead of print]. www.ncbi.nlm.nih.gov/pubmed/21541731. [DOI] [PubMed]
- 7.Lippi G, Montagnana M, Meschi T, Borghi L. Vitamin D concentration and deficiency across different ages and genders. Aging Clin Exp Res. 2012;24(5):548–551. doi: 10.3275/8263. [DOI] [PubMed] [Google Scholar]
- 8.Vierucci F, Del Pistoia M, Fanos M, Gori M, Carlone G, Erba P, et al. Vitamin D status and predictors of hypovitaminosis D in Italian children and adolescents: a cross sectional study. Eur J Pediatr. 2013;172:1607–1617. doi: 10.1007/s00431-013-2119-z. [DOI] [PubMed] [Google Scholar]
- 9.Mazzoleni S, Boscardin C, Toderini D. Low vitamin D status of northern Italian children in pediatric primary care setting: what to do? BJMMR. 2014;4:170–183. doi: 10.9734/BJMMR/2014/4370. [DOI] [Google Scholar]
- 10.Bellone S, Esposito S, Giglione E, Genoni G, Fiorito C, Petri A, et al. Vitamin D levels in a paediatric population of normal weight and obese subjects. J Endocrinol Investig. 2014;37:805–809. doi: 10.1007/s40618-014-0108-3. [DOI] [PubMed] [Google Scholar]
- 11.Stagi S, Pelosi P, Strano M, et al. Determinants of vitamin D levels in Italian children and adolescents: a longitudinal evaluation of cholecalciferol supplementation versus the improvement of factors influencing 25(OH)D status. Int J Endocrinol. 2014;2014:583039. doi: 10.1155/2014/583039. [DOI] [PMC free article] [PubMed] [Google Scholar]
- 12.Vierucci F, Del Pistoia M, Fanos M, et al. Prevalence of hypovitaminosis D and predictors of vitamin D status in Italian healthy adolescents. Ital J Pediatr. 2014;40:54. doi: 10.1186/1824-7288-40-54. [DOI] [PMC free article] [PubMed] [Google Scholar]
- 13.Franchi B, Piazza M, Sandri M, et al. 25-hydroxyvitamin D serum level in children of different ethnicity living in Italy. Eur J Pediatr. 2015;174:749–757. doi: 10.1007/s00431-014-2451-y. [DOI] [PubMed] [Google Scholar]
- 14.Gordon CM, DePeter KC, Feldman HA, Grace E, Emans SJ. Prevalence of vitamin D deficiency among healthy adolescents. Arch Pediatr Adolesc Med. 2004;158:531–537. doi: 10.1001/archpedi.158.6.531. [DOI] [PubMed] [Google Scholar]
- 15.Kumar J, Muntner P, Kaskel FJ, Hailpern SM, Melamed ML. Prevalence and associations of 25-hydroxyvitamin D deficiency in US children: NHANES 2001-2004. Pediatrics. 2009;124:e362–e370. doi: 10.1542/peds.2009-0051. [DOI] [PMC free article] [PubMed] [Google Scholar]
- 16.González-Gross M, Valtueña J, Breidenassel C, Moreno LA, Ferrari M, Kersting M, et al. HELENA Study Group. Vitamin D status among adolescents in Europe: the healthy lifestyle in Europe by nutrition in adolescence study. Br J Nutr. 2012;107:755–764. doi: 10.1017/S0007114511003527. [DOI] [PubMed] [Google Scholar]
- 17.Mallet E, Gaudelus J, Reinert P, Stagnara J, Benichou J, Basuyau JP, et al. Vitamin D status in 6- to 10-year-old children: a French multicenter study in 326 children. Arch Pediatr. 2014;21:1106–1114. doi: 10.1016/j.arcped.2014.04.012. [DOI] [PubMed] [Google Scholar]
- 18.Weng FL, Shults J, Leonard MB, Stallings VA, Zemel BS. Risk factors for low serum 25-hydroxyvitamin D concentrations in otherwise healthy children and adolescents. Am J Clin Nutr. 2007;86:150–158. doi: 10.1093/ajcn/86.1.150. [DOI] [PubMed] [Google Scholar]
- 19.Cashman KD, Dowling KG, Skrabáková Z, et al. Vitamin D deficiency in Europe: pandemic? Am J Clin Nutr. 2016;103:1033–1044. doi: 10.3945/ajcn.115.120873. [DOI] [PMC free article] [PubMed] [Google Scholar]
- 20.Ross AC, Manson JAE, Abrams SA, Aloia JF, Brannon PM, Clinton SK, et al. The 2011 report on dietary reference intakes for calcium and vitamin D from the Institute of Medicine: what clinicians need to know. J Clin Endocrinol Metab. 2011;96:53–58. doi: 10.1210/jc.2010-2704. [DOI] [PMC free article] [PubMed] [Google Scholar]
- 21.Golden NH, Abrams SA, and AAP Committee on Nutrition. Optimizing Bone Health in Children and Adolescents. Pediatrics 2014;134:e1229‑e1243. Published online September 29, 2014, doi: 10.1542/peds.2014-2173. http://pediatrics.aappublications.org/content/134/4/e1229.long [DOI] [PubMed]
- 22.LARN. Livelli di Assunzione di Riferimento di Nutrienti ed energia per la popolazione Italiana. Revisione . Accessed 9 March 2015. 2014. [Google Scholar]
- 23.Ministero della Salute. Raccomandazioni sul corretto utilizzo degli integratori alimentari. Età pediatrica. Integratori di vitamine e minerali. Accessed 15 March 2015 on www.salute.gov.it/imgs/C_17_pagineAree_1000_listaFile_itemName_6_file.pdf
- 24.di Mauro G, Saggese G, Vierucci F, et al. Vitamin D in pediatric age: consensus of the Italian Pediatric Society and the Italian Society of Preventive and Social Pediatrics, jointly with the Italian Federation of Pediatricians. First published by Pediatria preventiva & sociale. 2015;3(Suppl.):1-262. ISSN 1970-8165. https://www.sipps.it/pdf/rivista/anno10/2_3ss_2015.pdf. Now in Ital J Pediatr. 2018;44:51. 10.1186/s13052-018-0488-7https://www.ncbi.nlm.nih.gov/pmc/articles/PMC5941617/. [DOI] [PMC free article] [PubMed]
- 25.Ala-Houhala M, Koskinen T, Koskinen M, Visakorpi JK. Double blind study on the need for vitamin D supplementation in prepubertal children. Acta Paediatr Scand. 1988;77:89–93. doi: 10.1111/j.1651-2227.1988.tb10604.x. [DOI] [PubMed] [Google Scholar]
- 26.Schou AJ, Heuck C, Wolthers OD. Vitamin D supplementation to healthy children does not affect serum osteocalcin or markers of type I collagen turnover. Acta Paediatr. 2003;92:797–801. doi: 10.1111/j.1651-2227.2003.tb02535.x. [DOI] [PubMed] [Google Scholar]
- 27.El-Hajj Fuleihan G, Nabulsi M, Tamim H, et al. Effect of vitamin D replacement on musculoskeletal parameters in school children: a randomized controlled trial. J Clin Endocrinol Metab. 2006;91:405–412. doi: 10.1210/jc.2005-1436. [DOI] [PubMed] [Google Scholar]
- 28.Viljakainen HT, Natri A-M, Kärkkäinen M, Huttunen MM, Palssa A, Jakobsen J, et al. A positive dose-response effect of vitamin D supplementation on site-specific bone mineral augmentation in adolescent girls: a double-blinded randomized placebo-controlled 1-year intervention. J Bone Min Res. 2006;21:836–844. doi: 10.1359/jbmr.060302. [DOI] [PubMed] [Google Scholar]
- 29.Maalouf J, Nabulsi M, Vieth R, Kimball S, El-Rassi R, Mahfoud Z, et al. Short- and Long-Term Safety of Weekly High-Dose Vitamin D Supplementation in School Children. J Clin Endocrinol Metab. 2008;93:2693–701. 10.1210/jc.2007-2530 Published online 2008 April 29. https://www.ncbi.nlm.nih.gov/pmc/articles/PMC2729206/. [DOI] [PMC free article] [PubMed]
- 30.Park CY, Hill KM, Elble AE, Martin BR, DiMeglio LA, Peacock M, et al. Daily supplementation with 25 μg cholecalciferol does not increase calcium absorption or skeletal retention in adolescent girls with low serum 25-hydroxyvitamin D. J Nutr. 2010;140:2139–44. 10.3945/jn.110.124891 Epub 2010 Oct 20. https://academic.oup.com/jn/article/140/12/2139/4630575. [DOI] [PubMed]
- 31.Mølgaard C, Larnkjaer A, Cashman KD, et al. Does vitamin D supplementation of healthy Danish Caucasian girls affect bone turnover and bone mineralization? Bone. 2010;46:432–439. doi: 10.1016/j.bone.2009.08.056. [DOI] [PubMed] [Google Scholar]
- 32.Aguirre Castaneda R, Nader N, Weaver A, Singh R, Kumar S. Response to vitamin D3 supplementation in obese and non-obese Caucasian adolescents. Horm Res Paediatr. 2012;78:226–231. doi: 10.1159/000343446. [DOI] [PMC free article] [PubMed] [Google Scholar]
- 33.Holick MF. The D-lemma: to screen or not to screen for 25-Hydroxyvitamin D concentrations. Clin Chem. 2010;56:729–731. doi: 10.1373/clinchem.2009.139253. [DOI] [PubMed] [Google Scholar]
- 34.EFSA Panel on dietetic products, nutrition and allergies (NDA). Scientific opinion on the tolerable upper intake level of vitamin D. EFSA J. 2012;10:2813. https://efsa.onlinelibrary.wiley.com/doi/epdf/10.2903/j.efsa.2012.2813.
- 35.Braegger C, Campoy C, Colomb V, et al. ESPGHAN Committee on Nutrition. Vitamin D in the healthy European paediatric population. J Pediatr Gastroenterol Nutr. 2013;56:692–701. doi: 10.1097/MPG.0b013e31828f3c05. [DOI] [PubMed] [Google Scholar]
- 36.Stiris T, del Torso S, Mercier JC, Barak S, Wettergrem B, Ross-Russell R, et al. for the European Academy of Paediatrics. Improving paediatric care in the community. [Letter] Lancet. 2015;385(9977):1505. doi: 10.1016/S0140-6736(15)60745-0. [DOI] [PubMed] [Google Scholar]
- 37.Godel GC, Canadian Pediatric Society, First Nations, Inuit and Metis Health Committee Vitamin D supplementation: recommendations for Canadian mothers and infants. Paediatr Child Health. 2007;12:583–589. doi: 10.1093/pch/12.7.583. [DOI] [PMC free article] [PubMed] [Google Scholar]
- 38.Adami S, Romagnoli E, Carnevale V, Scillitani A, Giusti A, Rossini M, et al. Linee guida su prevenzione e trattamento dell’ipovitaminosi D con colecalciferolo. [Guidelines on prevention and treatment of vitamin D deficiency. The Italian Society for Osteoporosis, Mineral Metabolism and Bone Diseases (SIOMMMS)] Reumatismo. 2011;63:129–147. doi: 10.4081/reumatismo.2011.129. [DOI] [PubMed] [Google Scholar]
- 39.Holick MF, Binkley NC, Bischoff-Ferrari HA, Gordon CM, Hanley DA, Heaney RP, et al. Evaluation, treatment, and prevention of vitamin D deficiency: an Endocrine Society clinical practice guideline. J Clin Endocrinol Metab. 2011;96:1911–30. https://academic.oup.com/jcem/article/96/7/1911/2833671. [DOI] [PubMed]
- 40.Society for Adolescent Health and Medicine Recommended vitamin D intake and management of low vitamin D status in adolescents: a position statement of the society for adolescent health and medicine. J Adolesc Health. 2013;52:801–803. doi: 10.1016/j.jadohealth.2013.03.022. [DOI] [PubMed] [Google Scholar]
- 41.Pludowski P, Karczmarewicz E, Bayer M, Carter G, Chlebna-Sokół D, Czech-Kowalska J, et al. Practical guidelines for the supplementation of vitamin D and the treatment of deficits in Central Europe – recommended vitamin D intakes in the general population and groups at risk of vitamin D deficiency. Endokrynologia Polska. 2013;64:319–327. doi: 10.5603/EP.2013.0012. [DOI] [PubMed] [Google Scholar]
- 42.Gupta AK, Jamwal V, Sakul A, Malhotra P. Hypervitaminosis D and systemic manifestations: a comprehensive review. JIMSA. 2014;27:236–237. [Google Scholar]
- 43.MacLaughlin JA, Anderson RR, Holick MF. Spectral character of sunlight modulates photosynthesis of previtamin D3 and its photoisomers in human skin. Science. 1982;216:1001–1003. doi: 10.1126/science.6281884. [DOI] [PubMed] [Google Scholar]
- 44.Cole TJ, Green PJ. Smoothing reference centile curves: the LMS method and penalized likelihood. Stat Med. 1992;11:1305–1319. doi: 10.1002/sim.4780111005. [DOI] [PubMed] [Google Scholar]
- 45.Cacciari E, Milani S, Balsamo A, Spada E, Bona G, Cavallo L, et al. Italian cross-sectional growth charts for height, weight and BMI (2 to 20 yr) J Endocrinol Invest. 2006;29:581–593. doi: 10.1007/BF03344156. [DOI] [PubMed] [Google Scholar]
- 46.World Health Organization Expert Committee on Physical Status. The Use and Interpretation of Anthropometry. Physical Status: Report of a WHO Expert Committee: WHO Technical Report Series 854, WHO, Geneva, 1996. http://apps.who.int/iris/bitstream/handle/10665/37003/WHO_TRS_854.pdf [PubMed]
- 47.Fondazione Leone Moressa. I nati stranieri in Veneto dal 1999 al 2011. Mestre: Fondazione Leone Moressa; giugno 2013. www.fondazioneleonemoressa.org/newsite/wp-content/uploads/2013/06/i-nati-stranieri-dal-1999-al-2011-in-Veneto.pdf
- 48.Holick MF. Vitamin D deficiency. N Engl J Med. 2007;357:266–281. doi: 10.1056/NEJMra070553. [DOI] [PubMed] [Google Scholar]
- 49.Di Nisio A, De Toni L, D'Addato E, Pizzo MR, Sabatino P, Foresta T. 25-Hydroxyvitamin D insufficiency discriminates cardiovascular risk factors accumulation in peri-pubertal boys undergoing overweight screening. Endocrine. 2016;53:530–7. 10.1007/s12020-015-0725-4 Epub 2015 Sep 1. https://link.springer.com/article/10.1007%2Fs12020-015-0725-4. [DOI] [PubMed]
- 50.Ahmed SF, Franey C, McDevitt H, Somerville L, Butler S, Galloway P, et al. Recent trends and clinical features of childhood vitamin D deficiency presenting to a children's hospital in Glasgow. Arch Dis Child. 2011;96:694–696. doi: 10.1136/adc.2009.173195. [DOI] [PubMed] [Google Scholar]
- 51.Minkowitz B, Cerame B, Poletick E, et al. Low vitamin D levels are associated with need for surgical correction of pediatric fractures. J Pediatr Orthop. 2017;37:23–29. doi: 10.1097/BPO.0000000000000587. [DOI] [PubMed] [Google Scholar]
- 52.Pettifor JM. Nutritional rickets: pathogenesis and prevention. Pediatr Endocrinol Rev. 2013;10(Suppl 2):347–353. [PubMed] [Google Scholar]
- 53.Wagner CL, Greer FR. American academy of pediatrics section on breastfeeding; American Academy of Pediatrics Committee on nutrition. Prevention of rickets and vitamin D deficiency in infants, children, and adolescents. Pediatrics. 2008;122:1142–1152. doi: 10.1542/peds.2008-1862. [DOI] [PubMed] [Google Scholar]
- 54.Webb AR, Kline L, Holick MF. Influence of season and latitude on the cutaneous synthesis of vitamin D3: exposure to winter sunlight in Boston and Edmonton will not promote vitamin D3 synthesis in human skin. J Clin Endocrinol Metab. 1988;67:373–378. doi: 10.1210/jcem-67-2-373. [DOI] [PubMed] [Google Scholar]
- 55.Saggese G, Baroncelli GI, Bertelloni S, Webb AR, Holick MF. Effetto delle stagioni sulla sintesi della vitamina D3 a 43° latitudine nord. Riv Ital Pediatr. 1992;18:30–6 [not available online, cited on Baroncelli GI, Vierucci F, Bertelloni S. Profilassi dell’ipovitaminosi D nel lattante e nel bambino. In Ipovitaminosi D. Prevenzione e trattamento nel neonato, nel bambino e nell'adolescente, Chapter 4, Edited by Baroncelli GI, Fidenza: Mattioli; 2011:49–74]. https://www.vitaminad.it/wp-content/uploads/capitoli-di-baroncelli.pdf.
- 56.Webb AR, DeCosta BR, Holick MF. Sunlight regulates the cutaneous production of vitamin D3 by causing its photodegradation. J Clin Endocrinol Metab. 1989;68:882–887. doi: 10.1210/jcem-68-5-882. [DOI] [PubMed] [Google Scholar]
- 57.Turer CB, Lin H, Flores G. Prevalence of vitamin D deficiency among overweight and obese US children. Pediatrics. 2013;131:e152–e161. doi: 10.1542/peds.2012-1711. [DOI] [PubMed] [Google Scholar]
- 58.González-Molero I, Rojo-Martínez G, Morcillo S, Gutierrez C, Rubio E, Pérez-Valero V, et al. Hypovitaminosis D and incidence of obesity: a prospective study. Eur J Clin Nutr 2013 | doi:10.1038/ejcn.2013.48. www.ncbi.nlm.nih.gov/pubmed/23422920 [DOI] [PubMed]
- 59.Holick MF. Resurrection of vitamin D deficiency and rickets. J Clin Invest. 2006;116:2062–2072. doi: 10.1172/JCI29449. [DOI] [PMC free article] [PubMed] [Google Scholar]
- 60.Rajakumar K, Fernstrom JD, Holick MF, Janosky JE, Greenspan SL. Vitamin D status and response to Vitamin D3 in obese vs. non-obese African American children. Obesity (Silver Spring) 2008;16:90–95. doi: 10.1038/oby.2007.23. [DOI] [PubMed] [Google Scholar]
- 61.Didriksen A, Grimnes G, Hutchinson MS, Kjærgaard M, Svartberg J, Joakimsen RM, et al. The serum 25-hydroxyvitamin D response to vitamin D supplementation is related to genetic factors, BMI, and baseline levels. Eur J Endocrinol. 2013;169:559–67. www.ncbi.nlm.nih.gov/pubmed/23935129. [DOI] [PubMed]
- 62.Veugelers PJ, Ekwaru JP. A statistical error in the estimation of the recommended dietary allowance for vitamin D. Nutrients. 2014;6:4472–5. 10.3390/nu6104472https://www.ncbi.nlm.nih.gov/pmc/articles/PMC4210929/pdf/nutrients-06-04472.pdf. [DOI] [PMC free article] [PubMed]
- 63.Abrams SA, Hawthorne KM, Chen Z. Supplementation with 1000 IU vitamin D/d leads to parathyroid hormone suppression, but not increased fractional calcium absorption, in 4–8-y-old children: a double-blind randomized controlled trial. Am J Clin Nutr. 2013;97:217–23. 10.3945/ajcn.112.046102 First published November 14, 2012. https://www.ncbi.nlm.nih.gov/pmc/articles/PMC3522137/pdf/ajcn971225.pdf. [DOI] [PMC free article] [PubMed]
- 64.Holick MF, Binkley NC, Bischoff-Ferrari HA, Gordon CM, Hanley DA, Heaney RP, et al. Guidelines for preventing and treating vitamin D deficiency and insufficiency revisited. J Clin Endocrinol Metab. 2012;97:1153–1158. doi: 10.1210/jc.2011-2601. [DOI] [PubMed] [Google Scholar]
- 65.Mølgaard C, Thomsen BL, Michaelsen KF. Whole body bone mineral accretion in healthy children and adolescents. Arch Dis Child. 1999;81:10–15. doi: 10.1136/adc.81.1.10. [DOI] [PMC free article] [PubMed] [Google Scholar]
- 66.Vidailhet M, Mallet E, Bocquet A, et al. Vitamin D: still a topical matter in children and adolescents. A position paper by the committee on nutrition of the French Society of Paediatrics. Arch Pediatr. 2012;19:316–328. doi: 10.1016/j.arcped.2011.12.015. [DOI] [PubMed] [Google Scholar]
- 67.Lewis RD, Laing EM, Hill Gallant KM, Hall DB, McCabe GP, Hausman DB, et al. A Randomized Trial of Vitamin D Supplementation in Children: Dose-Response Effects on Vitamin D Metabolites and Calcium Absorption. J Clin Endocrinol Metab. 2013;98:4816–4825. doi: 10.1210/jc.2013-2728. [DOI] [PMC free article] [PubMed] [Google Scholar]
- 68.Cosenza L, Pezzella V, Nocerino R, Di Costanzo M, Coruzzo A, Passariello A, et al. Calcium and vitamin D intakes in children: a randomized controlled trial. BMC Pediatr. 2013;13:86. doi: 10.1186/1471-2431-13-86. [DOI] [PMC free article] [PubMed] [Google Scholar]
- 69.Shanely RA, Nieman DC, Knab AM, Gillitt ND, Meaney MP, Jin F, et al. Influence of vitamin D mushroom powder supplementation on exercise-induced muscle damage in vitamin D insufficient high school athletes. Sports Sci. 2014;32:670–679. doi: 10.1080/02640414.2013.847279. [DOI] [PubMed] [Google Scholar]
- 70.Sacheck JM, Van Rompay MI, Chomitz VR, Economos CD, Eliasziw M, Goodman E, et al. Impact of three doses of vitamin D3 on serum 25(OH)D deficiency and insufficiency in at-risk schoolchildren. J Clin Endocrinol Metab. 2017;102:4496–4505. doi: 10.1210/jc.2017-01179. [DOI] [PMC free article] [PubMed] [Google Scholar]
Associated Data
This section collects any data citations, data availability statements, or supplementary materials included in this article.
Supplementary Materials
Dataset of active group A (n = 82). (XLS 43 kb)
Dataset of control group B (n = 121). (XLS 95 kb)
Data Availability Statement
All data analysed during this study are included in this published article and its supplementary information files.